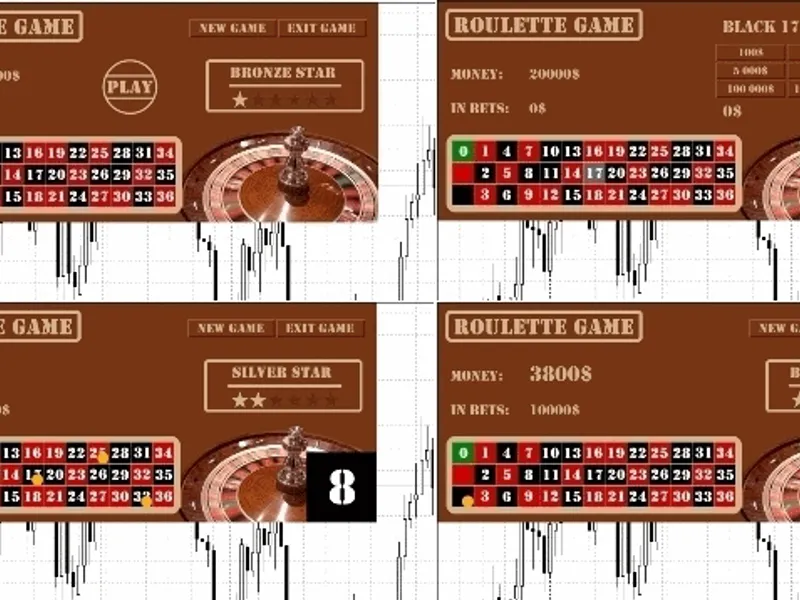
Roulette GameUnpack the roulettegame_en.zip file into the data folder of your MetaTrader 5 client terminal. For example, this is typically located at c:\Program Files\MetaTrader 5....
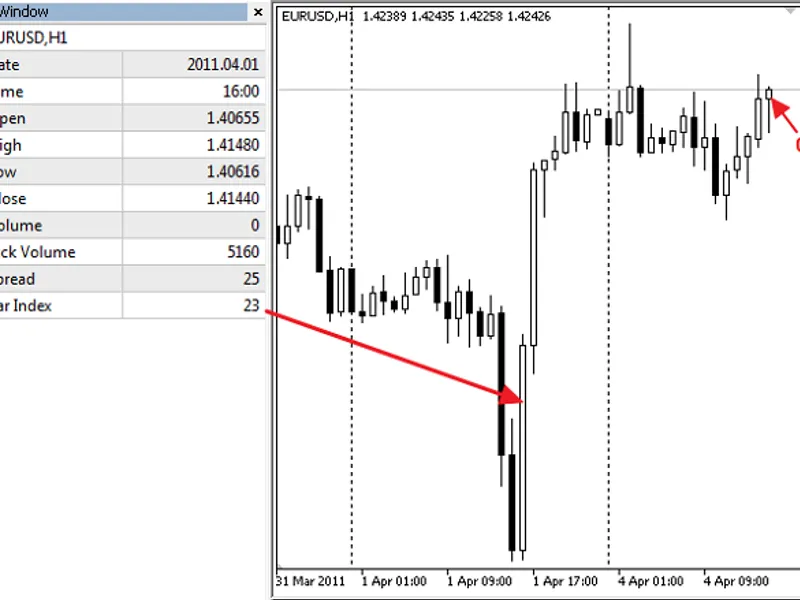
This is an example of the indicator, that shows bars index in the data window.The bar indexing is set such that the current uncompleted bar has index=0, and the oldest bar has the ...
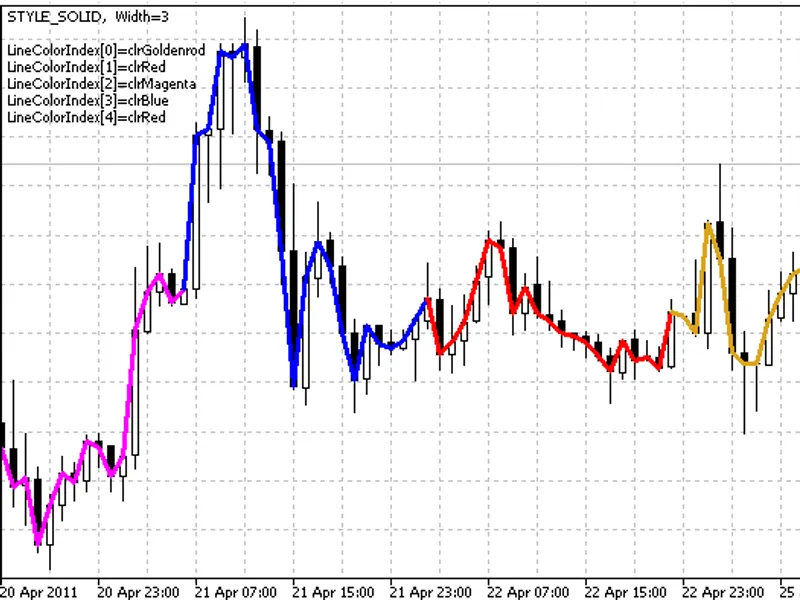
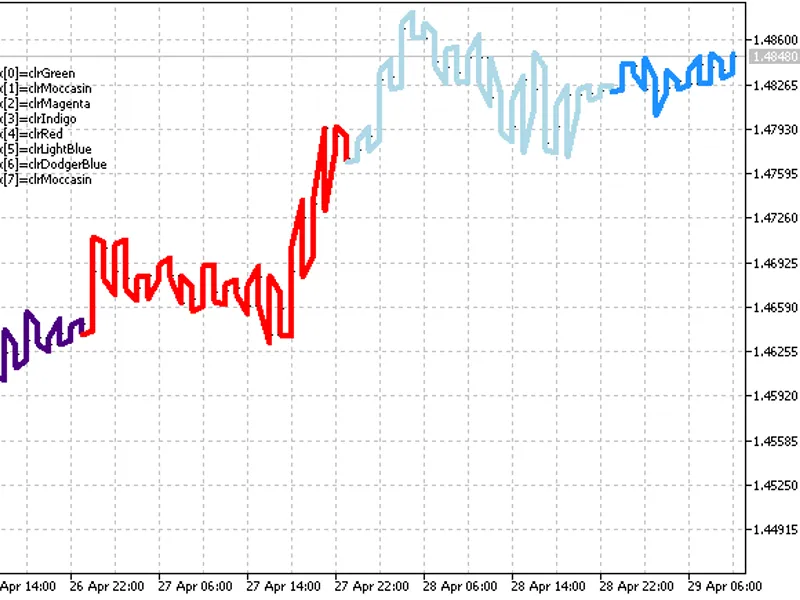
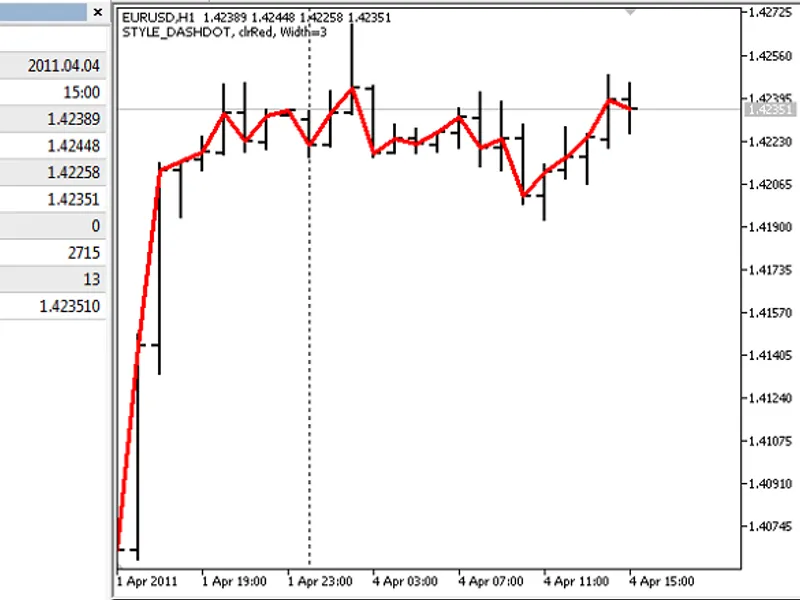
This indicator plots the open prices of bars as a line.The line's color, width, and style change randomly every 5 ticks.The width, color, and style can be defined using preprocesso...
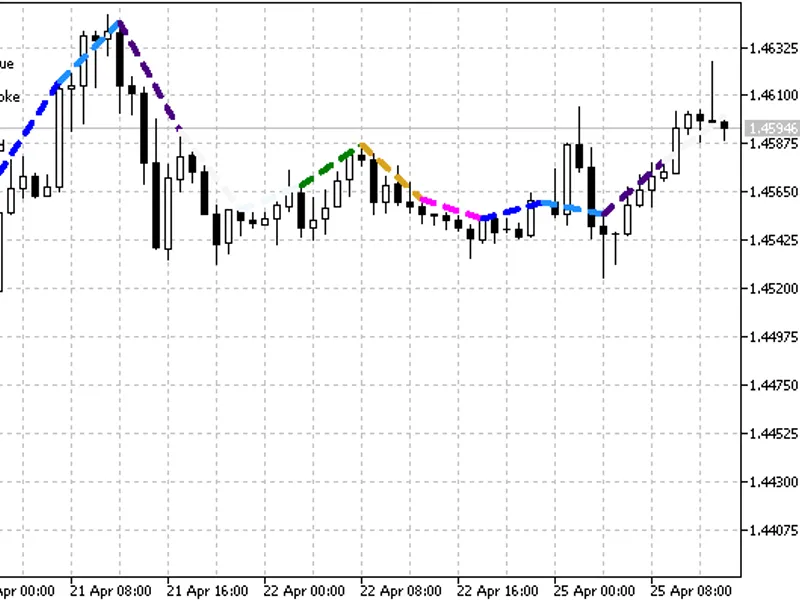
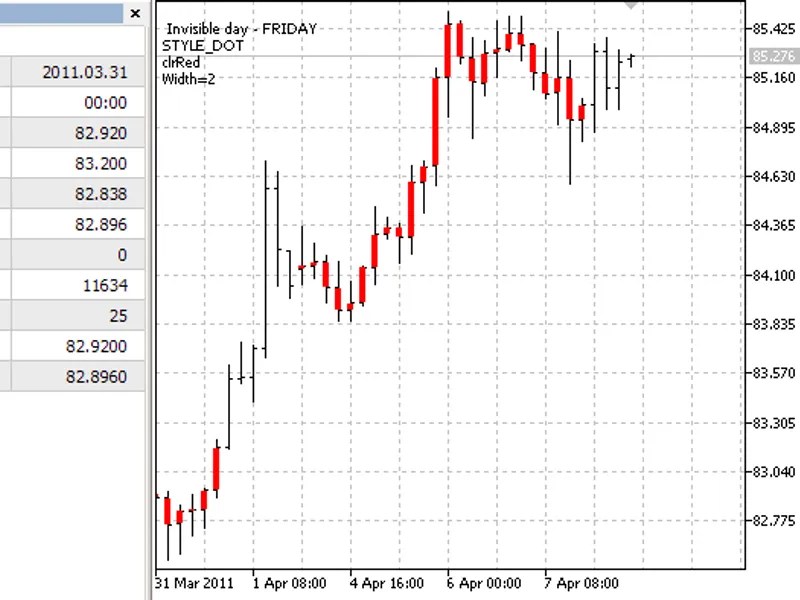
This indicator plots sections between the high and low prices of bars.The color, width, and style of the sections change randomly every N ticks.Initial properties of the plot are d...
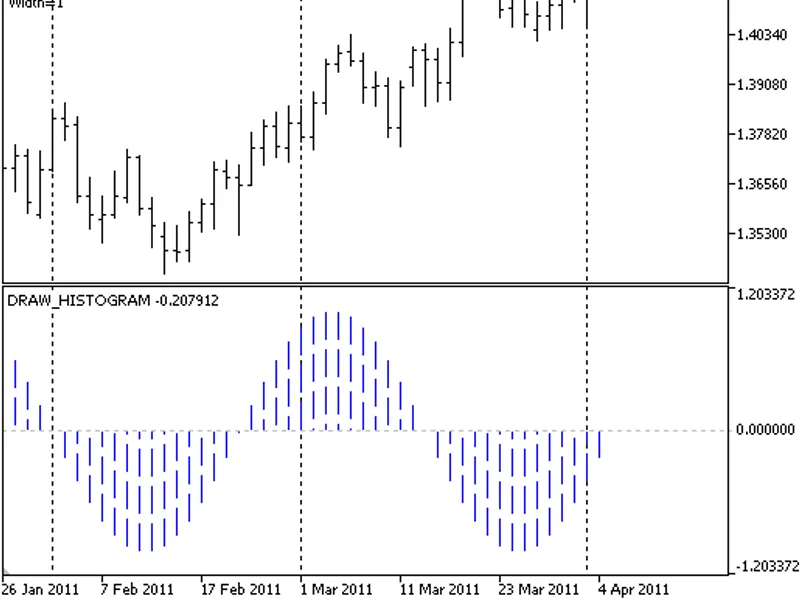
This indicator plots a graph of a function in a separate window.Indicator DescriptionThe histogram color, width, and line style are changed randomly every n ticks. The period of th...
This indicator plots a vertical section for each bar between the open and close prices.The indicator can be displayed in a separate window or the main chart window.It does not plot...
The indicator calculates your risk as a percentage and gives you the lot size that is acceptable for your risk. You only need to specify the risk in percent and the stop size in pi...
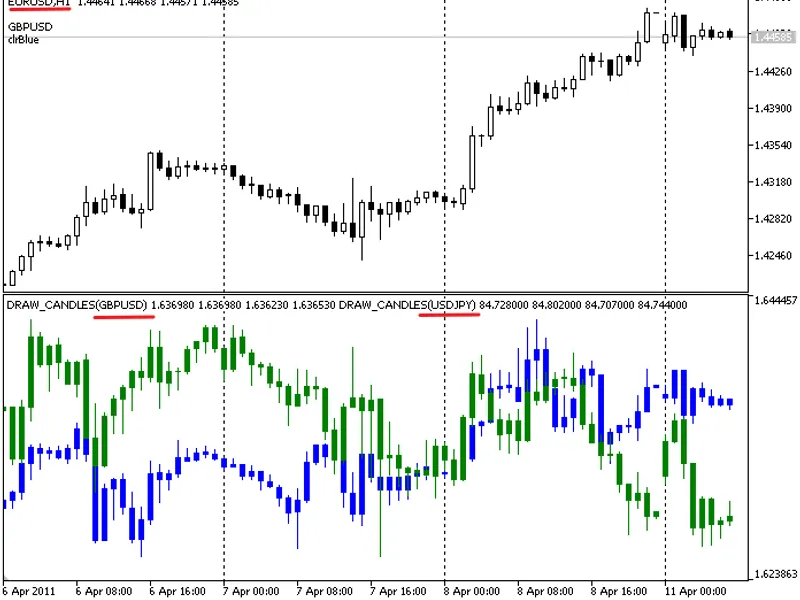
This indicator displays candlesticks for two symbols in a separate chart window.The indicator plots candles using the values from four indicator buffers representing open, high, lo...
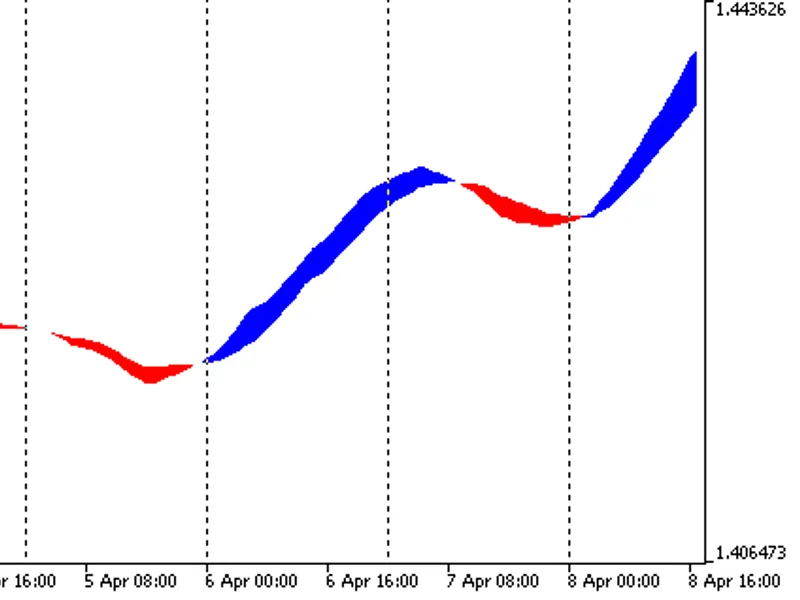
This indicator plots a channel based on two moving averages with different periods in a separate window.The change in the channel color indicates a trend change.The drawing style p...
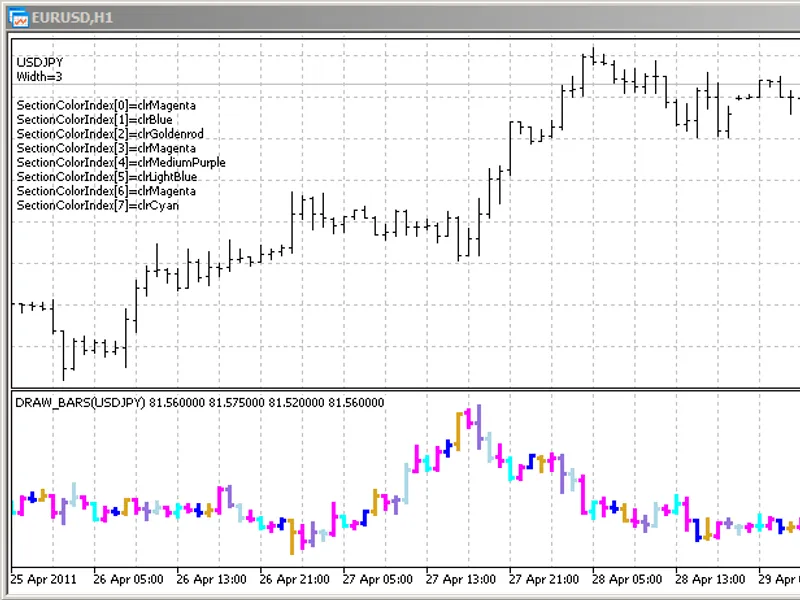
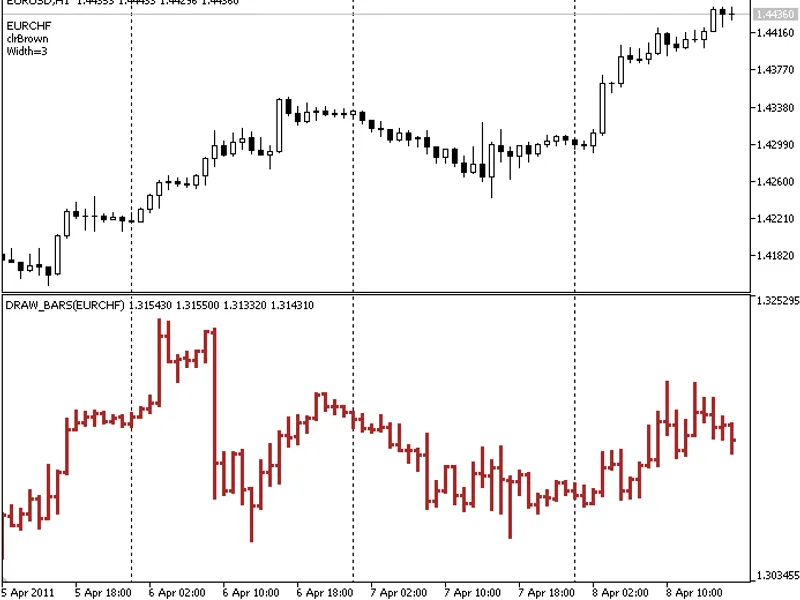
This indicator plots the bars of a specified symbol in a separate chart window.The indicator draws bars using the values from four indicator buffers representing the open, high, lo...
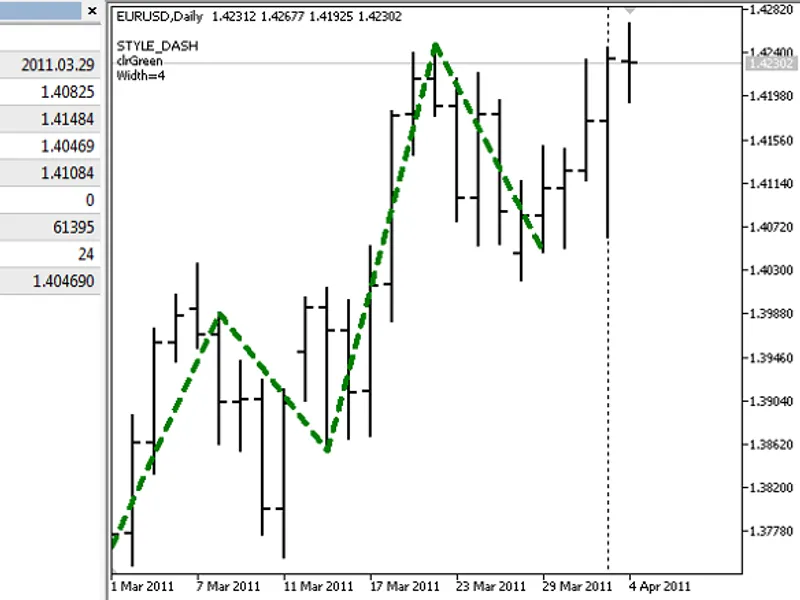
This indicator plots the ZigZag indicator using high and low prices.The drawing style allows for the creation of sections based on the values of two indicator buffers. This feature...
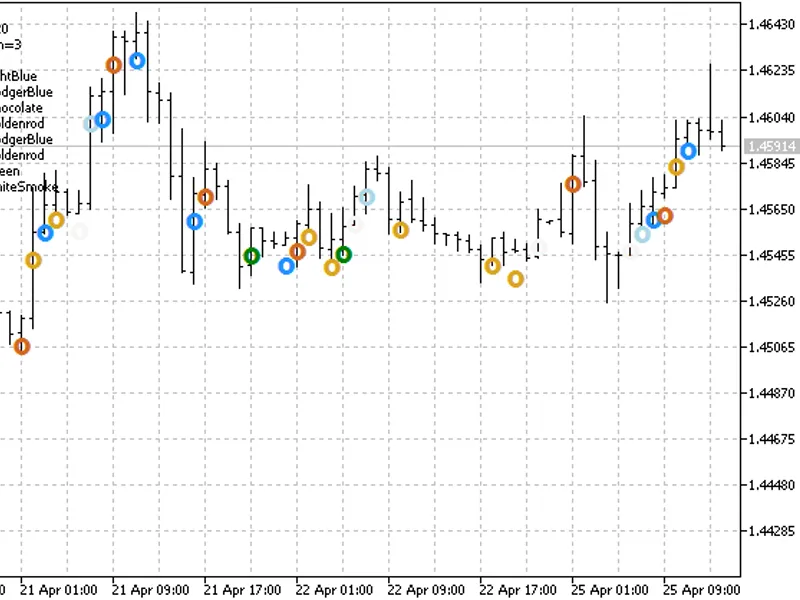
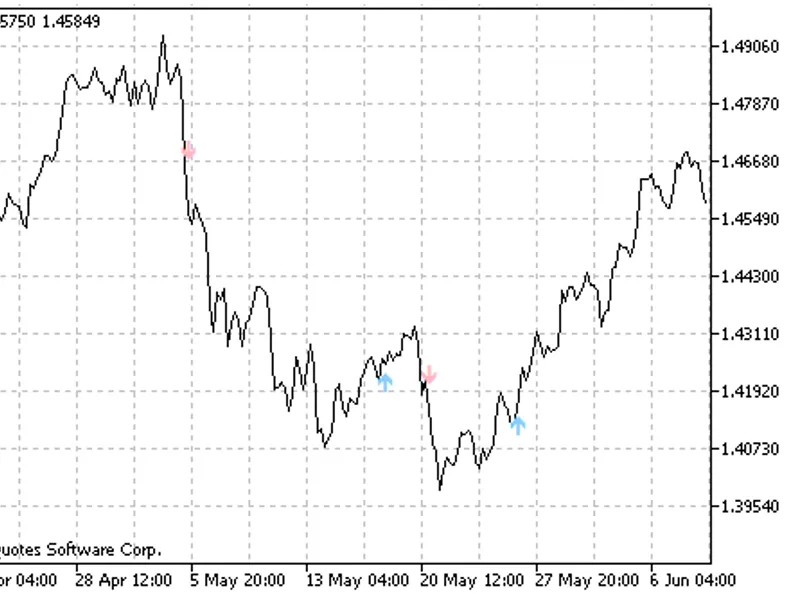
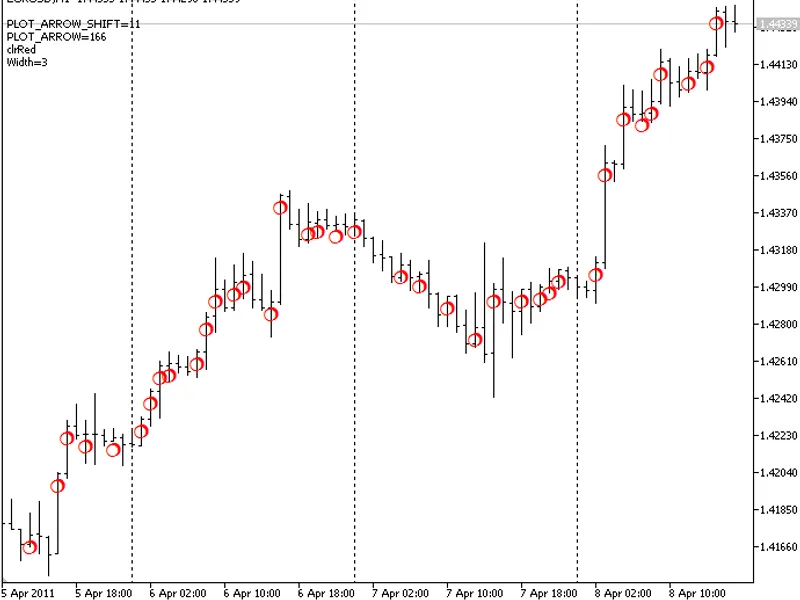
This indicator plots arrows on the chart when the current bar's closing price is greater than the previous bar's closing price.The color, width, shift, and character code of the ar...
IntroductionNumerous programs exist for creating self-similar sets defined by Iterated Function Systems (IFS). This article explores how to study these beautiful sets within the Me...
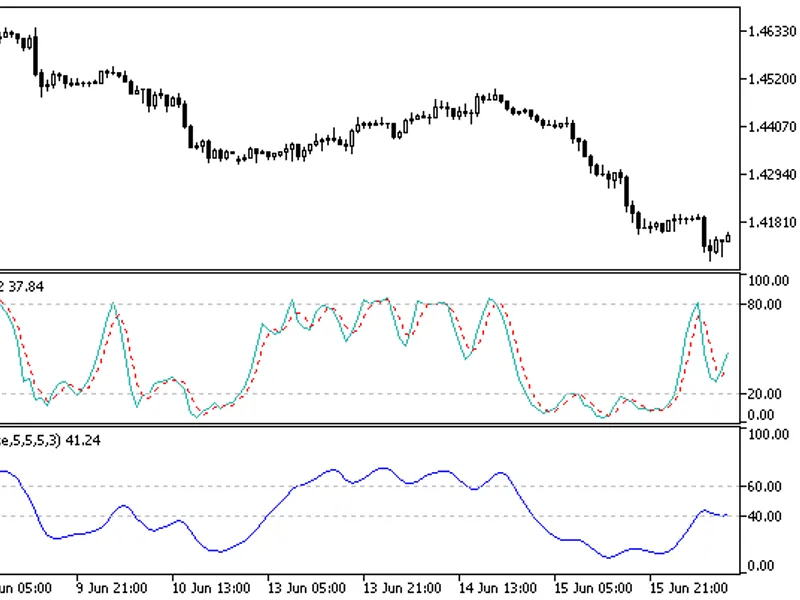
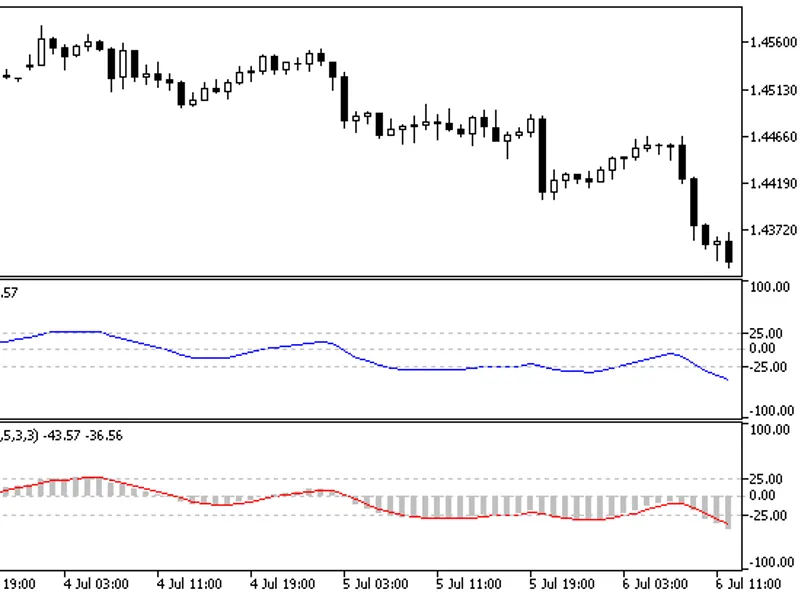
Premier Stochastic Oscillator [v01]
This indicator is based on an article published in TASC magazine by Lee Leibfarth in August 2008.
Refer to the original article for detailed e...
This indicator plots a line based on the closing price, with colors changing according to the specified drawing style.It utilizes two indicator buffers. The first buffer stores the...
This indicator demonstrates drawing styles by plotting color sections with a specified number of bars. Two indicator buffers are utilized: the first stores the high price of the ba...
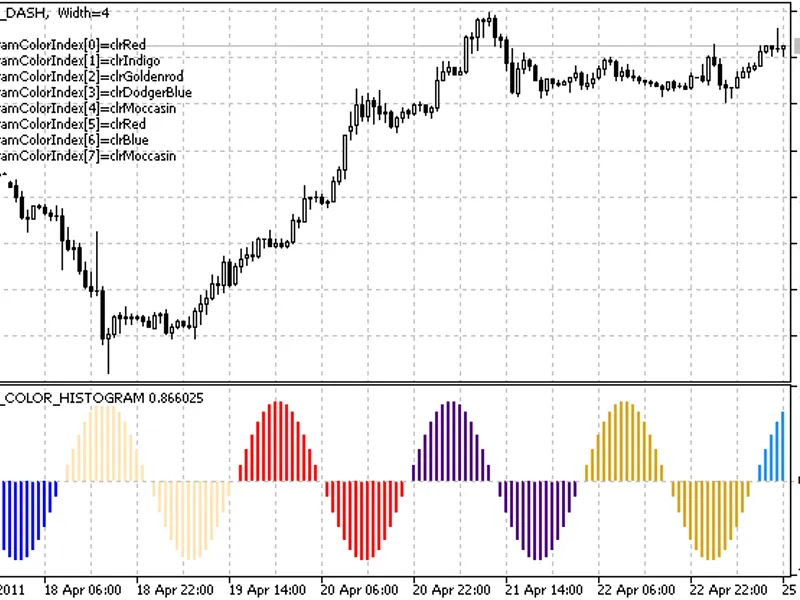
This indicator demonstrates drawing styles by plotting a sin(x) function as a color histogram in a separate window.
Two indicator buffers are utilized: the first contains the sin(x...
This indicator demonstrates drawing styles for each bar by plotting a section between the open and close prices.It utilizes three indicator buffers:- The first buffer stores the hi...
This indicator demonstrates a method for drawing arrows on the chart.It utilizes symbols from the windings font to represent these arrows.Two indicator buffers are employed: one st...
An indicator that draws a ZigZag based on high and low prices, utilizing a customizable drawing style.The color, thickness, and style of the ZigZag lines are randomly changed every...
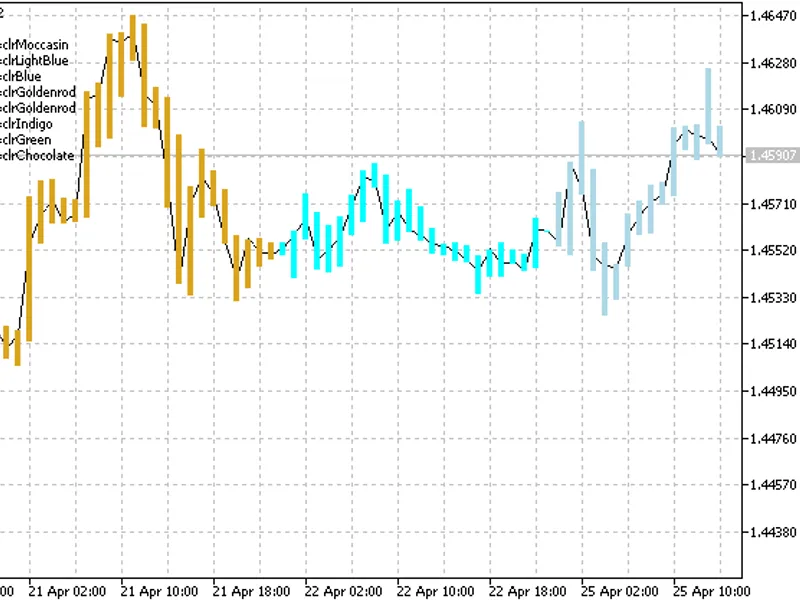
This is an example indicator that draws bars for a specified instrument in a separate window.The color of the bars changes randomly every N ticks.The N parameter of the indicator i...
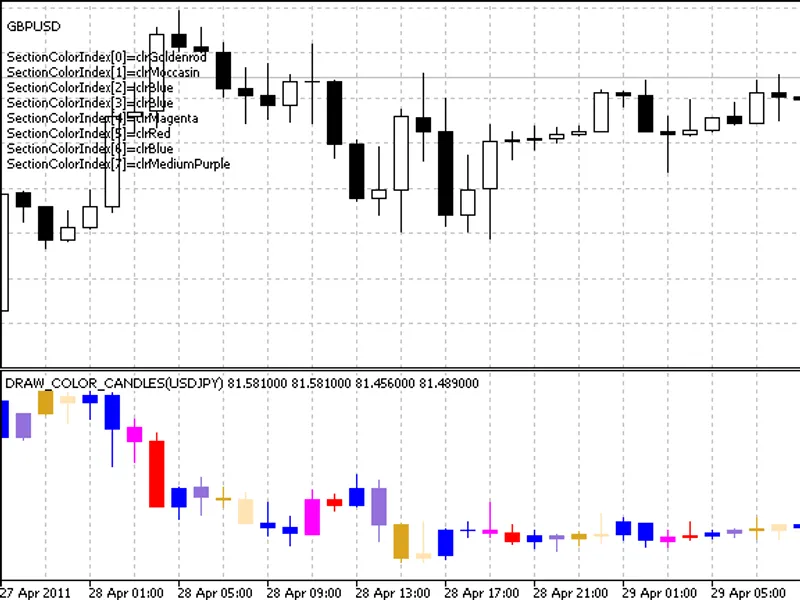
This is an example of an indicator that draws candlesticks for a specified instrument in a separate window.Indicator DescriptionThe color of the candlesticks changes randomly every...
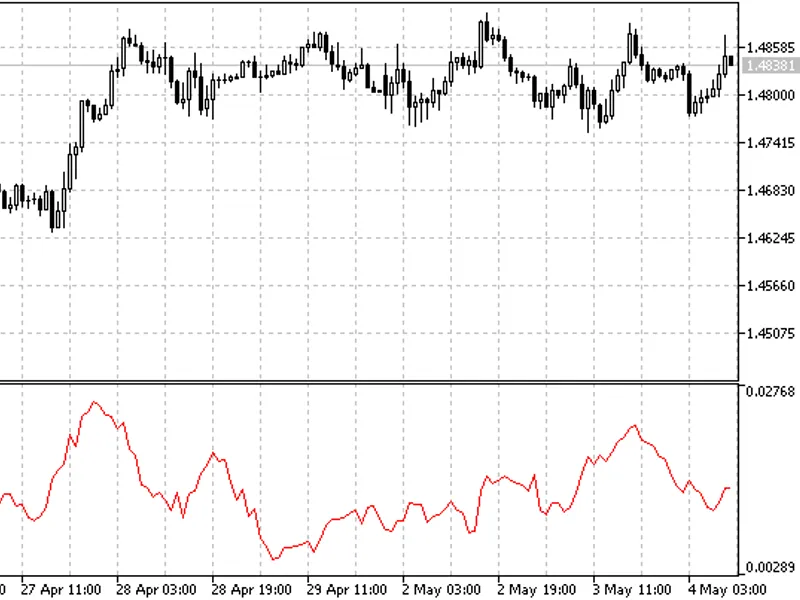
The Kaufman Volatility Indicator (KVI) is a technical analysis tool designed to measure the degree of price variation in a financial market.Developed by Perry J. Kaufman, this indi...
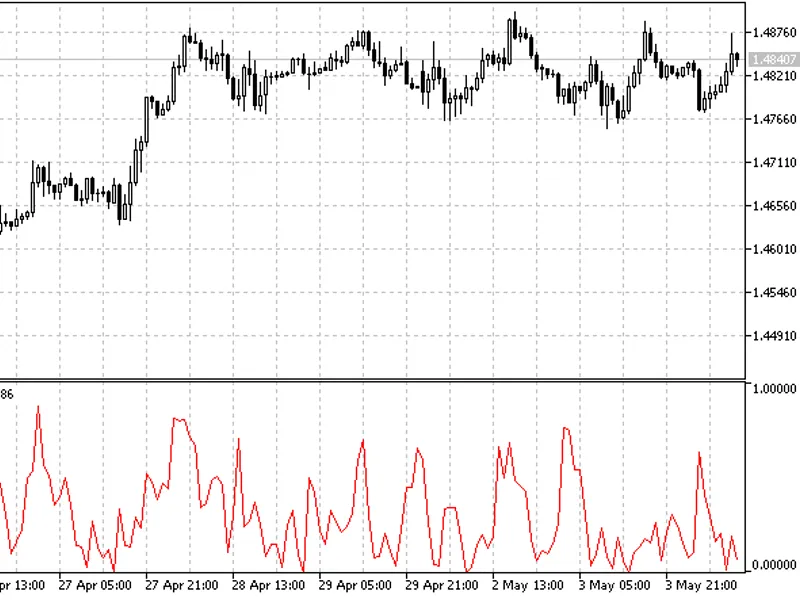
The Kaufman Efficiency Ratio (KER) is a technical indicator developed by Perry Kaufman. It measures the efficiency of price movement by comparing the distance prices have moved to ...
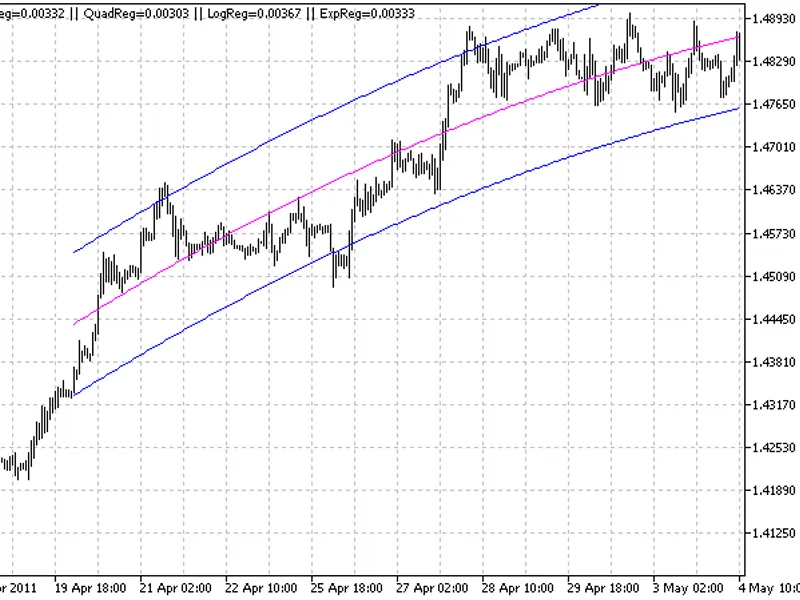
This indicator performs a regression analysis, comparing four types: linear, quadratic, logarithmic, and exponential. It automatically selects the regression type that best fits th...
This script converts time, represented as a variable, into its constituent components: year, month, day, hour, minutes, and seconds.It does not utilize MQL5 built-in time functions...
This is a tool to calculate the summary assets of each currency.Introduction to Exposure CalculatorThe Exposure Calculator is designed to provide a summary of assets for each curre...
The buy/sell signals of the indicator are based on the crossover of two moving averages with different periods.The indicator includes the following features:- A filter based on the...
This module offers a flexible approach to strategy creation by allowing the use of different components. For instance, the core strategy logic can be developed by one programmer, w...
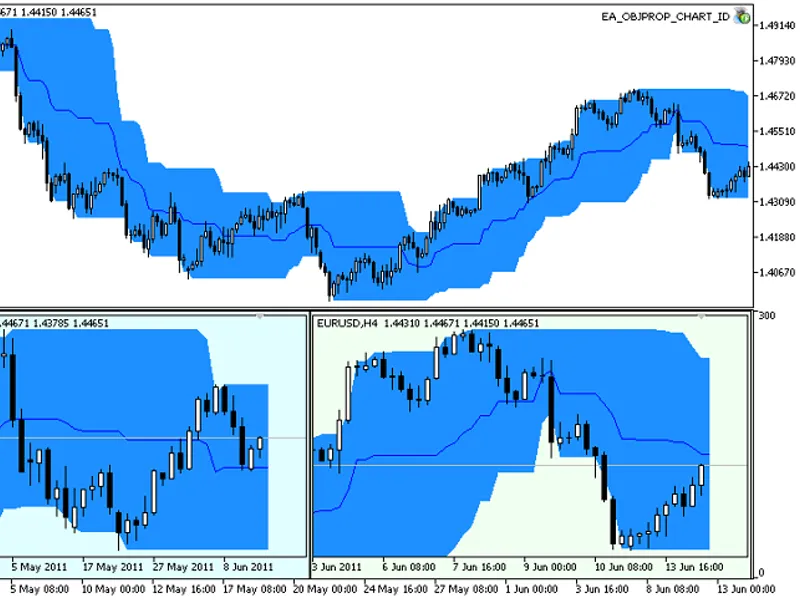
This Expert Advisor (EA) allows you to place and manage chart objects on your MetaTrader chart as conventional chart elements. The core functionality relies on obtaining the handle...
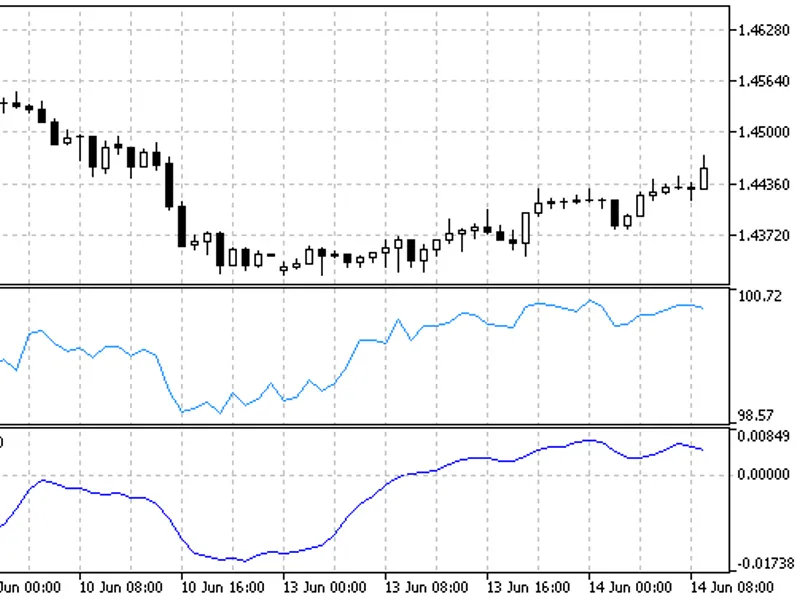
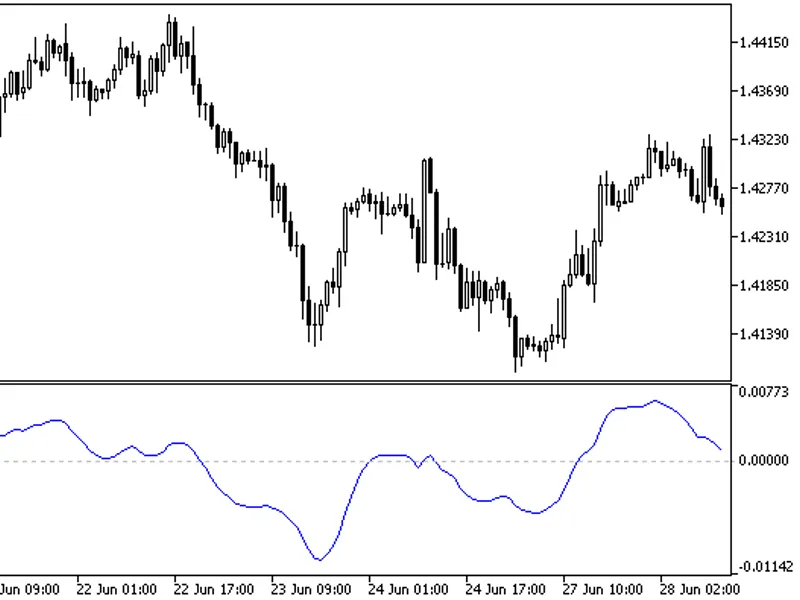
Blau Momentum Indicator (MTM) by William Blau.
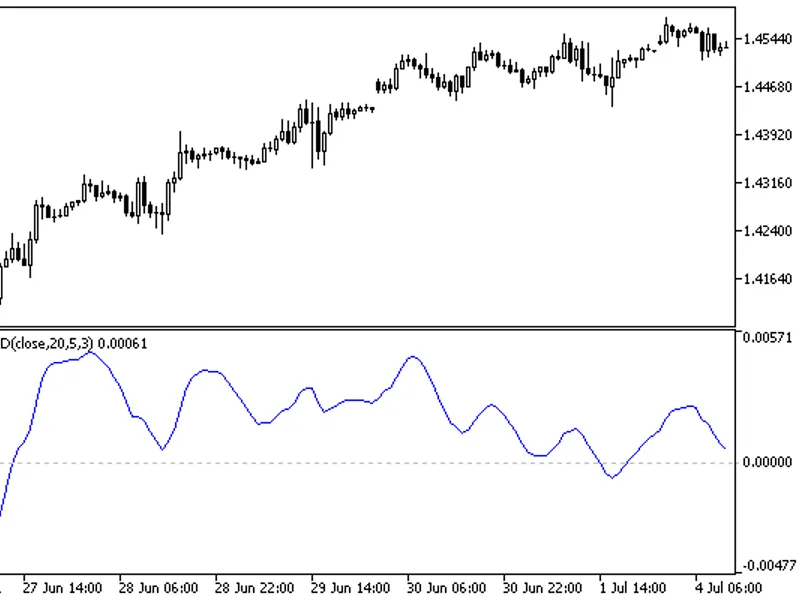
This indicator calculates the absolute price change and applies smoothing, offering a different approach compared to the standard bui...
True Strength Index Indicator by William Blau.True Strength Index(TSI, Q-Period Smoothed Momentum) is a normalized momentum indicator developed by William Blau. The indicator value...
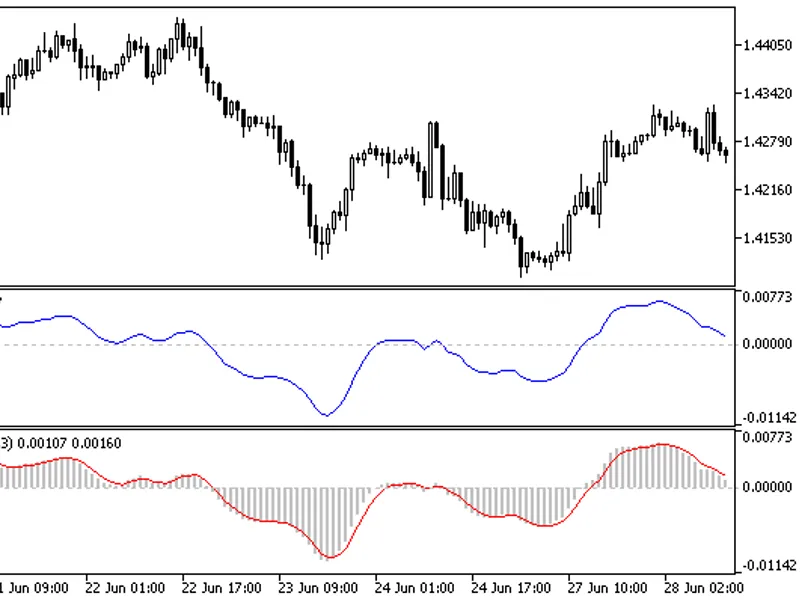
The Ergodic Oscillator, developed by William Blau, is an indicator designed to signal trend reversals.It utilizes a signal line for identifying potential changes in trend direction...
Smoothed Q-Period Stochastic Indicator by William Blau
This indicator is based on the standard stochastic indicator and calculates the distance between the current closing price a...
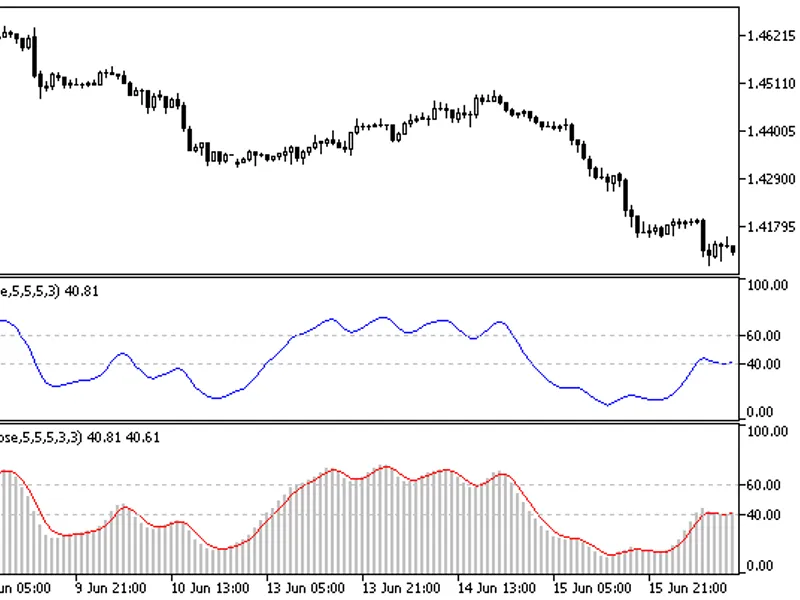
Stochastic Index (Normalized Smoothed Q-Period Stochastic) by William Blau.
This indicator normalizes and maps the values of a Q-period smoothed stochastic into the [0, 100] interv...
Stochastic Oscillator Blau TS is based on the work of William Blau.
Installation:
Place the file willamblau.mqh in the following directory:
terminal_data_folder\mql5\include\
Pla...
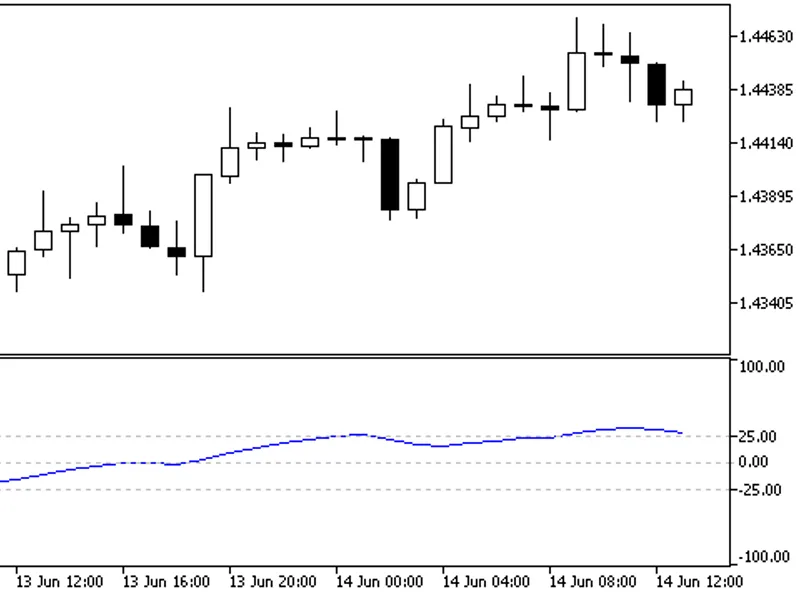
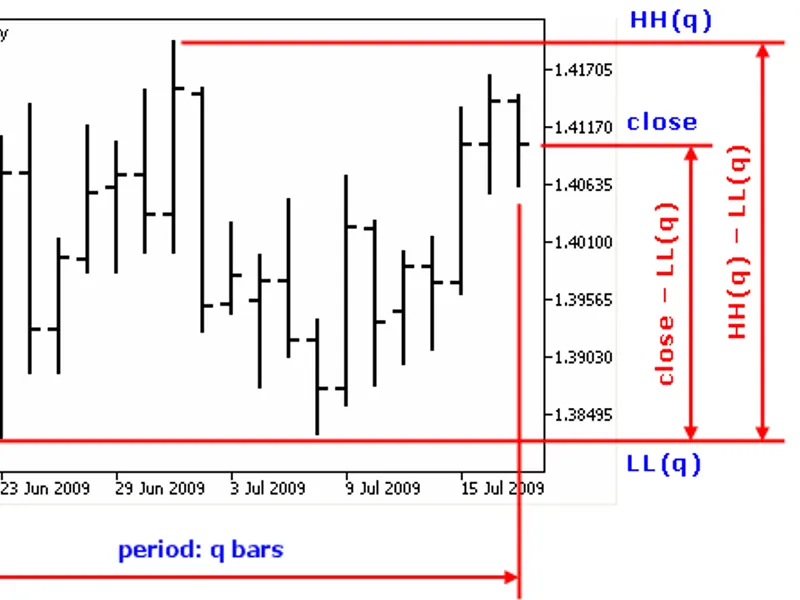
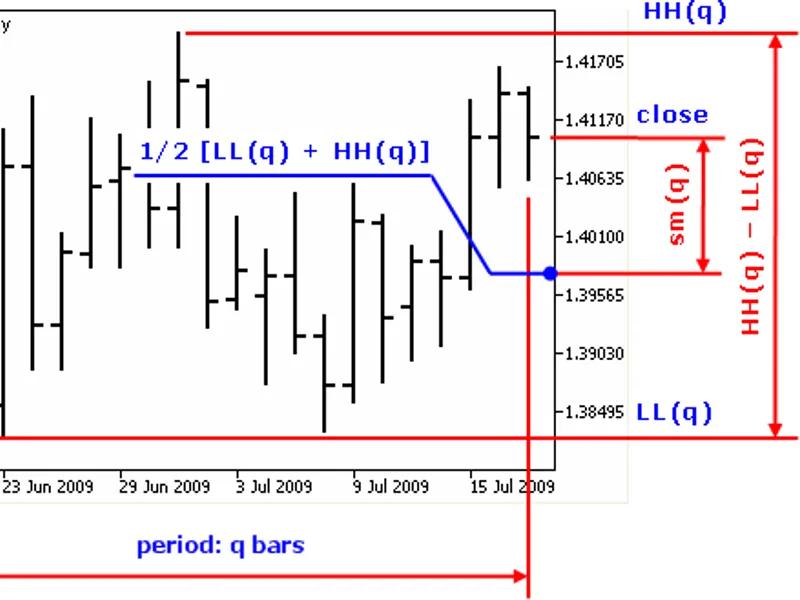
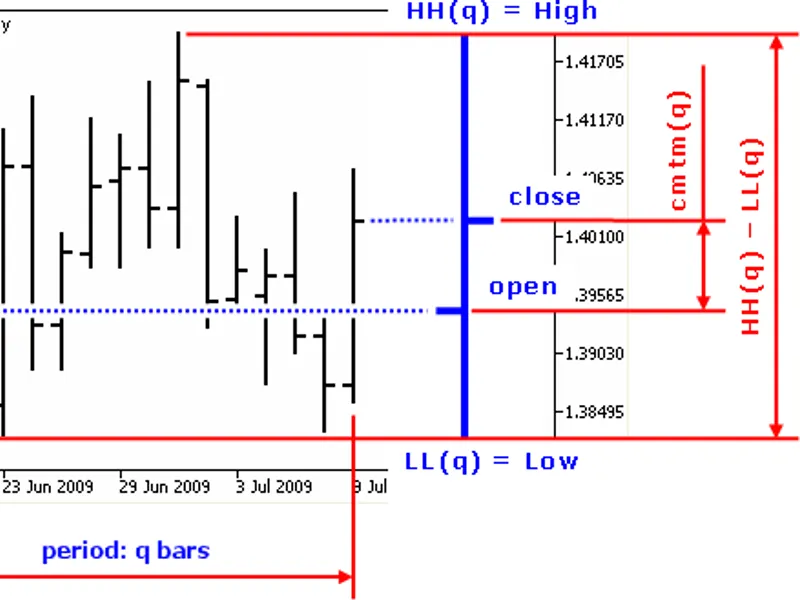
Stochastic Momentum (SM) Indicator by William BlauThe Q-period Stochastic Momentum is defined as the distance of the current close price from the midpoint of the Q bars.The value o...
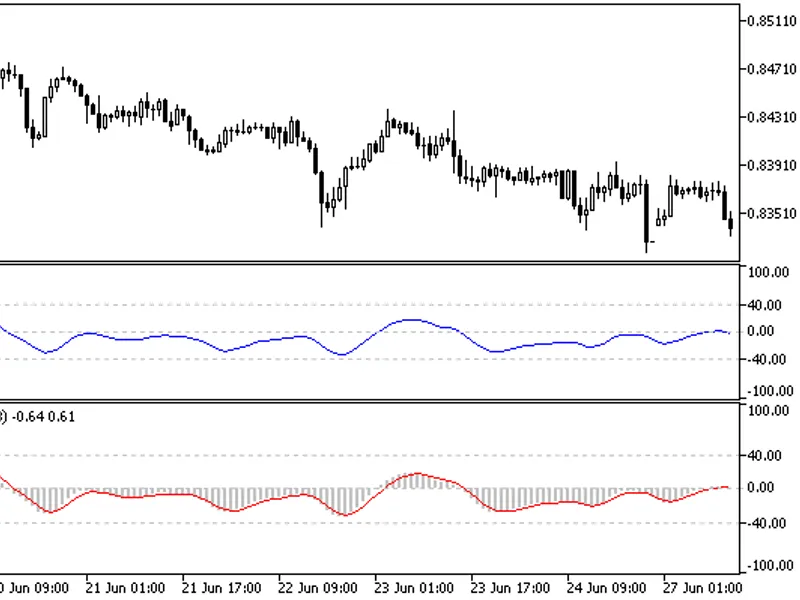
Stochastic Momentum Index (SMI) by William Blau is based on the indicator. The Stochastic Momentum Index is normalized to half of a Q-period price range and mapped into the [–100,+...
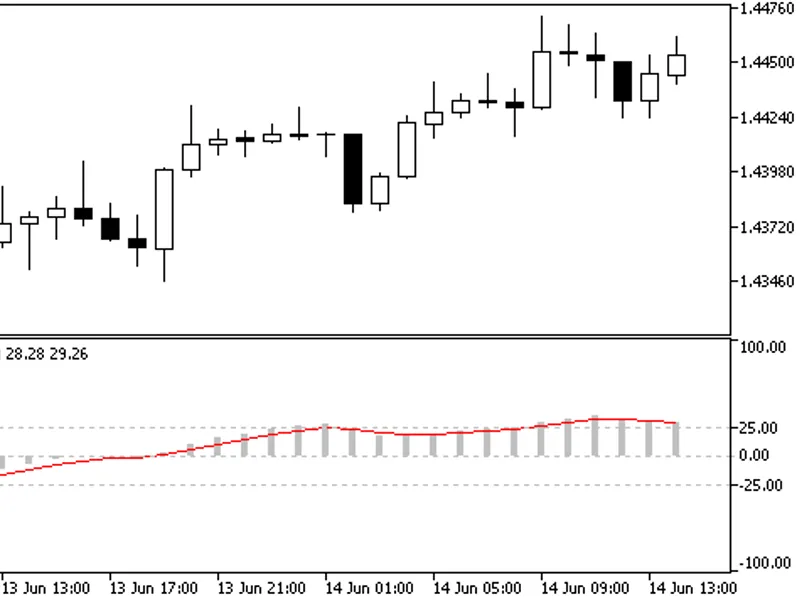
Stochastic Momentum Oscillator by William Blau
This indicator is based on the Stochastic Oscillator.
To use this indicator, you need to place the following files in the specified...
Ergodic MDI (Mean Deviation Index) is a double-smoothed version of the Mean Deviation Index. The mean deviation is defined as the distance between the closing price and an exponent...
Ergodic MDI Oscillator by William Blau is based on.Usage:williamblau.mqh must be placed in terminal_data_folder\mql5\include\blau_ergodic_mdi.mq5 must be placed in terminal_data_fo...
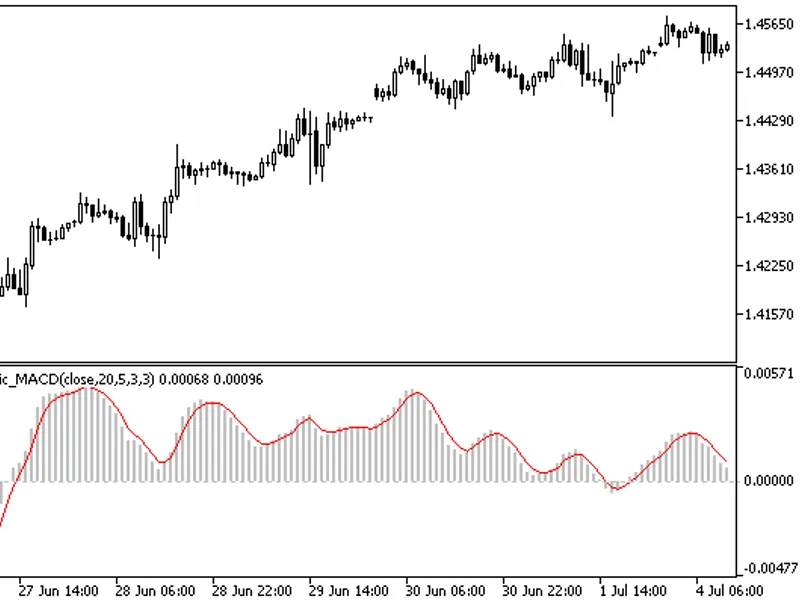
The Moving Averages Convergence/Divergence indicator is a technical indicator that calculates the difference between two moving averages.
It is the difference between two exponent...
The Ergodic MA C D Oscillator is described in a book by William Blau. To use this oscillator, the williamblau.mqh file must be placed in the terminal_data_folder\mql5\include\ dire...
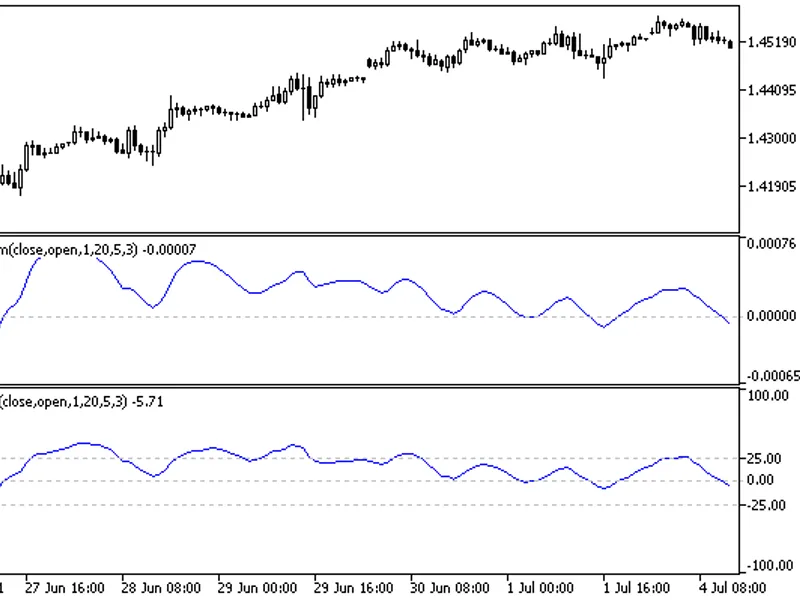
Candlestick Momentum Indicator (Q-Period Candlestick Momentum) by William Blau.To use this indicator, place the williamblau.mqh file in your terminal_data_folder/mql5/include/ dire...
Candlestick Momentum Index (CMI) IndicatorThe Candlestick Momentum Index (CMI) is an indicator described by William Blau. This indicator is normalized and mapped to the [-100, +100...
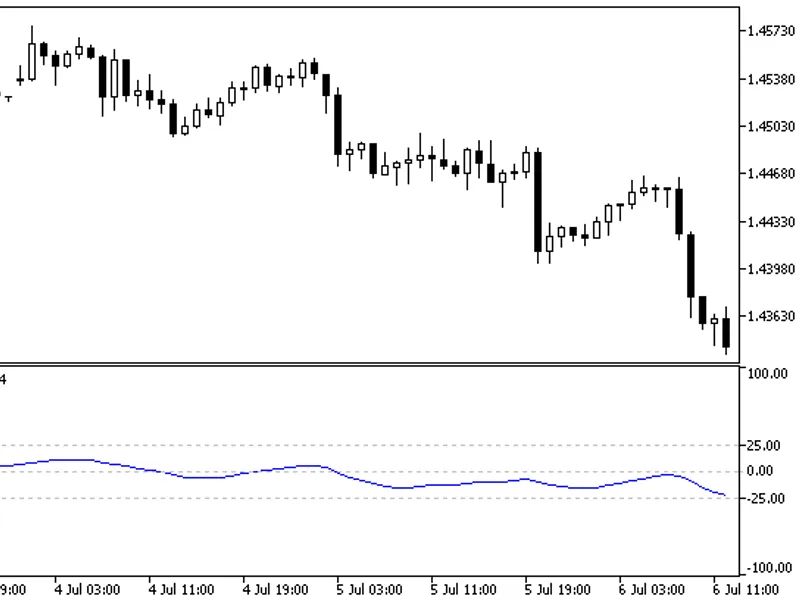
Candlestick Index (CSI) is a technical indicator that is based on the concept of candlestick momentum and is used to identify overbought and oversold states of the market.The value...
Ergodic CM Oscillator by William Blau
Installation:
Place williamblau.mqh in the terminal_data_folder/mql5/include/ directory.Place blau_cmi.mq5 in the terminal_data_folder/mql5/i...


![Vinin Cyber Cycle Indicator [v01] indicator MT5](/images/9787.webp)
![Premier Stochastic Oscillator [v01] indicator MT5](/images/9786.webp)