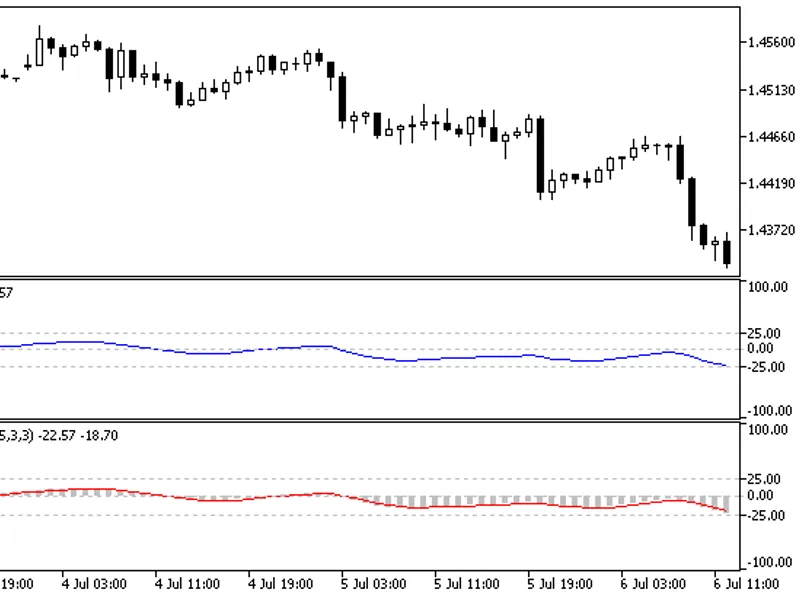
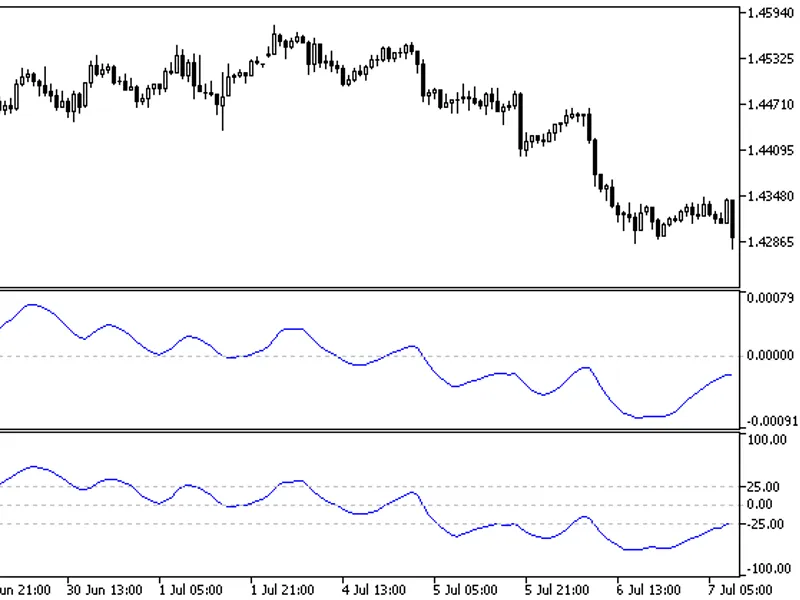
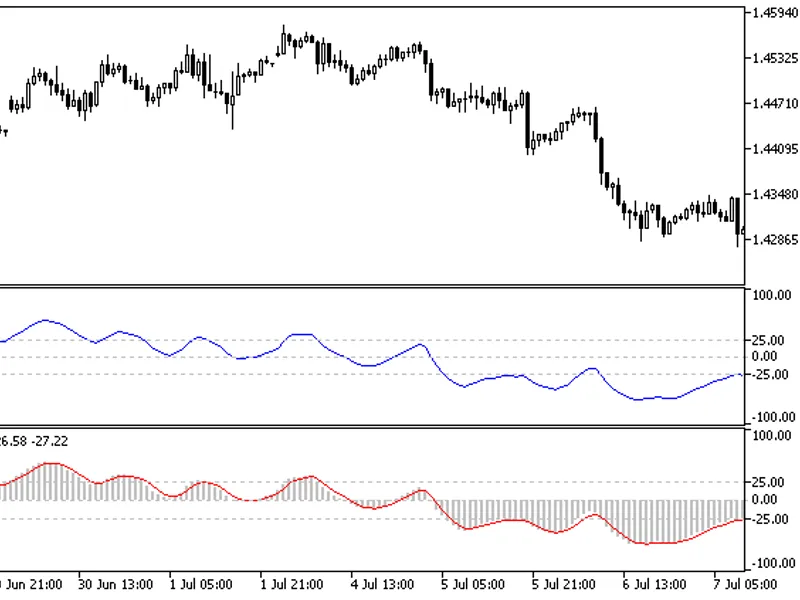
The Ergodic CSI Oscillator is described in a book by Blau.
To use this oscillator, certain files must be placed in specific folders:
- williamblau.mqh must be placed in the termi...
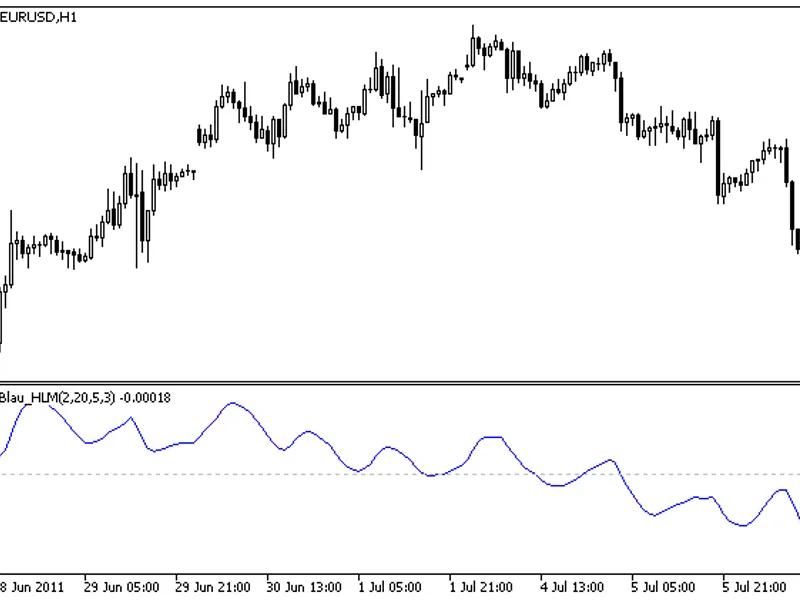
Composite High/Low Momentum Indicator
The Composite High/Low Momentum indicator is based on the work of William Blau.
Installation:
Place williamblau.mqh in the following directo...
The Directional Trend Index (DTI) indicator is based on a calculation described by William Blau.To use this indicator:Place the williamblau.mqh file in your MetaTrader terminal's M...
Ergodic DTI-Oscillator is described in a book by William Blau in 2026.To use this indicator, williamblau.mqh must be placed in the terminal_data_folder\mql5\include\ directory and ...
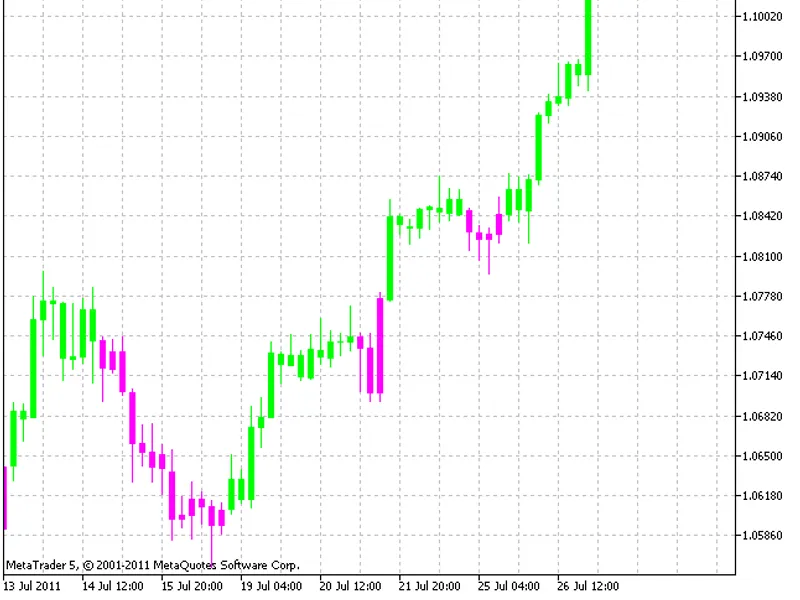
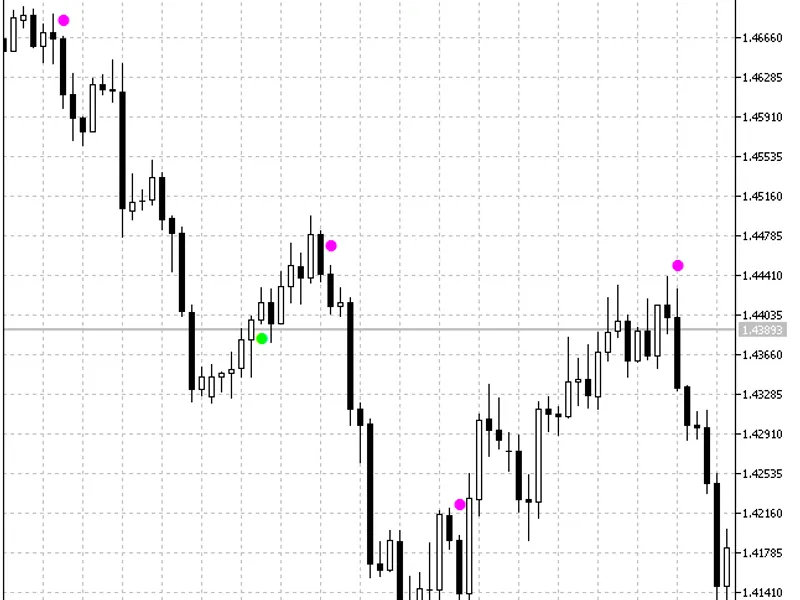
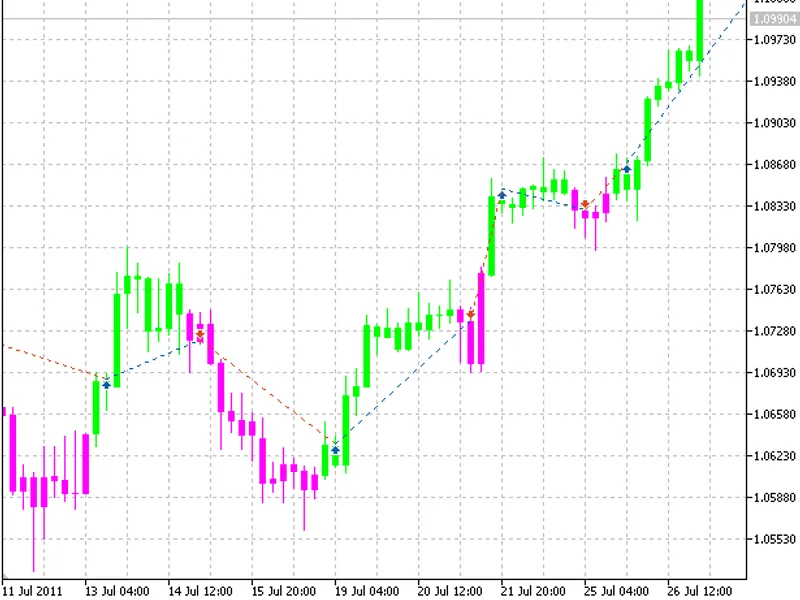
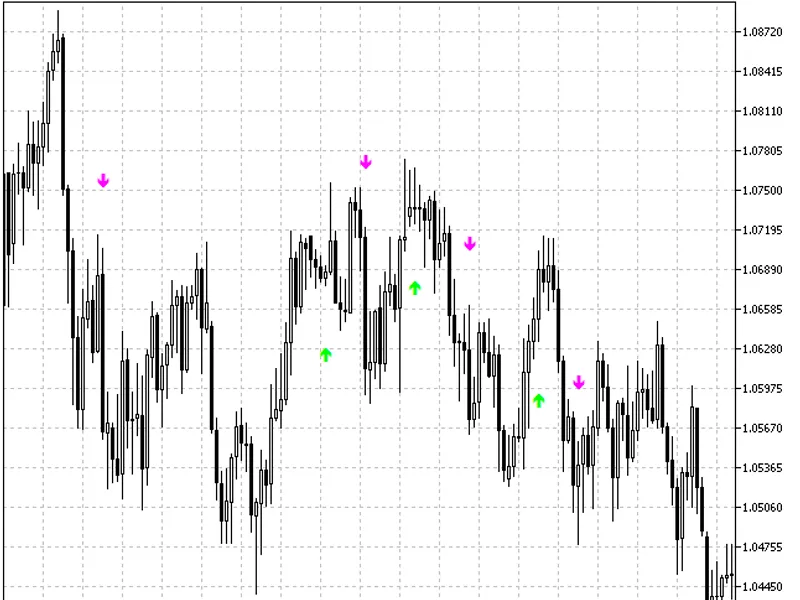
BrainTrend2 is a market trend indicator that colors candlesticks based on trend direction.During a downward trend, all candlesticks are colored magenta.As soon as the trend becomes...
BrainTrend2 Signal is a market trend indicator that assigns colors to candlesticks based on the trend direction.During a downward trend, all candlesticks are colored red.As soon as...
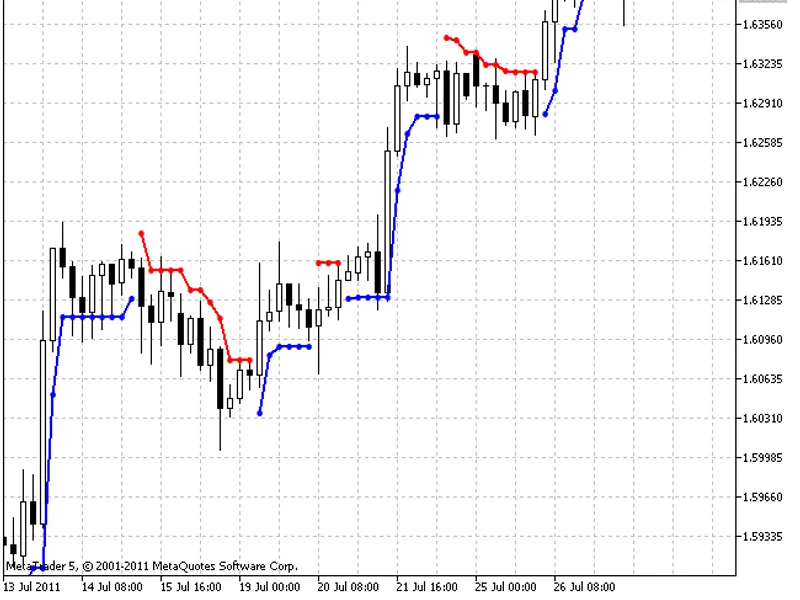
BrainTrend2Stop is a trend reversal detection indicator visualized as a stop line.The intersection of this line signals a trend reversal and indicates the optimal time to close exi...
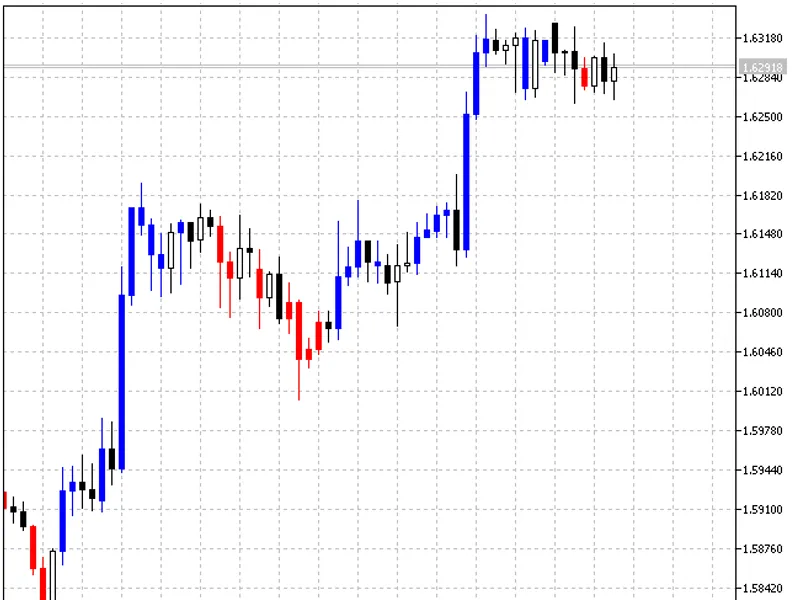
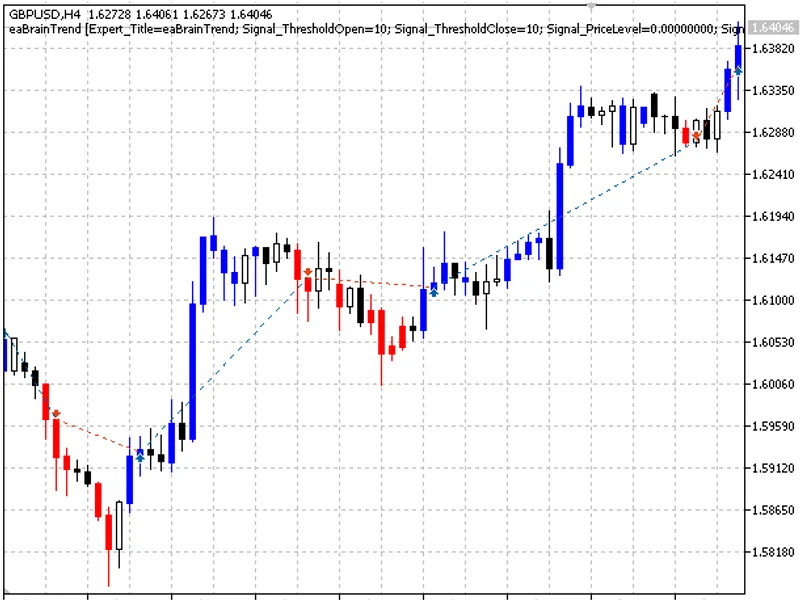
BrainTrend1 is a market direction indicator.It indicates trend directions using colors.When the price changes or stays in an up-trend, the candlesticks are colored blue.When the pr...
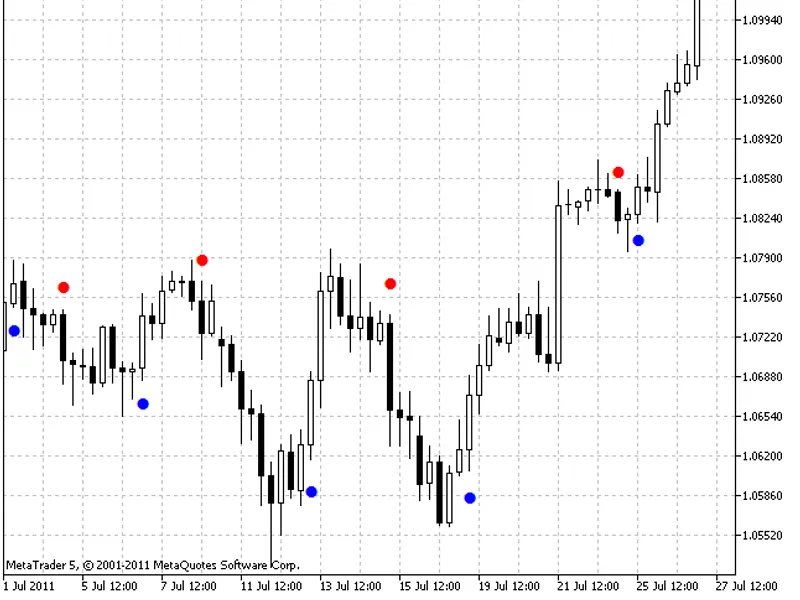
Brain Trend 1 Sig is a market indicator designed to signal positions opening and closing.It identifies potential trend reversal points when the price reaches extreme values, indica...
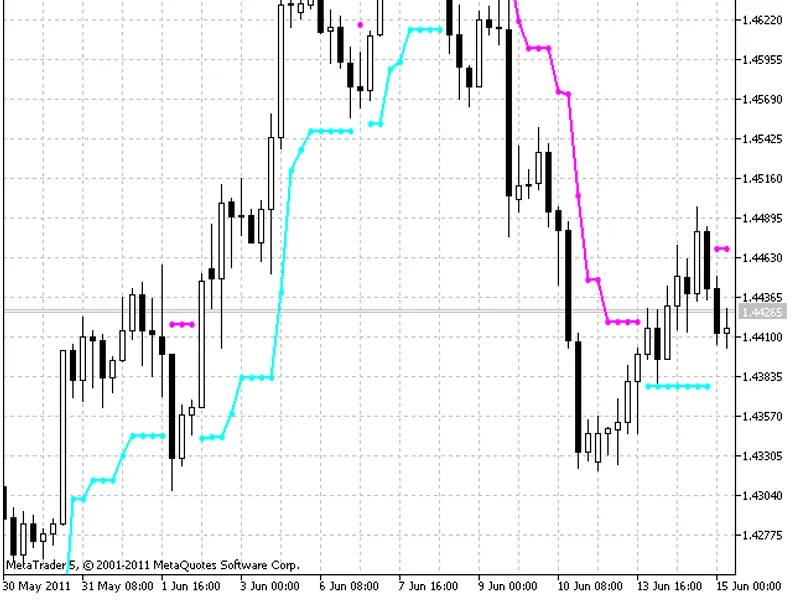
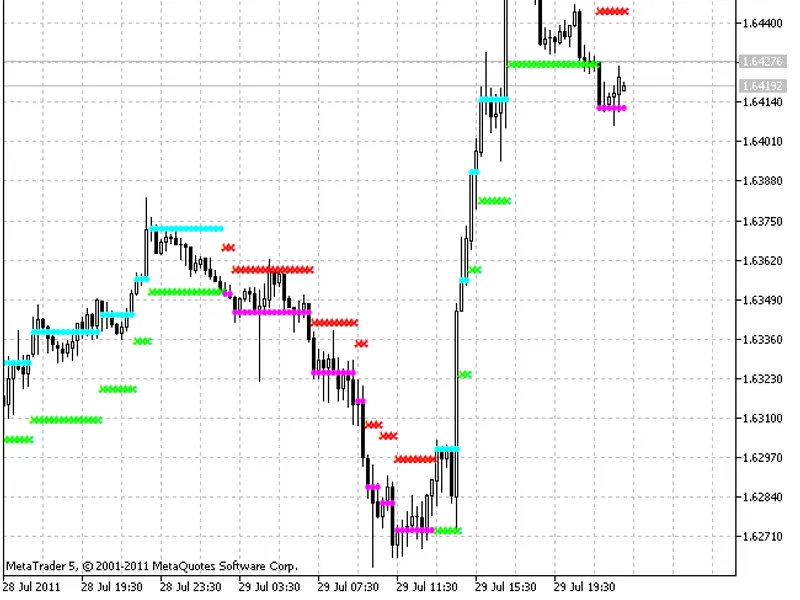
BrainTrend1Stop is a trend reversal indicator. The intersection of the stops line by a price indicates a trend reversal and the time to close previously opened positions.The cyan l...
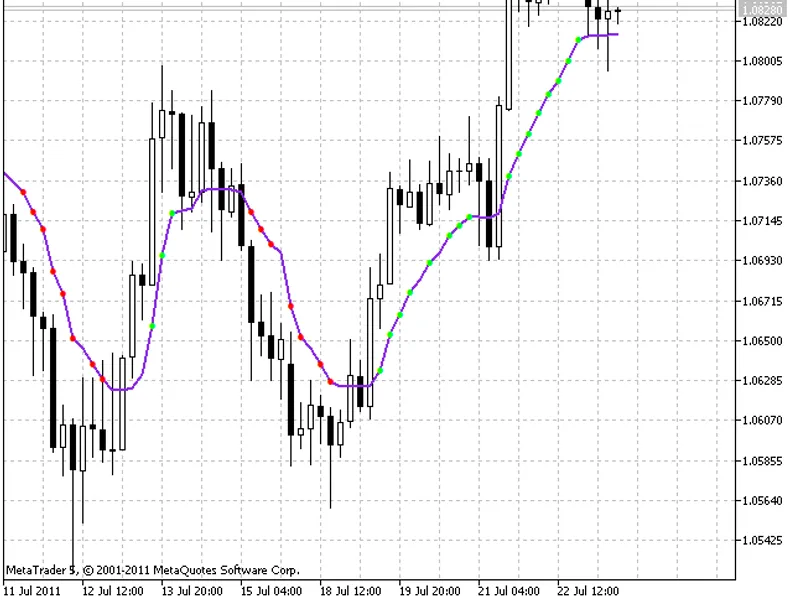
Perry Kaufman's Adaptive Indicator with signal points based on standard mean-square deviation.Signal points interpretation:If the market is flat, the AMA indicator is horizontal wi...
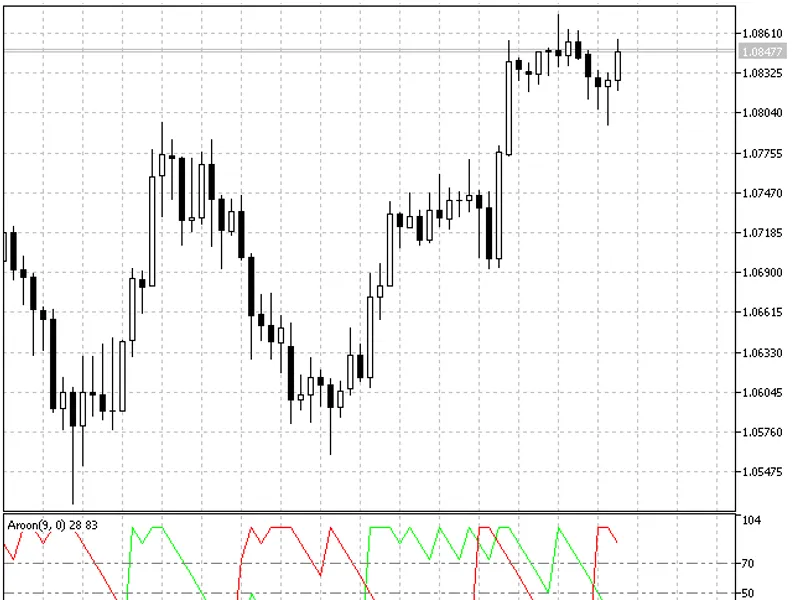
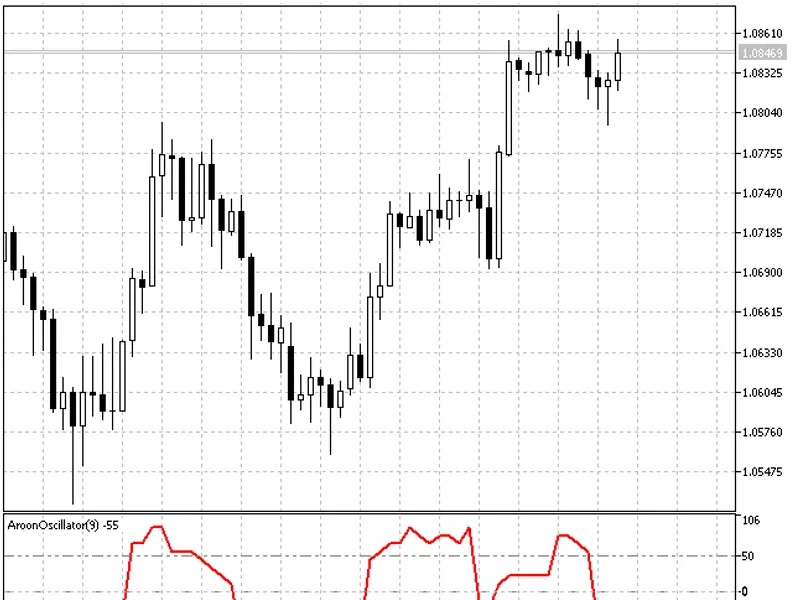
The Aroon indicator is a technical analysis tool used to determine the beginning of a new trend or the end of an existing trend.Key Features- The Aroon indicator can be calculated ...
The Aroon Oscillator predicts price changes from trend to flat market conditions.Aroon OscillatorThe Aroon Oscillator calculation includes three main signals.Reaching critical valu...
A blue candle is a signal to open a long position, a red candle is a signal to open a short position. The signals are formed on the completed bars (candles).The following input par...
A lime candle from the indicator signals a long position, while a magenta candle signals a short position. These signals are generated on completed bars.Input parameters used durin...
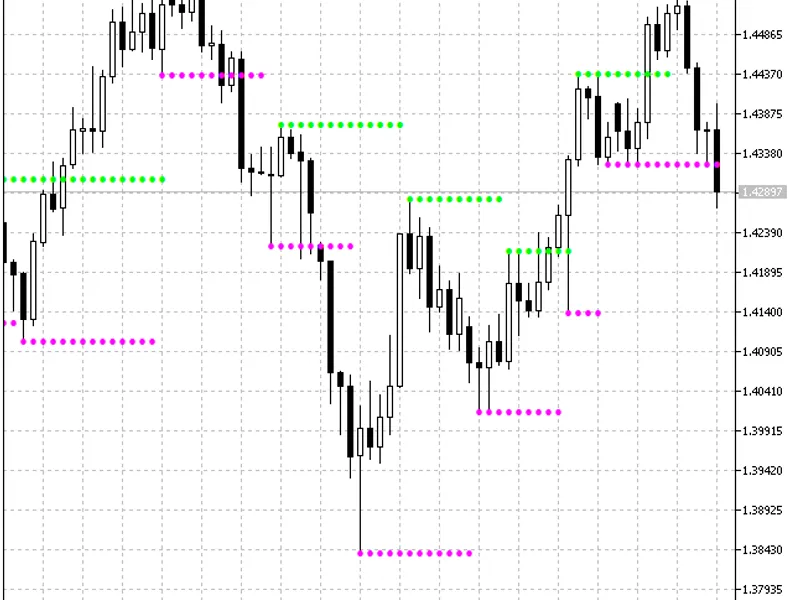
The Support and Resistance indicator shows the support and resistance levels using the indicator.
The calculation of support levels is based on the fractals down, the calculation o...
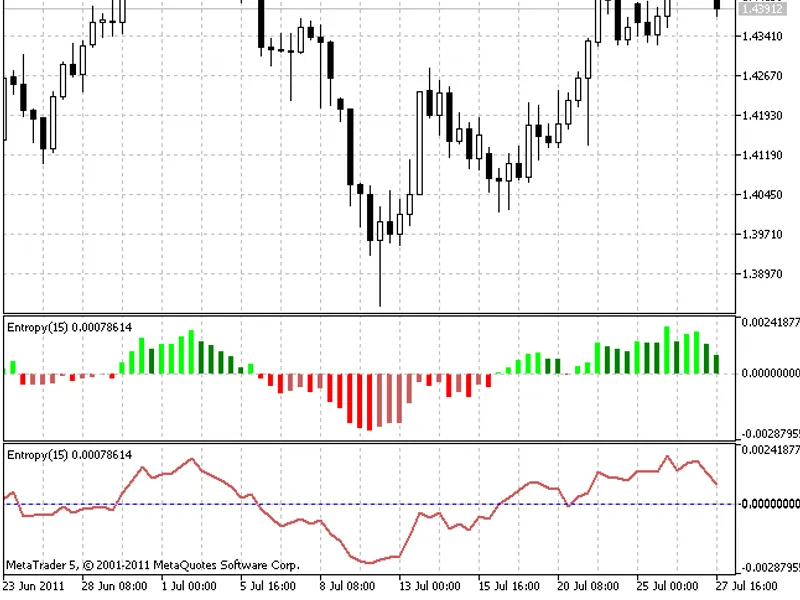
The entropy is the measure of the disorder of the system. It is calculated using the formula.Indicator OverviewThe entropy indicator can be evaluated according to its indicative at...
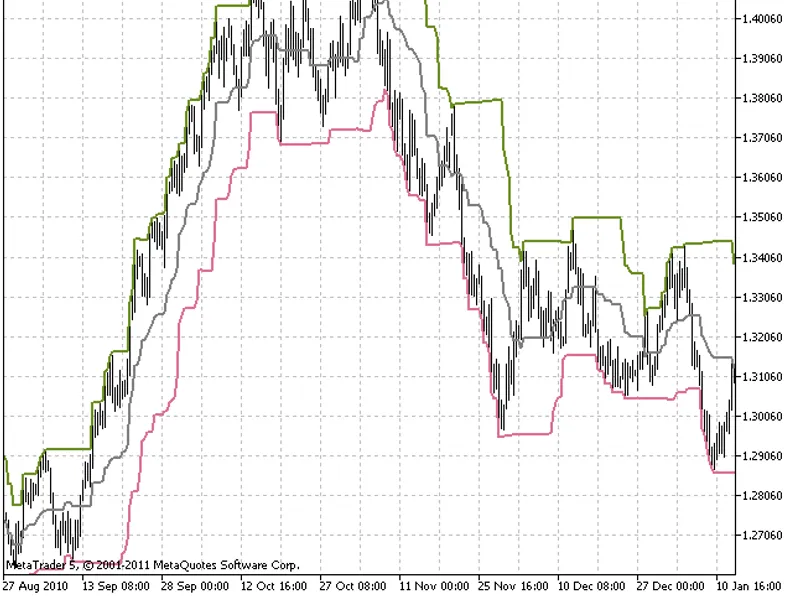
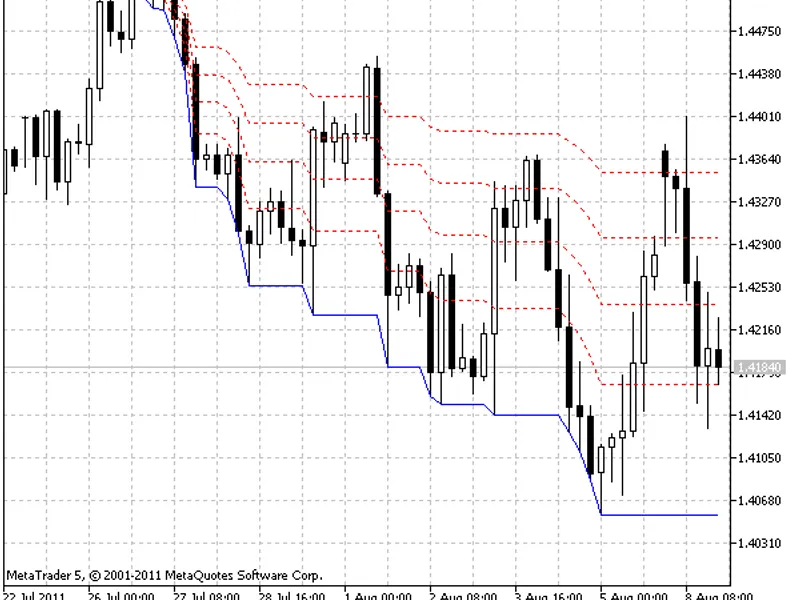
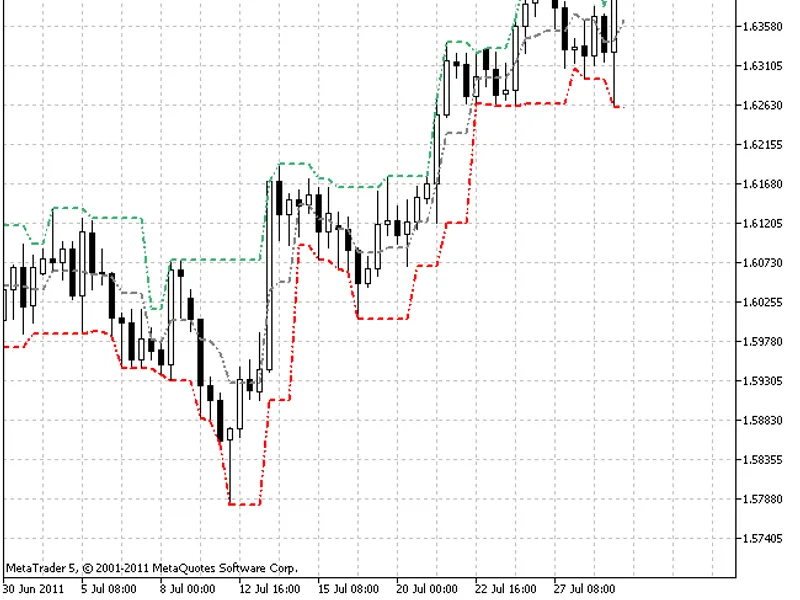
Donchian Channels is a volatility indicator that calculates the current price range using the highest highs and lowest lows over a defined period.To calculate the channel, the indi...
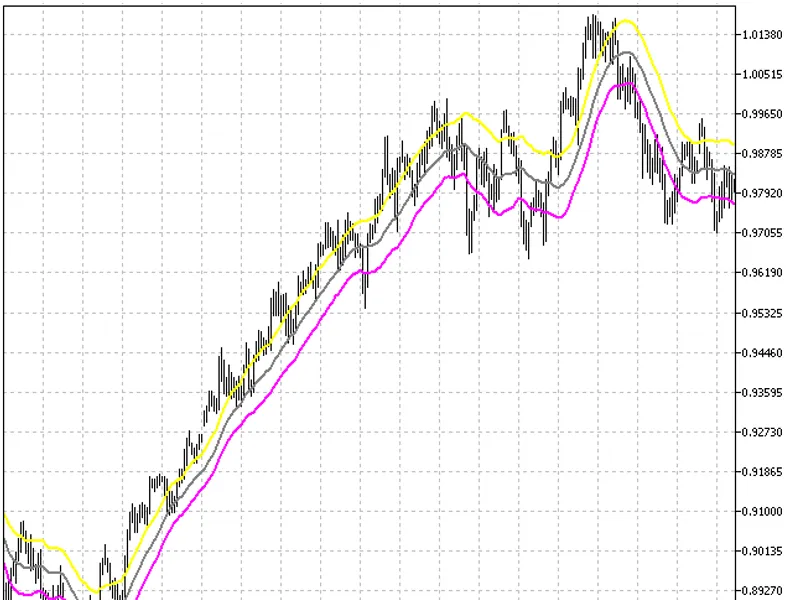
Keltner Channel is a volatility-based envelope set above and below a price chart.
The indicator consists of price envelopes or bands that are located above and below the exponentia...
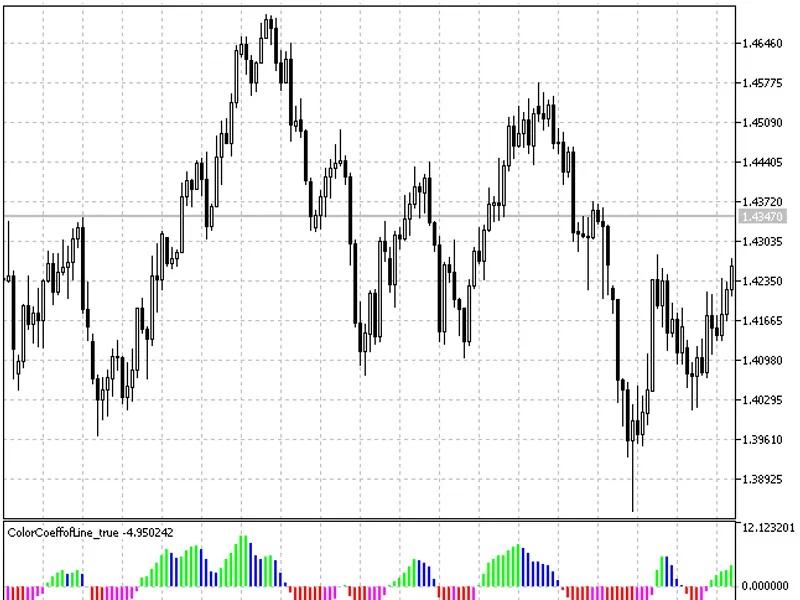
The Coefficient of Line Indicator predicts the most likely future price direction for the next 2-3 bars.The indicator's behavior is influenced by the symbol, timeframe, and period....
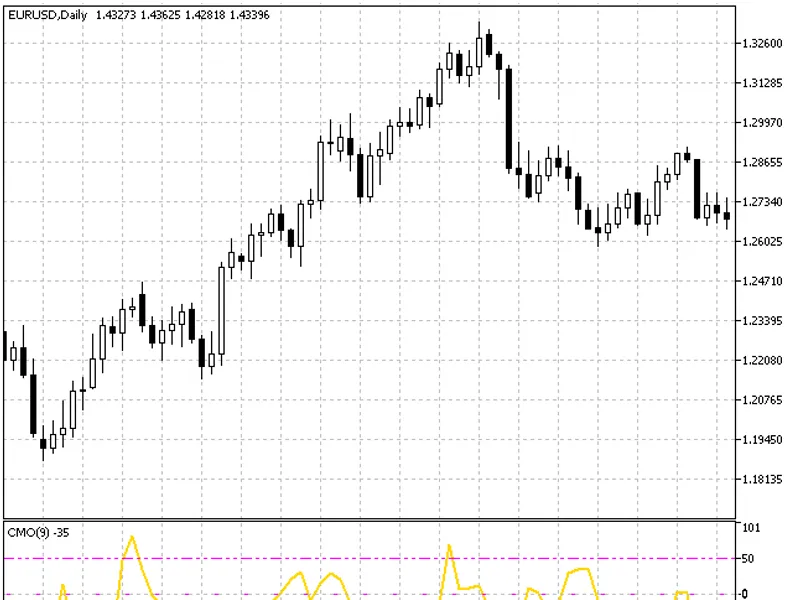
The Chande Momentum Oscillator (CMO) is a technical indicator that attempts to capture the momentum. It was developed and is used to gauge the momentum of a market. The range of CM...
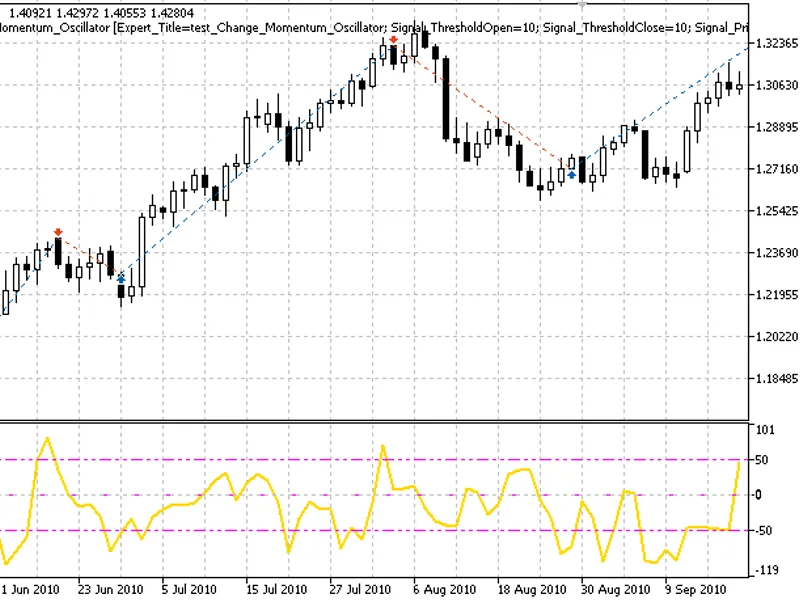
Trade signals are generated on completed bars. This indicator is used as a custom indicator for the trade signal module.A long position can be opened when the Chande Momentum Oscil...
Fast Trend Line Momentum (FTLM) and Slow Trend Line Momentum (STLM) indicators show the rate of price change. FATL and SATL are calculated in a similar way to the indicator. The ma...
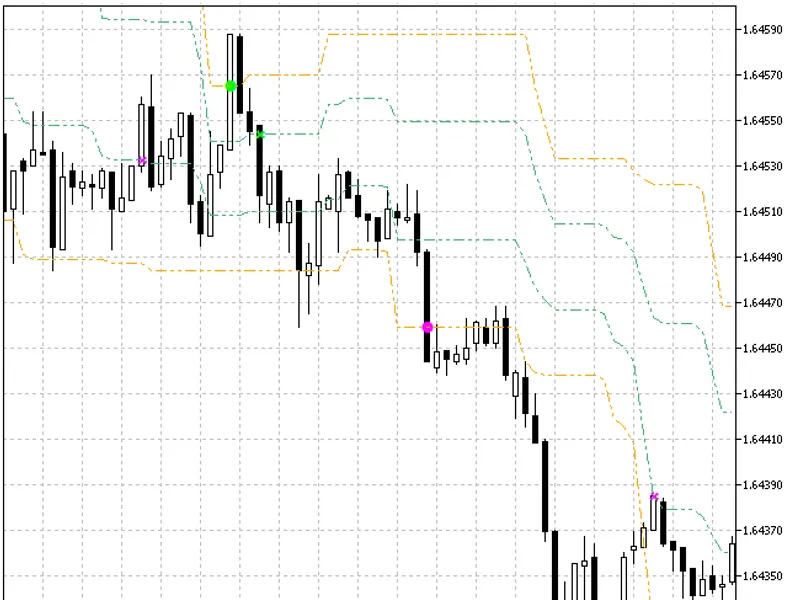
Arrows & Curves IndicatorThe Arrows & Curves Indicator displays the upper and lower boundaries of the price range.A dot signifies a signal to open a long or short position.A cross ...
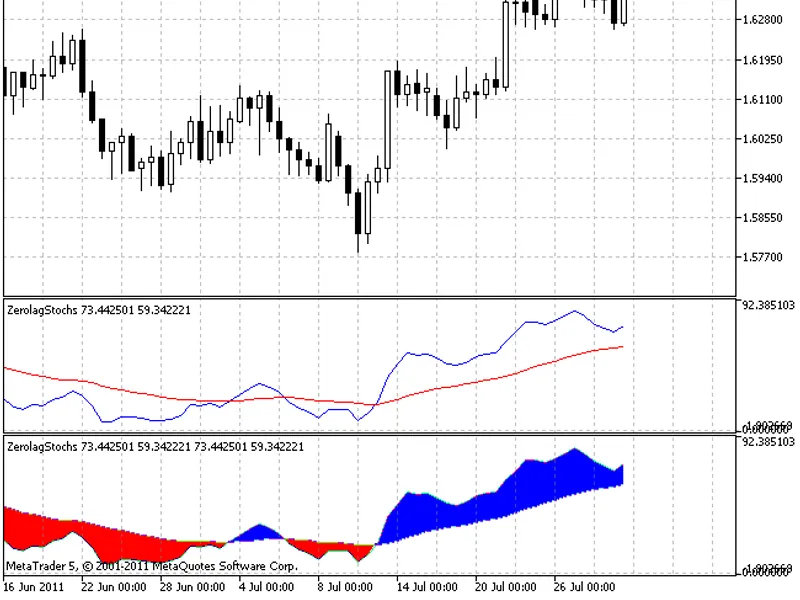
Zero Lag Stochastic Oscillator
This stochastic oscillator is based on four components. All indicator options are configured as external parameters. Note that some variables are no...
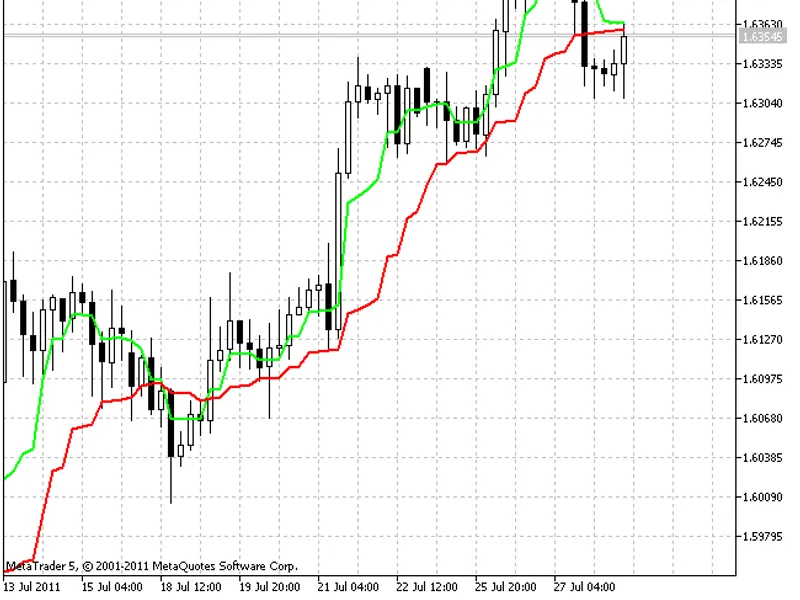
The indicator is a moving average based on an algorithm adapted to the current volatility of a financial instrument.The indicator consists of two averages: a fast MAMA (green line)...
The T3 indicator was first proposed in 1998.The primary objective behind developing this moving average was to enhance the noise filter and reduce the lag inherent in most existing...
Trade signals are generated upon completion of bars.
This module utilizes the T3 indicator as a custom indicator for generating trade signals.
A downward crossover of the moving av...
Fibonacci Retracement IndicatorThis indicator plots Fibonacci retracement levels on the chart based on a user-defined number of bars, eliminating the need for manual drawing.The us...
This trend indicator displays the current trend direction and identifies optimal moments for closing open positions.The indicator is available in three variations:- As a simple lin...
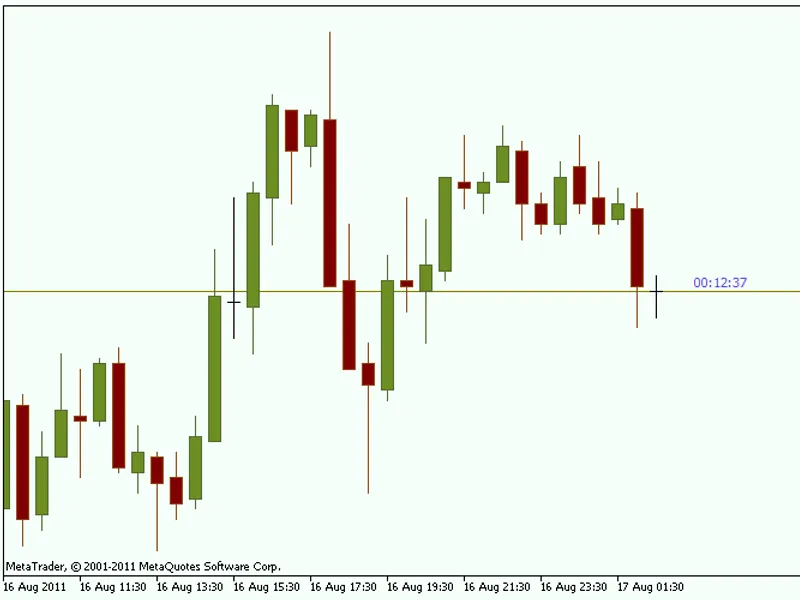
A non-invasive timer displaying the time remaining until the next candle forms. This timer can be positioned next to the price or in a corner of the chart.Features:- Customizable l...
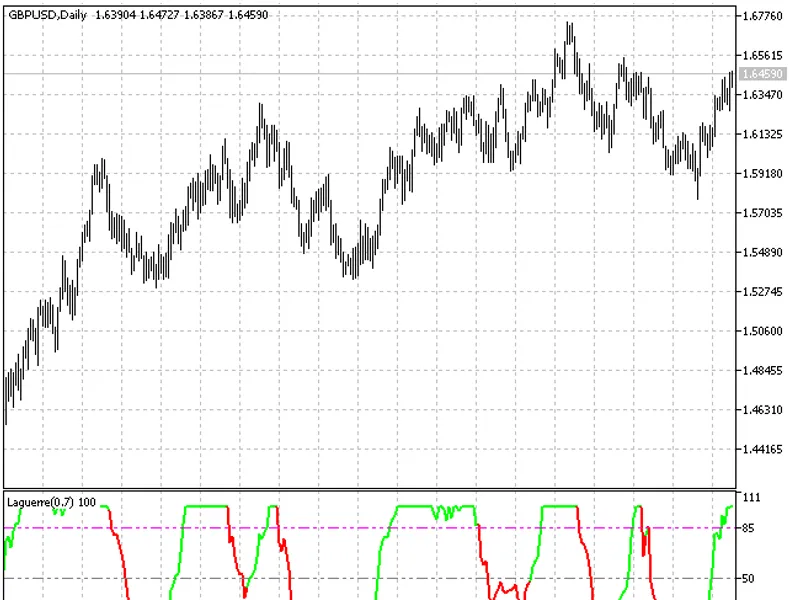
The Laguerre indicator is an algorithm based on the Laguerre adaptive filter.
It shows the overbought/oversold states of the market.
It is recommended to buy when a price goes beyo...
The Karacatica indicator generates market entry signals displayed as colored arrows on the chart. The signals are based on specific analytical principles.This indicator was initial...
Center of Gravity is an indicator that allows for the precise definition of turning points with zero lag. This indicator is the result of J. F. Ehlers study of adaptive filters.Int...
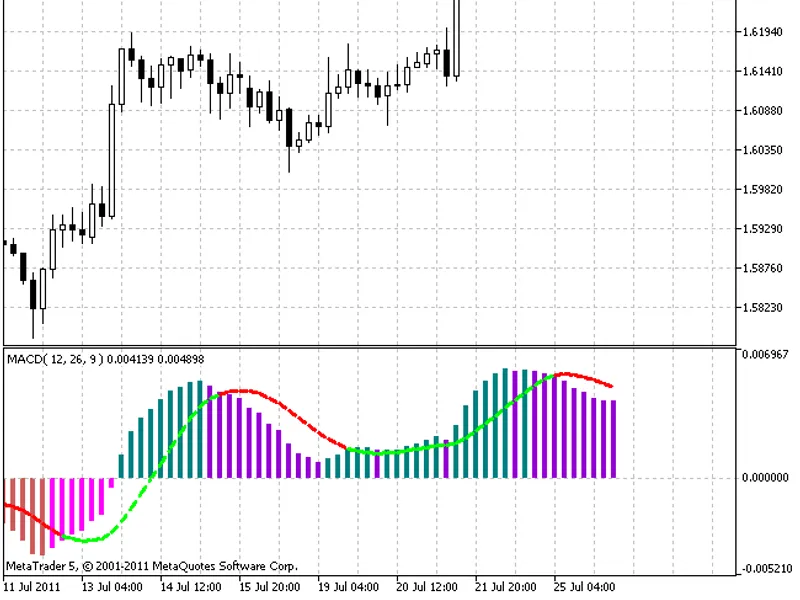
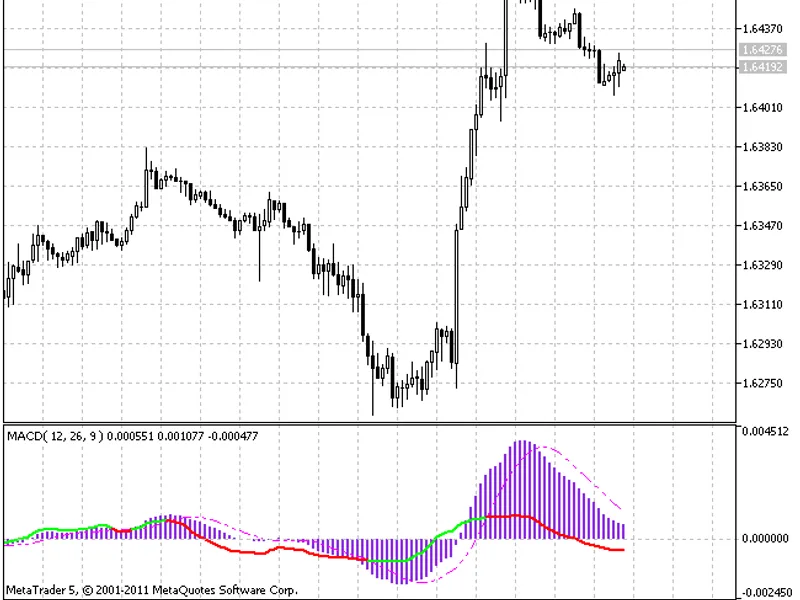
The Color MACD indicator features a colored histogram and a signal line that changes color based on the current trend direction, either red or green. The indicator allows users to ...
This indicator marks its values depending on the current trend.In case of a downward trend, the indicator is colored red and magenta. In case of an upward trend, it is colored lime...
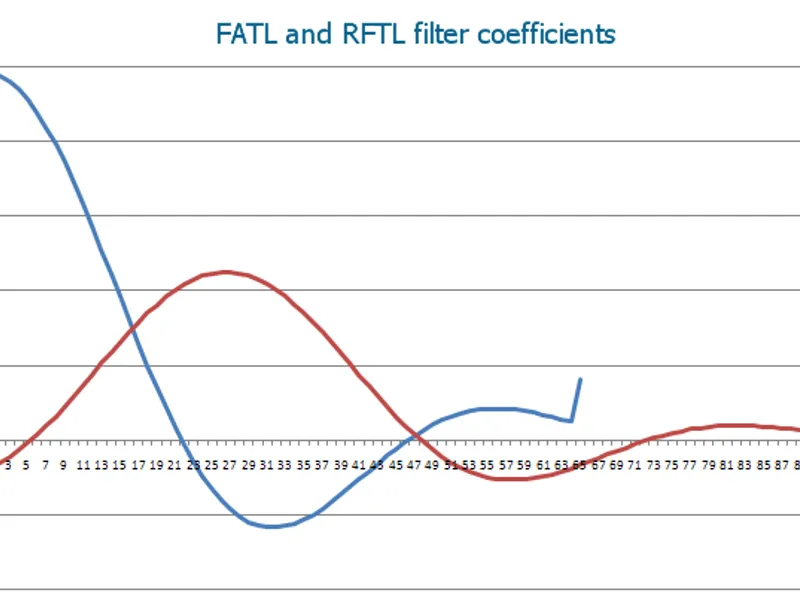
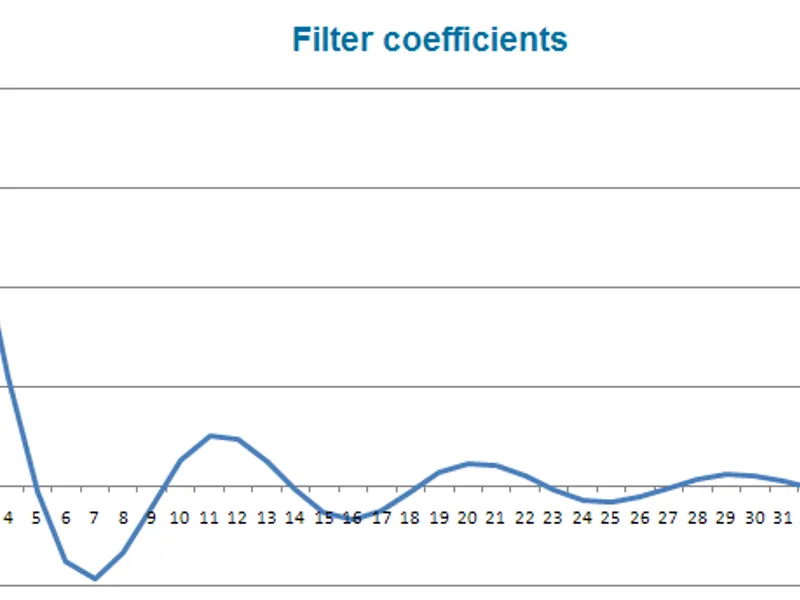
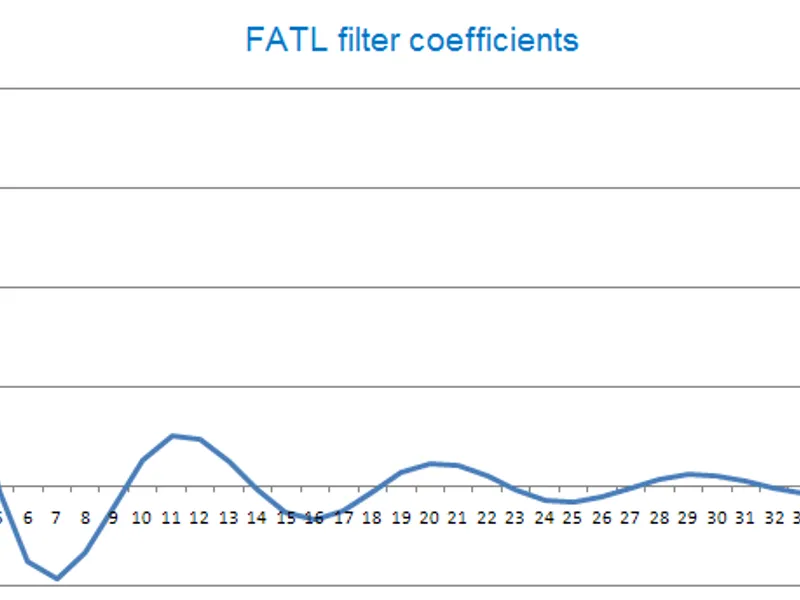
FATL (Fast Adaptive Trend Line) is calculated using a low-frequency digital filter (FLF-1).The FLF-1 filter is used for high-frequency noise suppression and reduction of market cyc...
The indicator displays a channel based on fractals.
This represents an interesting method for channel creation.
Despite its simplicity, it can be useful for analyzing flat market c...
Universal Digital Filter for MetaTrader 5
This indicator provides a unified solution for creating digital filters within the MetaTrader 5 client terminal. Using this MQL5 filter e...
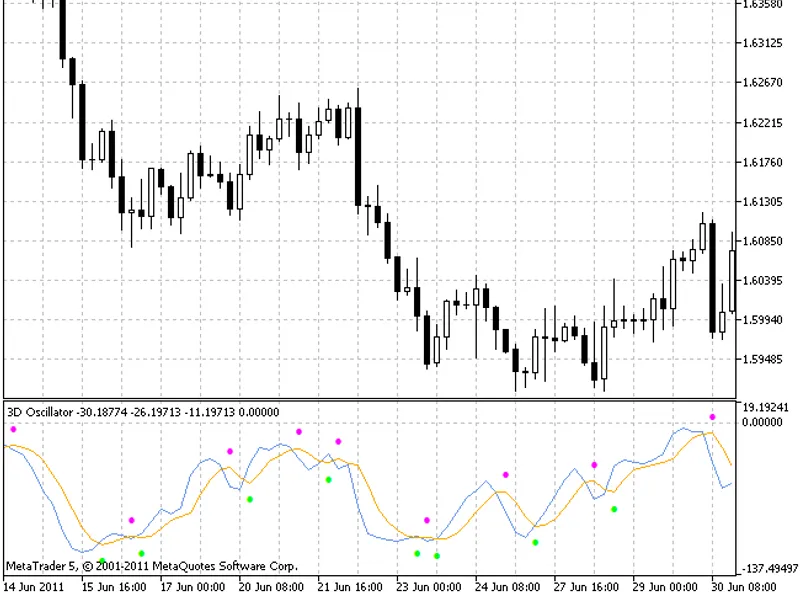
This oscillator generates market entry and exit signals in the form of colored dots, based on and indicators.The signals from this indicator are not sufficient on their own for ope...
PCCI (Perfect Commodity Channel Index) IndicatorThe PCCI indicator is calculated using the following formula:where:close(bar) - represents the closing prices of bars.fatl(bar) - re...
This indicator clearly displays current price divergence using MACD and RSI.Short period reversals (1, 5, 15 minutes) are also clearly visible.A crossover of the MACD signal line a...
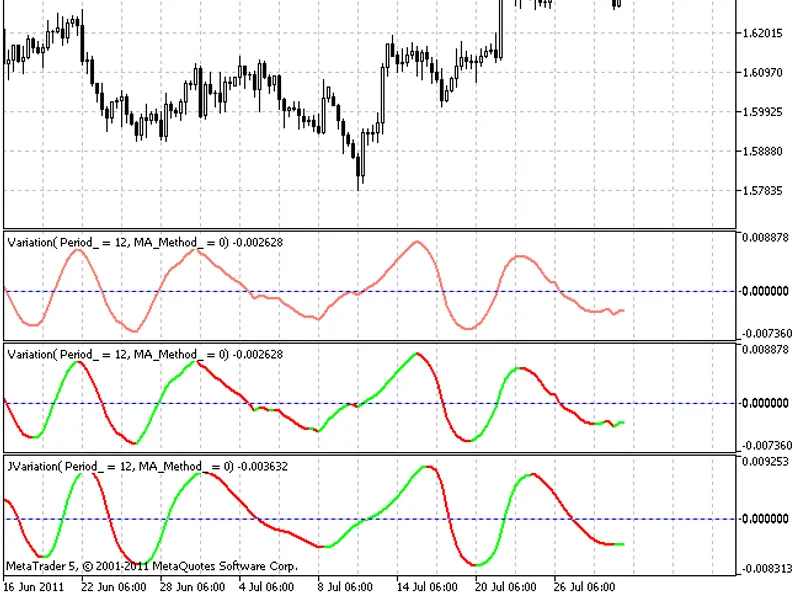
In contrast with the standard, the JMA smoothing is used in all three averagings. It can be very useful, especially when working with highly volatile currency crosses. The indicato...
Parabolic Moving Average IndicatorThis indicator utilizes a parabolic approximation of price for smoothing.It employs a remarkable algorithm for parabolic price approximation.The i...
This elegant fan, based on the five T3 moving averages, strongly resembles and is used for market analysis in a similar way. The indicator uses the CT3 class from the SmoothAlgorit...
Reference Fast Trend Line (RFTL) is a response of FLF-1 and FLF-2 digital filters to the input discrete sequence. This response is set with the delay equal to the Nyquist TNI range...
This indicator features an ultralinear smoothing method, differing from conventional smoothing techniques.It utilizes the CJURX class from the SmoothAlgorithms.mqh library.The gene...
This indicator is calculated using linearly weighted smoothing and simple smoothing methods.
It uses the price series value and the current bar index to determine market trends.
T...