


CRT Indicator (STF): Visualizing Picture-Perfect Setups
Info
The CRT Indicator (STF): Visualizing Picture-Perfect Setups is a Indicator for MetaTrader 5 that crt indicator (stf) - unlocking the power of candle range theorythis indicator is a groundbreaking tool designed to test and visualize the renowned 'picture-perfect' candle range theory (crt) setups directly on live charts. With a focus on simplicity and efficiency, this indicator is crafted using less than 100 lines of MQL5 code, ensuring structural purity and logical clarity.
Usage
This tool is typically used for enhancing chart analysis and decision making.
Platform
This Indicator works exclusively on MetaTrader 5 (both build 600+ and newer versions).
Setup
Place the downloaded file in MQL5/Indicators folder via File ? Open Data Folder in MetaTrader 5.
How to Install and Use CRT Indicator (STF): Visualizing Picture-Perfect Setups
1. Installation: Place your file in the MQL/Indicators folder via "Open Data Folder" and restart your terminal.
2. Loading: Find the indicator in the Navigator, drag it onto your chart, and configure the input parameters in the popup window.
3. Customization: Press Ctrl+I to open the indicator list, select your tool, and click "Properties" to change colors, levels, or visual styles.
4. Updating: Replace the old file in the Indicators folder with the new version and restart the platform to apply changes.
Frequently Asked Questions
Q: Why is my indicator not showing? A: Verify the file is in the MQL/Indicators folder, or try right-clicking the "Indicators" tree in the Navigator and clicking "Refresh."
Q: Do custom indicators slow down the platform? A: Too many complex indicators can impact performance; remove unused ones via the "Indicator List" (Ctrl+I).
Q: Can I use MT4 indicators on MT5? A: No, MQL4 and MQL5 are distinct languages; ensure the indicator is compiled specifically for your platform version.
What this tool does
CRT Indicator (STF) - Unlocking the Power of Candle Range TheoryThis indicator is a groundbreaking tool designed to test and visualize the renowned 'picture-perfect' Candle Range Theory (CRT) setups directly on live charts.
Typical Use Case
This Indicator excels in automated trading and technical analysis on MetaTrader 5.
Compatible Platform & Setup
This Indicator works on MetaTrader 5. Place the file in the MQL5/Indicators folder and restart the terminal.
Description & Settings
Related: Price Channel Indicator - another powerful indicator for MetaTrader 5 traders.
CRT Indicator (STF) - Unlocking the Power of Candle Range TheoryThis indicator is a groundbreaking tool designed to test and visualize the renowned 'picture-perfect' Candle Range Theory (CRT) setups directly on live charts.
Also recommended: Multi-Timeframe Moving Average Indicator (v03) - similar indicator with strong performance on MetaTrader 5.
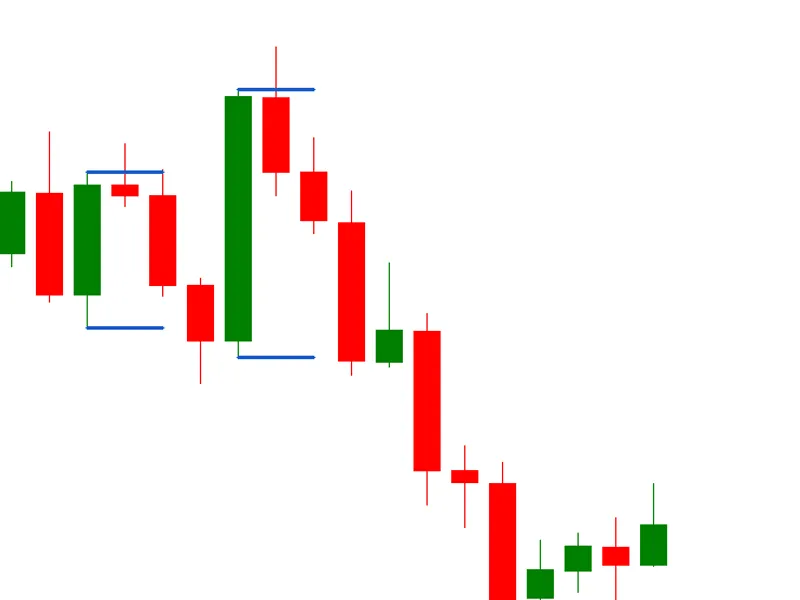
With a focus on simplicity and efficiency, this indicator is crafted using less than 100 lines of MQL5 code, ensuring structural purity and logical clarity. The algorithm employs a rigorous approach, detecting specific three-candle structural conditions, including directional shift, range expansion, midpoint positioning, and structure violation. It then projects the originating candle range using clean trendlines, providing a clear and uncluttered visual representation.
The core objective is to evaluate the performance of a 'textbook' single-timeframe CRT model across various symbols and timeframes. By stripping away complexity and focusing on raw candle geometry and structural conditions, this indicator empowers traders to observe CRT behavior in different markets without subjective bias. It operates without repainting logic or multi-timeframe dependencies, ensuring pure structural detection in real-time.
The visual outcome on specific symbols and timeframes is both surprising and insightful, prompting deeper exploration of CRT's potential. This indicator serves as a precision instrument for serious CRT enthusiasts, offering a new perspective on market structure and trading opportunities.
You may also like: Multi-Timeframe Relative Strength Index (MTF RSI) Indicator for MT4/MT5 - excellent alternative for indicator users on MetaTrader 5.
⚠ Limitations & Risk Warning
- This tool is provided for educational and testing purposes only.
- Past performance does not guarantee future results.
- Trading involves substantial risk of loss. Use on a demo account first.
- Results may vary depending on market conditions, broker, and settings.
- We recommend thorough backtesting and forward testing before using with real funds.