











Previous Day High, Low, and Close Indicator
Info
The Previous Day High, Low, and Close Indicator is a Indicator for MetaTrader 5 that previous day high, low & closeconceptyesterday's high, low, and close prices are crucial reference points for intraday traders. They represent resistance, support, and fair value from the previous trading session, often influencing price action on subsequent days.
Usage
This tool is typically used for enhancing chart analysis and decision making.
Platform
This Indicator works exclusively on MetaTrader 5 (both build 600+ and newer versions).
Setup
Place the downloaded file in MQL5/Indicators folder via File ? Open Data Folder in MetaTrader 5.
How to Install and Use Previous Day High, Low, and Close Indicator
1. Installation: Place your file in the MQL/Indicators folder via "Open Data Folder" and restart your terminal.
2. Loading: Find the indicator in the Navigator, drag it onto your chart, and configure the input parameters in the popup window.
3. Customization: Press Ctrl+I to open the indicator list, select your tool, and click "Properties" to change colors, levels, or visual styles.
4. Updating: Replace the old file in the Indicators folder with the new version and restart the platform to apply changes.
Frequently Asked Questions
Q: Why is my indicator not showing? A: Verify the file is in the MQL/Indicators folder, or try right-clicking the "Indicators" tree in the Navigator and clicking "Refresh."
Q: Do custom indicators slow down the platform? A: Too many complex indicators can impact performance; remove unused ones via the "Indicator List" (Ctrl+I).
Q: Can I use MT4 indicators on MT5? A: No, MQL4 and MQL5 are distinct languages; ensure the indicator is compiled specifically for your platform version.
What this tool does
Previous Day High, Low & CloseConceptYesterday's high, low, and close prices are crucial reference points for intraday traders.
Typical Use Case
This Indicator excels in automated trading and technical analysis on MetaTrader 5.
Compatible Platform & Setup
This Indicator works on MetaTrader 5. Place the file in the MQL5/Indicators folder and restart the terminal.
Description & Settings
Related: previous day high low indicator - another powerful indicator for MetaTrader 5 traders.
Previous Day High, Low & CloseConcept
Yesterday's high, low, and close prices are crucial reference points for intraday traders. They represent resistance, support, and fair value from the previous trading session, often influencing price action on subsequent days. This indicator extracts these three values from the completed Daily (D1) bar and displays them as horizontal levels on the current trading session. This provides constant visibility of the prior day's price structure without manual calculation or timeframe switching.
Also recommended: Previous Day and Floating Pivot HTF Indicator - similar indicator with strong performance on MetaTrader 5.
The indicator functions on any financial symbol and any intraday timeframe. The levels are derived from Daily (D1) data, irrespective of the chart's current timeframe. An optional setting allows displaying levels for multiple previous days. Each day's High, Low, and Close levels are drawn only for the specific session they were active, which is useful for identifying consistently respected or broken price levels over several days.
Interpretation
PDH (Previous Day High)
- The highest price achieved during the preceding completed trading day. This level frequently acts as intraday resistance or a breakout signal when surpassed.
PDL (Previous Day Low)
- The lowest price achieved during the preceding completed trading day. This level commonly serves as intraday support or a breakdown signal when breached.
PDC (Previous Day Close)
- The closing price of the prior trading day. This is often used as a fair-value pivot. Prices trading above the PDC within a session suggest a bullish sentiment, while prices below indicate a bearish sentiment.
Multi-day Stacking
- When the 'InpDaysToShow' input is set to a value greater than 1, levels from older days are displayed only within their respective active sessions. A suffix, such as '-1' or '-2', is appended to the label (e.g., PDH-1, PDH-2) to clearly distinguish historical levels from current ones and prevent confusion.
Live Refresh
- The indicator automatically updates the levels the moment a new Daily bar opens. This ensures the indicator consistently reflects the most recently completed session without requiring manual removal and reattachment.
External Variables (Inputs)
Input
Default
Purpose
InpDaysToShow
1
Determines the number of previous trading days to display (range: 1-10). Each day's levels are confined to the session they represent.
InpShowHigh
true
Activates or deactivates the display of the Previous Day High line.
InpShowLow
true
Activates or deactivates the display of the Previous Day Low line.
InpShowClose
true
Activates or deactivates the display of the Previous Day Close line.
InpHighColor / InpLowColor / InpCloseColor
Lime / Red / Silver
Allows independent color selection for each of the three levels.
InpLineStyle / InpLineWidth
Dash / 1
Sets the line style and width for all three levels.
InpShowLabels
true
Enables the display of text labels (e.g., 'PDH') at the right edge of each level.
InpShowPriceInLabel
true
Appends the precise price value to each displayed label.
InpLabelFontSize
8
Sets the font size for the level labels.
Recommended Usage
This indicator is versatile and can be used on any symbol and intraday timeframe (commonly M1 to H4). The High, Low, and Close values are consistently sourced from the Daily timeframe, regardless of the chart's period. For symbols that trade 24/7 (such as major FX pairs or cryptocurrencies), the definition of a 'daily' session is determined by your broker's server time for bar opening and closing. It is advisable to verify this against your preferred session boundary (e.g., New York close versus broker midnight) before relying on the exact level.
All graphical objects generated by the indicator are managed under a single internal name prefix. They are completely removed using ObjectsDeleteAll() within the OnDeinit() function when the indicator is detached, ensuring no residual objects remain on the chart.
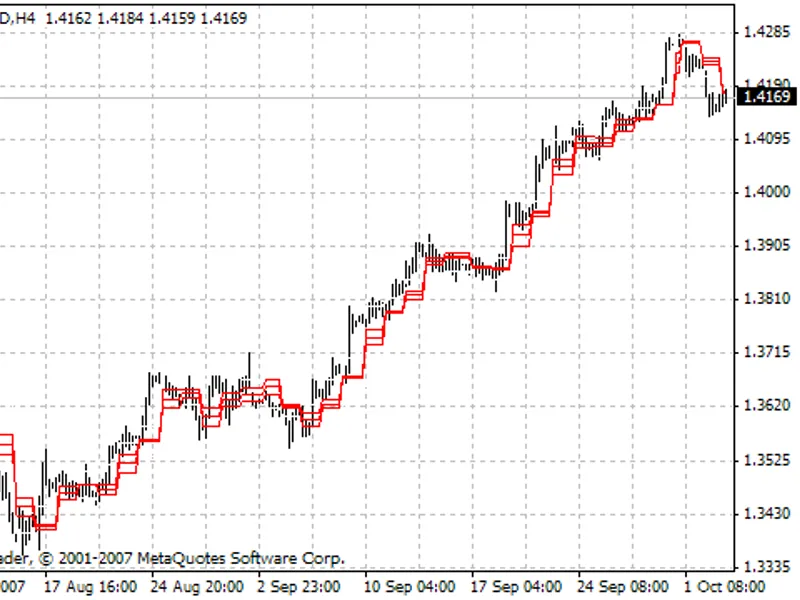
Figure 1. Previous day's High, Low, and Close plotted as horizontal levels on XAUUSD M15. Rendered according to standard guidelines.
You may also like: plot the previous candlestick oh l c of the selected period - excellent alternative for indicator users on MetaTrader 5.
Source Code
#property copyright "RobotFX"
#property link "https://robotfx.org"
#property version   "1.00"
#property description "This code is educational. Feel free to use, modify and upgrade as you wish. Visit ROBOTFX.ORG for professional trading tools"
#property indicator_chart_window
#property indicator_buffers 0
#property indicator_plots   0
#property strict
input group "=== Data Settings ==="
input int    InpDaysToShow      = 1;
.......
⚠ Limitations & Risk Warning
- This tool is provided for educational and testing purposes only.
- Past performance does not guarantee future results.
- Trading involves substantial risk of loss. Use on a demo account first.
- Results may vary depending on market conditions, broker, and settings.
- We recommend thorough backtesting and forward testing before using with real funds.