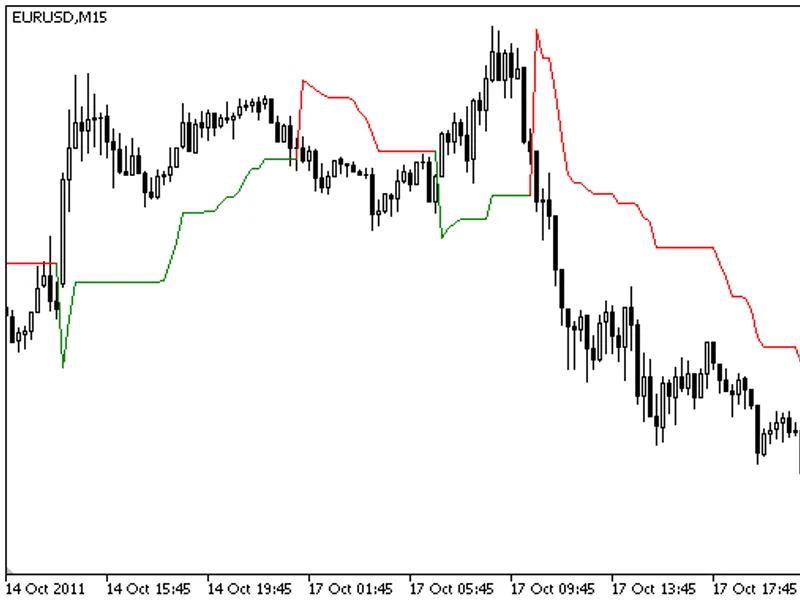
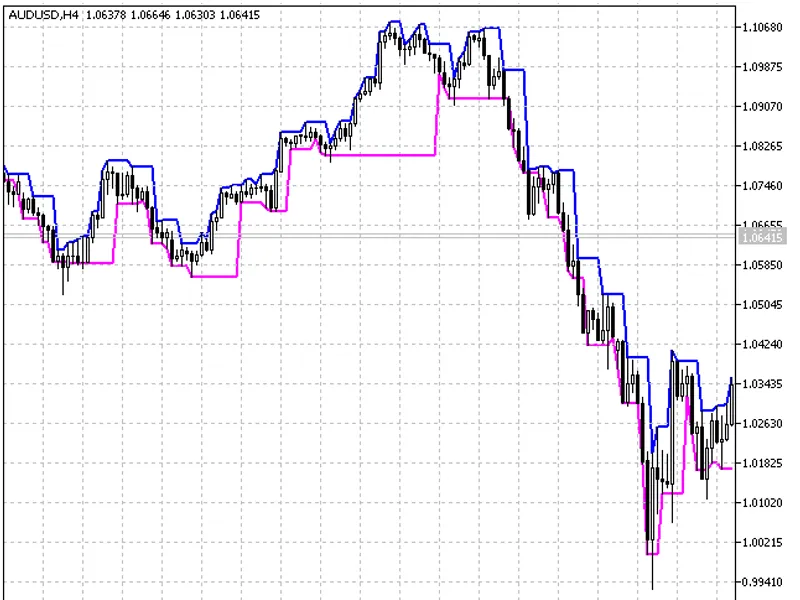
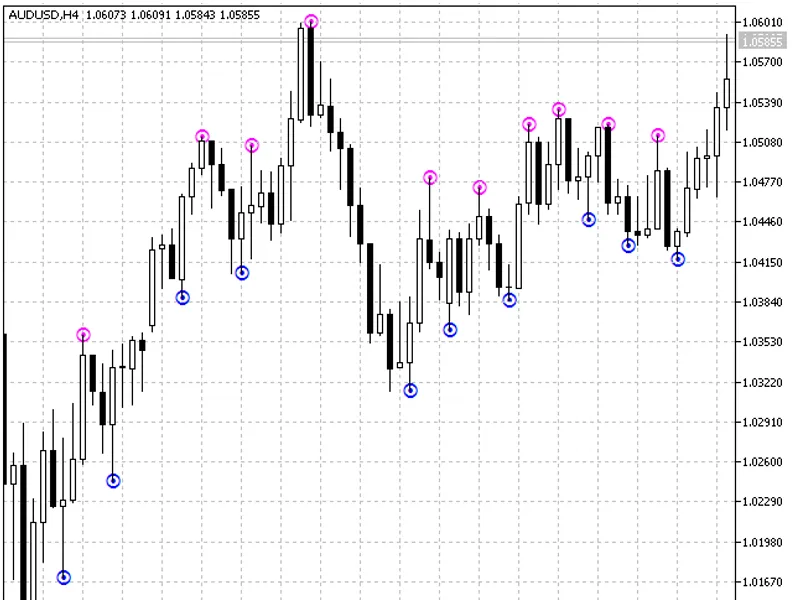
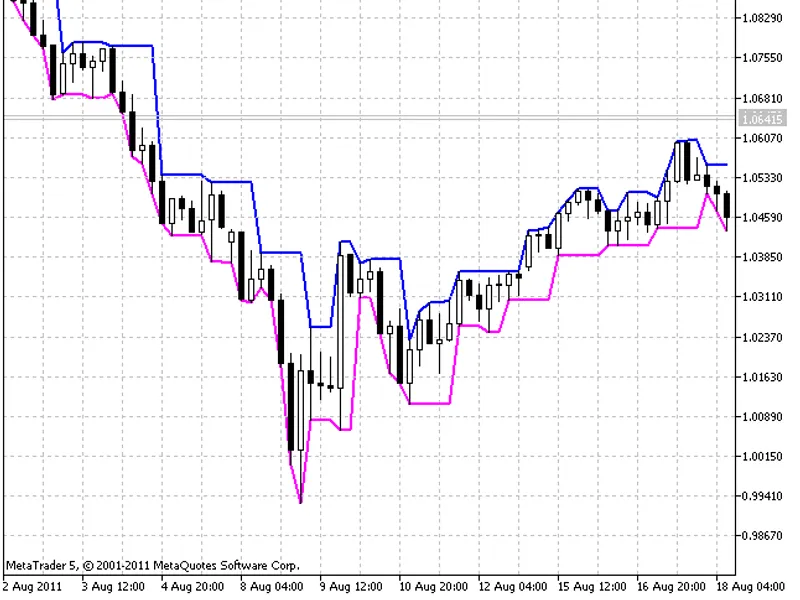
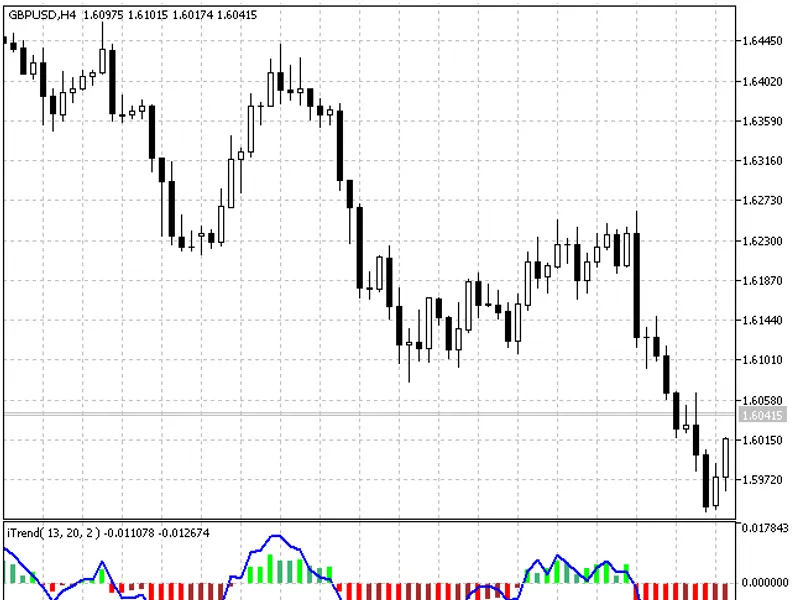
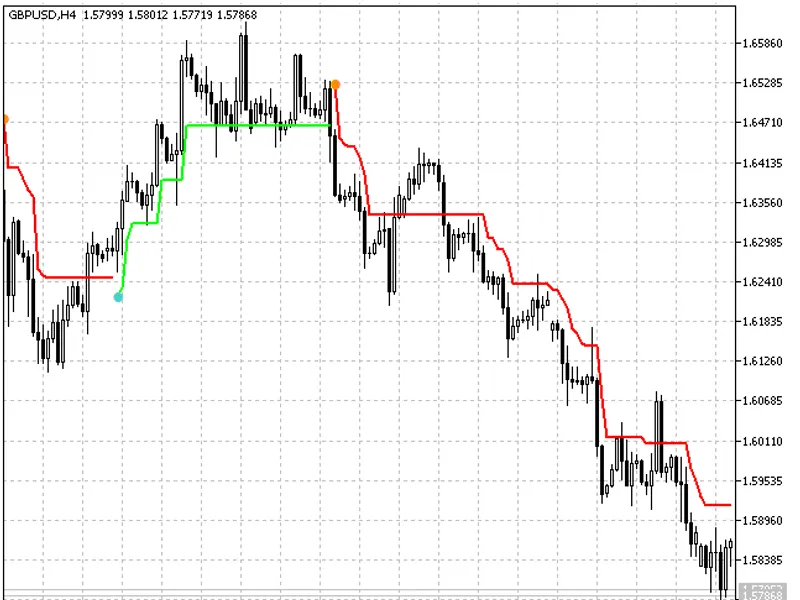
Supertrend indicator.Features:- Option to enable filling visualization using the "show_filling" input parameter.Settings:show_filling=false: Displays the standard Supertrend line.s...
Value Charts is a detrended price indicator.It illustrates overbought and oversold conditions by analyzing detrended price extremes.The indicator is detailed in financial literatur...
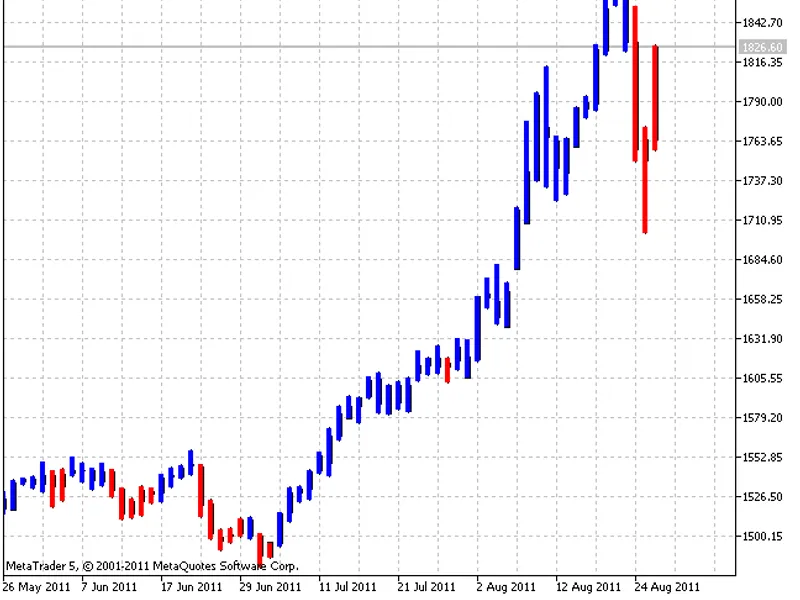
The 3 Line Break Forex Indicator is a user-friendly tool that simplifies trend identification.It visually represents the market trend by coloring the price bars:- Blue bars indicat...
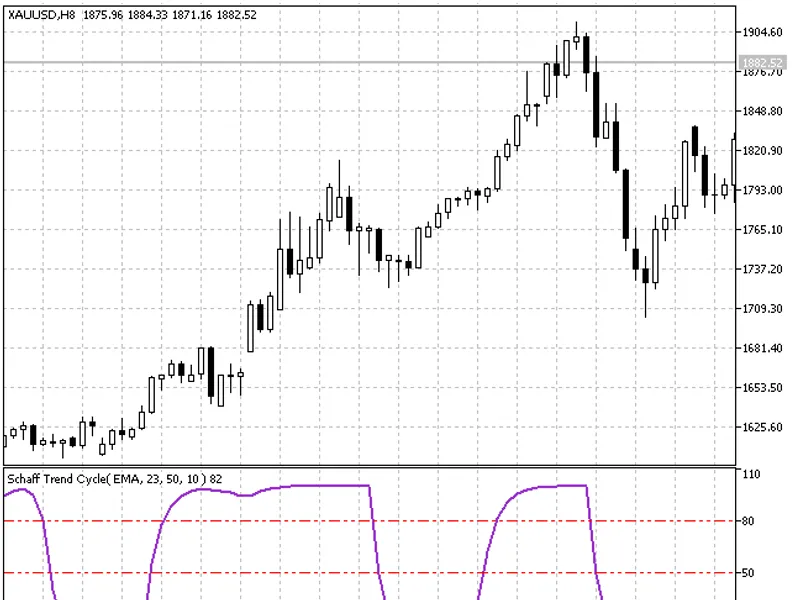
The Schaff Trend Cycle Indicator is a cyclical oscillator that provides stable and reliable trading signals by filtering out short-term market noise.It achieves this by calculating...
This indicator displays a simple clock in the comment section.It provides the following information:- Current time.- Time elapsed from bar open.- Time to bar close.The indicator do...
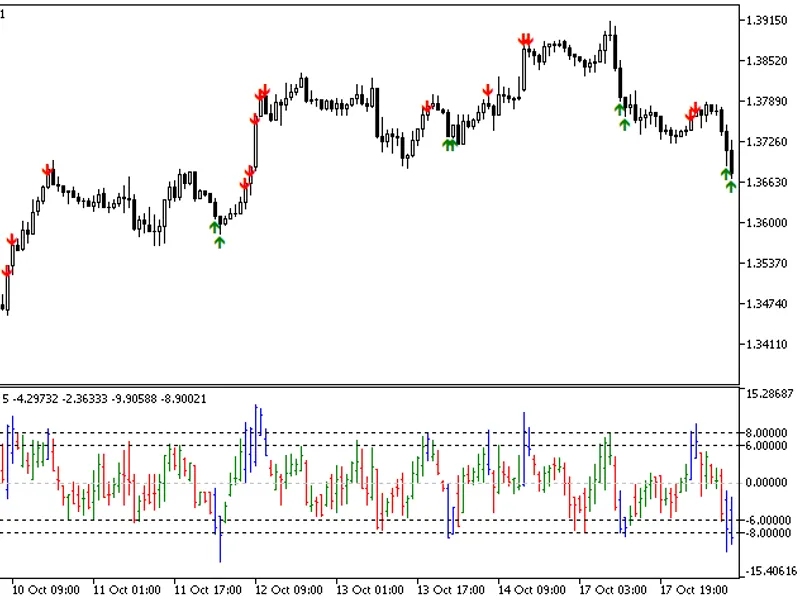
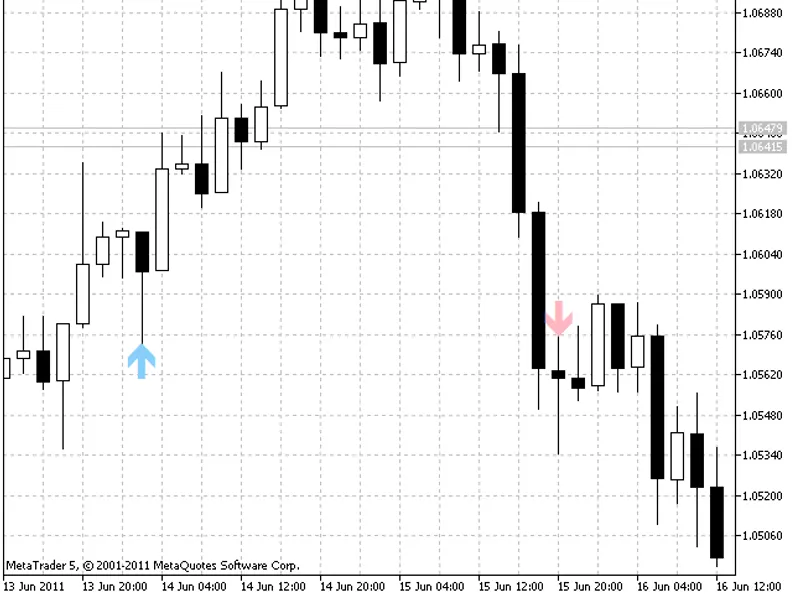
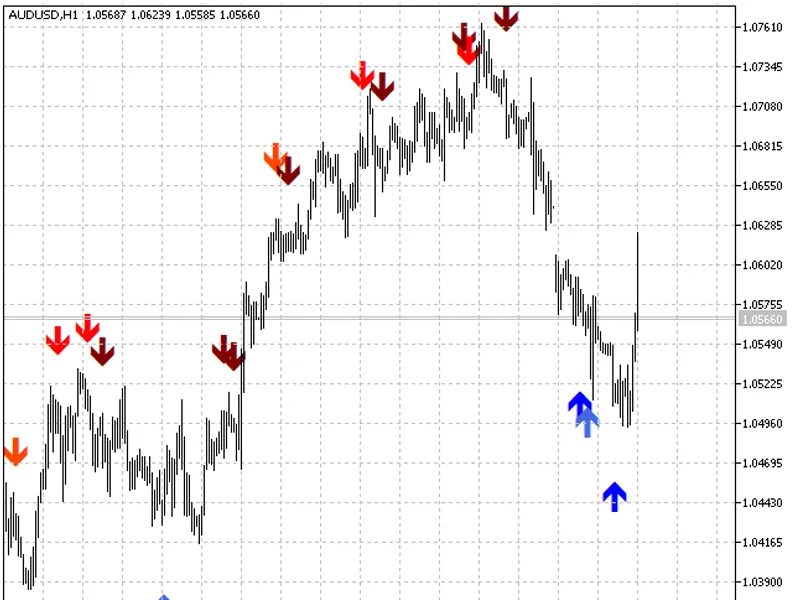
Stalin is a signal indicator that provides traders with accurate market entry points, marked by red and blue arrows for selling and buying, respectively.This indicator utilizes the...
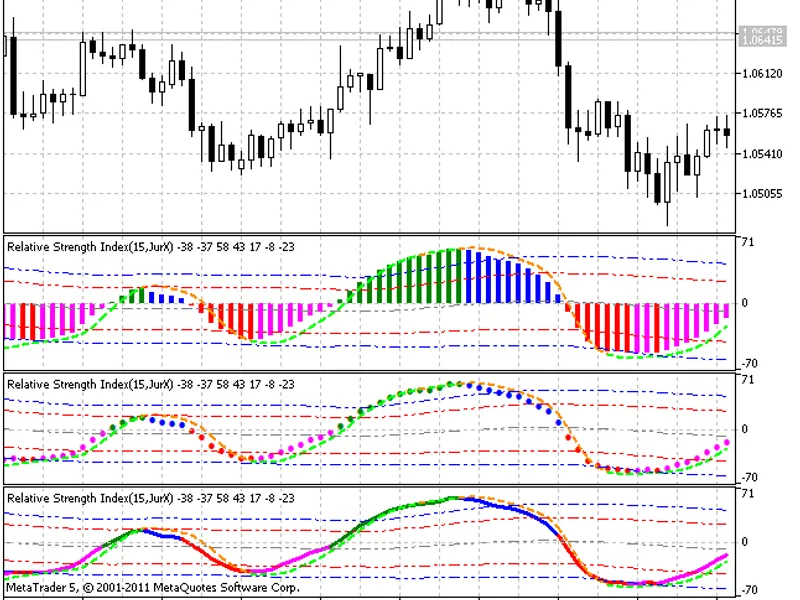
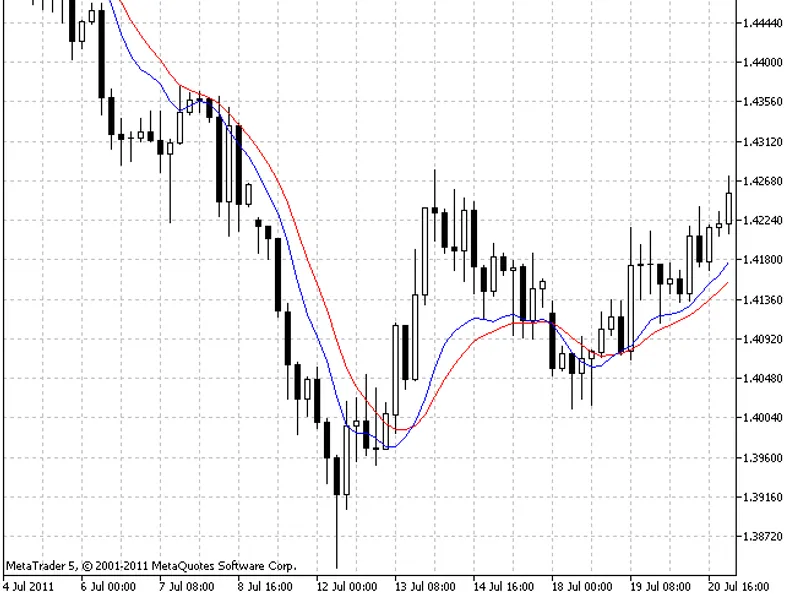
This indicator is a modified version of a standard indicator, featuring the ability to change the smoothing algorithm from ten available options.Available smoothing algorithms incl...
This indicator is a modified variant of the standard indicator.
It offers the possibility to change the smoothing algorithm by selecting one out of ten algorithms present:
- Simple...
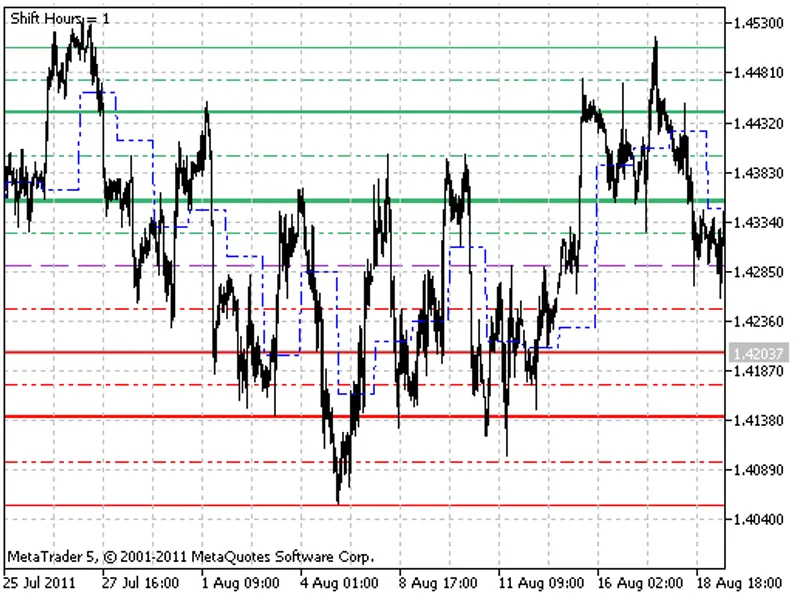
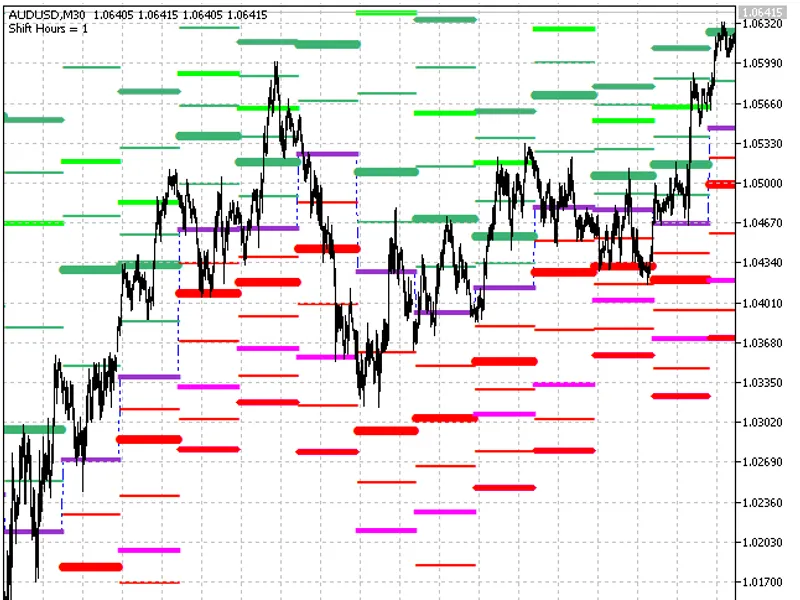
The Daily Pivot Shift indicator offers a distinct approach to calculating main pivot levels by incorporating a day start shift. This allows for the calculation of levels based on l...
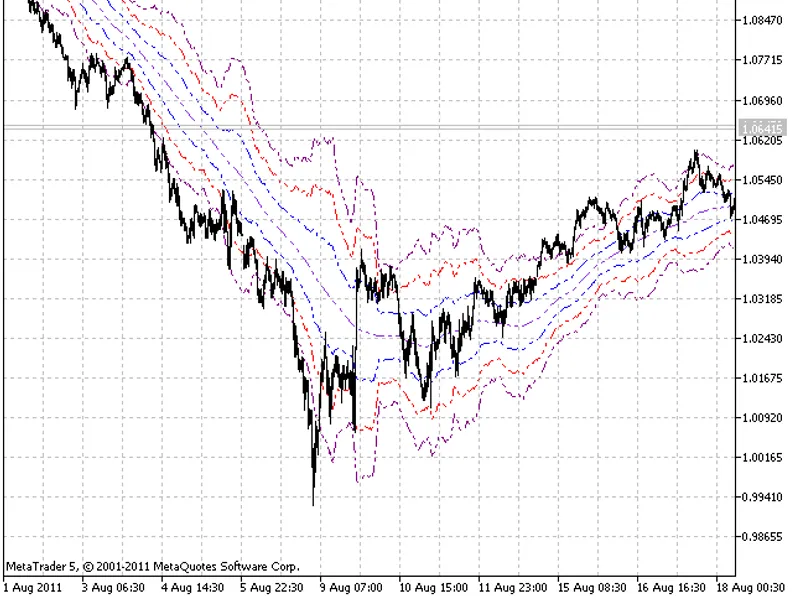
ATR Channels IndicatorThe ATR Channels indicator creates price movement channels based on the Average True Range (ATR) technical indicator. It clearly identifies moments of trend a...
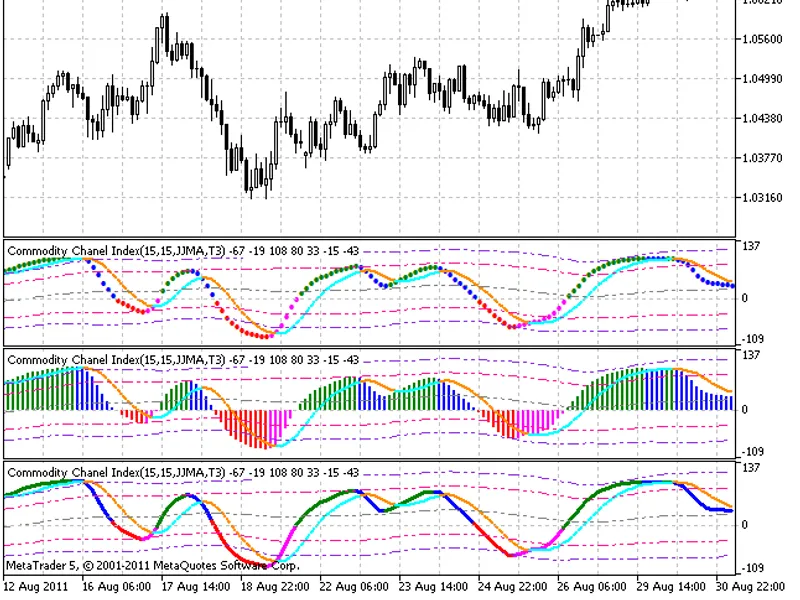
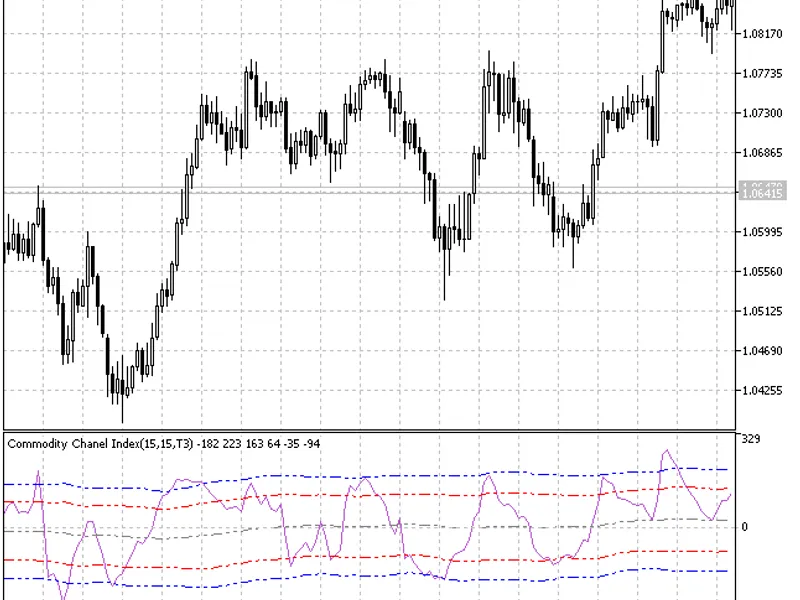
This indicator is a standard with the standard average deviation formula and the possibility to select smoothing algorithm and dynamically changing oversold/overbought levels.The o...
The DailyPivot_Shift indicator is distinct from the common DailyPivot indicator, as it allows the main levels to be calculated with a day start shift. This means it is possible to ...
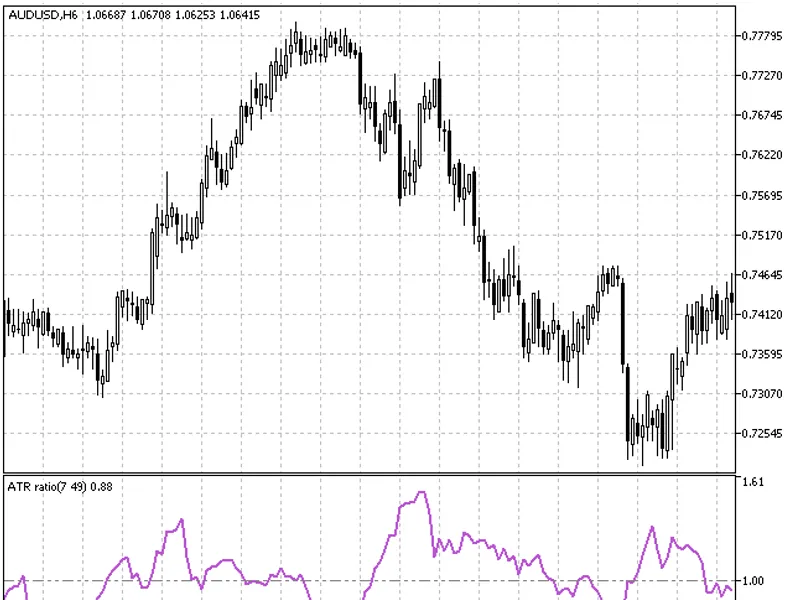
ATR Ratio IndicatorThe ATR Ratio indicator calculates the ratio between the fast and slow Average True Range (ATR).Indicator InterpretationThe ATR Ratio often reaches high values f...
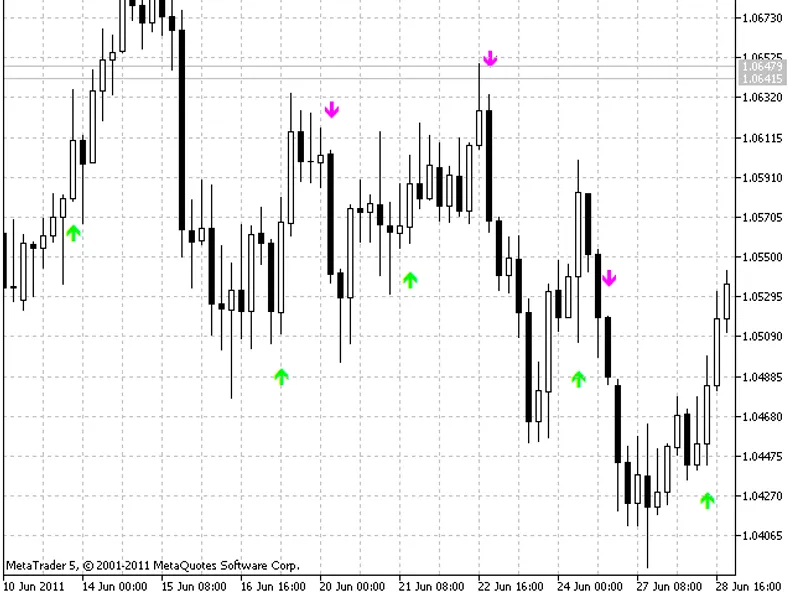
Simple indication of a newly born trend using colored arrows on a chart.This indicator was implemented in MQL4 and published in 2007.Bykov Trend Indicator- Displays colored arrows ...
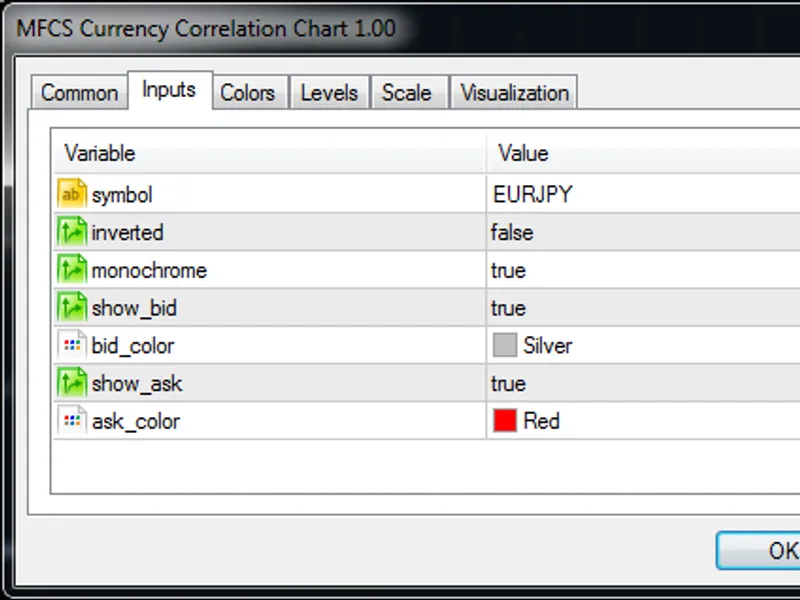
This indicator helps you visualize currency correlations on your trading charts.How to Use:1. Identify currency pairs you are interested in, such as EURUSD, GBPUSD, USDCHF, EURJPY....
The Darvas Box method of chart analysis, developed by Nicolas Darvas, is widely recognized in Europe and the USA, though less known in Russia. This description aims to clarify its ...
The Fine Fractals indicator identifies significant price curves, highs, and lows where standard indicators may fail. A 'shift by flat' input parameter has been added to improve the...
The standard indicator is not symmetrical. Its calculation logic generates the upper and lower channel borders without using antisymmetric algorithms. While this approach is accept...
This is a combination of two indicators in one. Histogram values are the sum of the values of two technical indicators. Moving average values are the difference between the values ...
Candlestick Pattern Entry Indicator
Indicator Input Parameters:
experiod - The number of bars used for trend filtration.
trendfilter - Turns the filter operation on or off.
how_b...
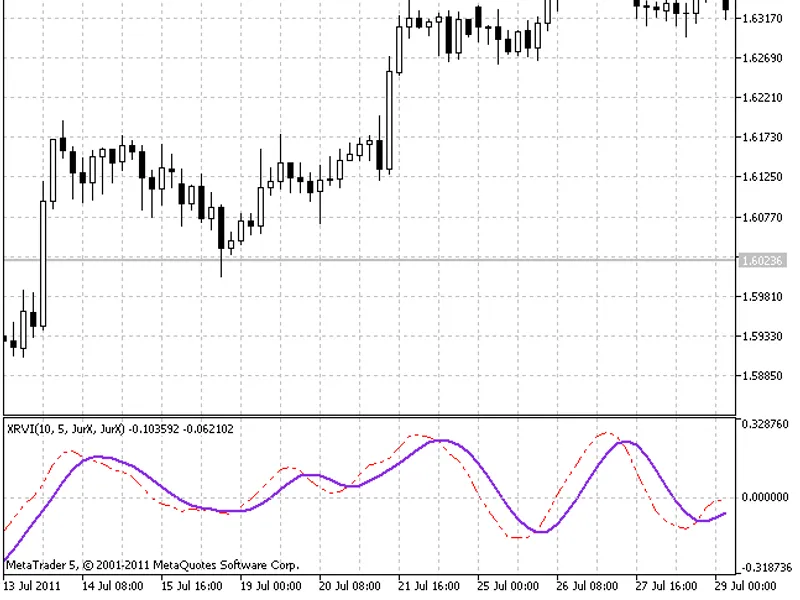
The Relative Vigor Index calculation is based on the idea that close prices are usually higher than the open ones during an uptrend. The reverse situation is true in case of a down...
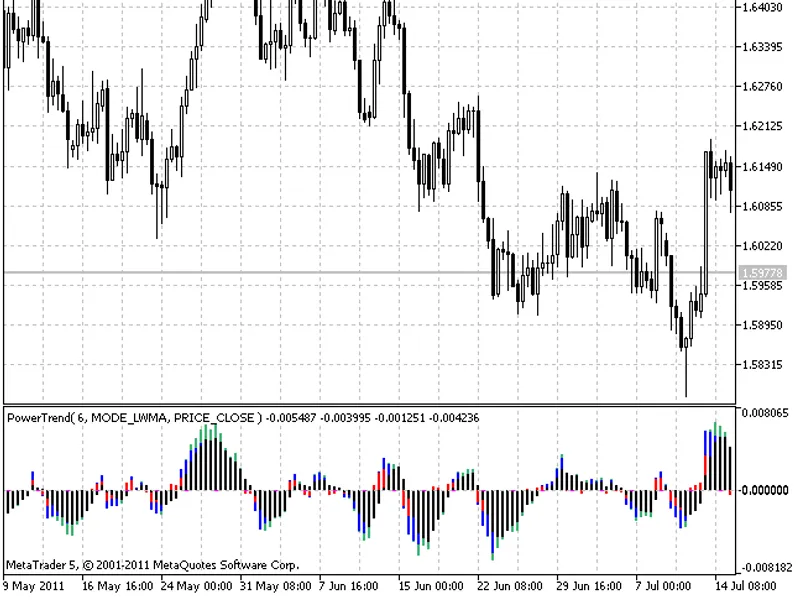
The Power Trend indicator identifies the strength and direction of a market trend.Trend Direction Determination:The indicator analyzes the histogram's position relative to the zero...
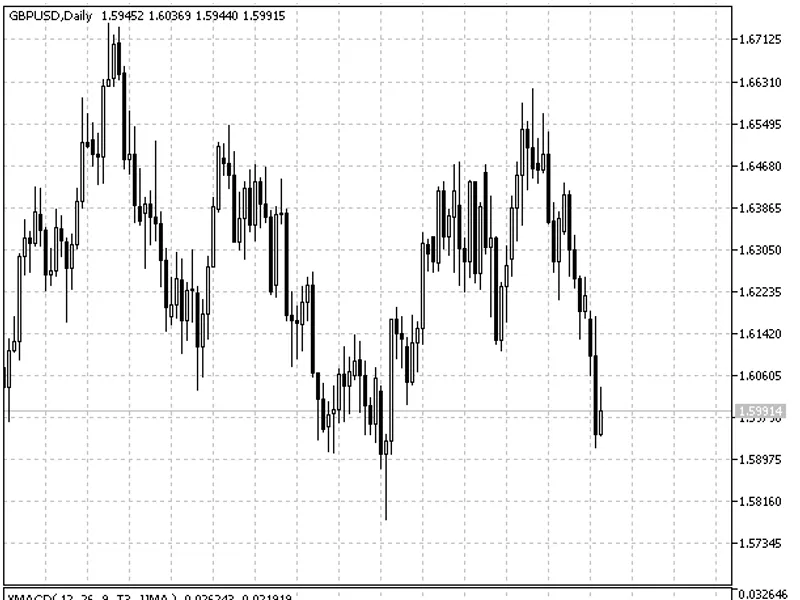
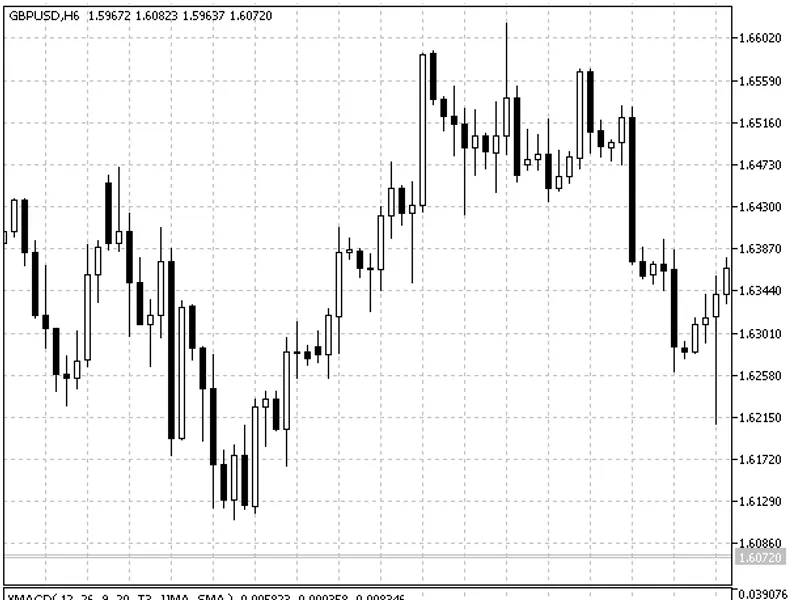
BB XMACD is a simple indicator variation that allows determining the points of a trend direction change and the current trend power.
It is generated in a separate chart window and ...
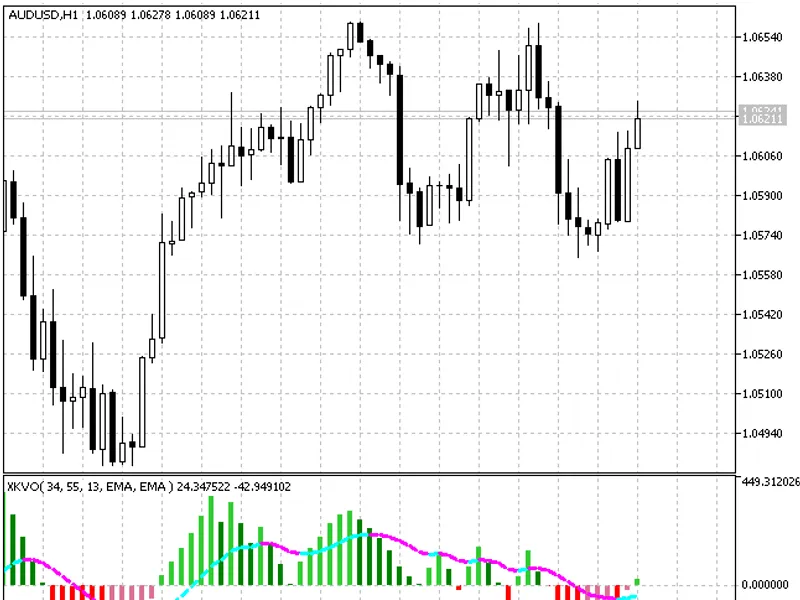
The Klinger Volume Oscillator (KVO) was developed by Stephen Klinger. This indicator possesses two seemingly contradictory characteristics: it is sensitive to short-term tops and b...
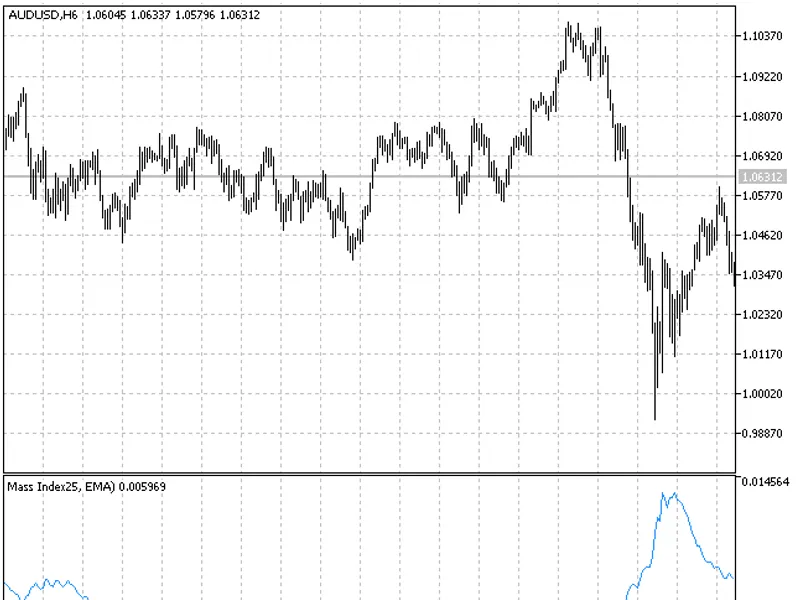
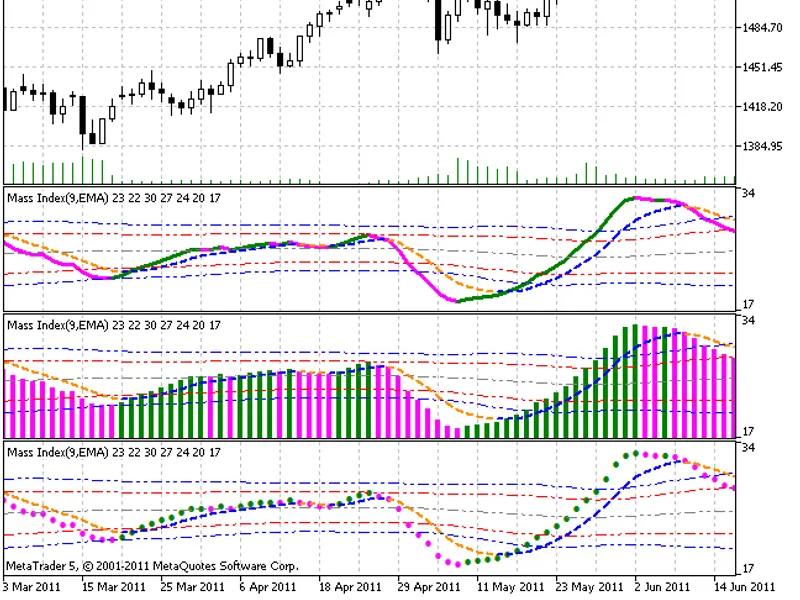
The Mass Index indicator is designed to identify potential trend reversals by measuring the changes in the average range between the highest and lowest prices over a specified peri...
This library provides essential matrix operations for use within MetaTrader 5.
Installation
Place the matrix.mqh file into the terminal_data_folder/mql5/include/ directory.Simple U...
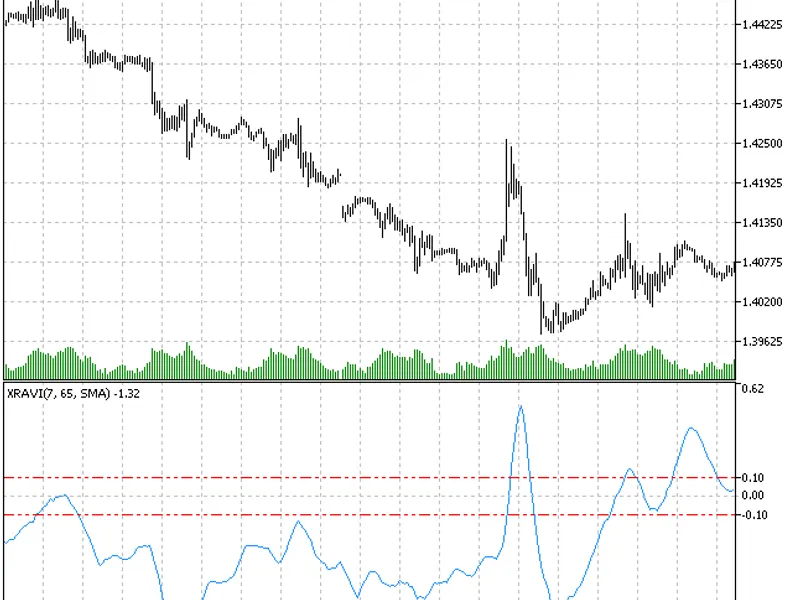
The Range Action Verification Index (RAVI) is a useful indicator developed by T. Chande. The principle of its generation is different from the one used to build the indicator. Chan...
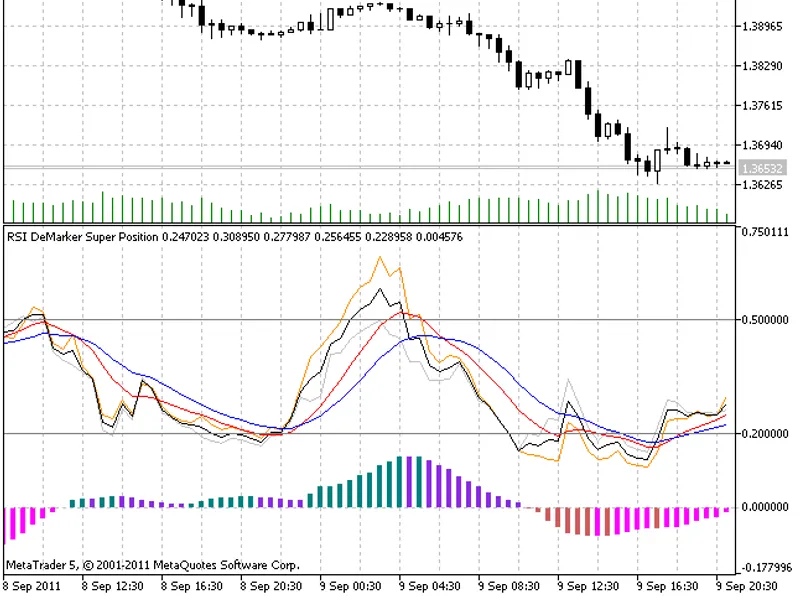
Cronex Super PositionThis indicator displays a superposition of technical indicators.It addresses the challenge of time spent switching between different indicator periods and para...
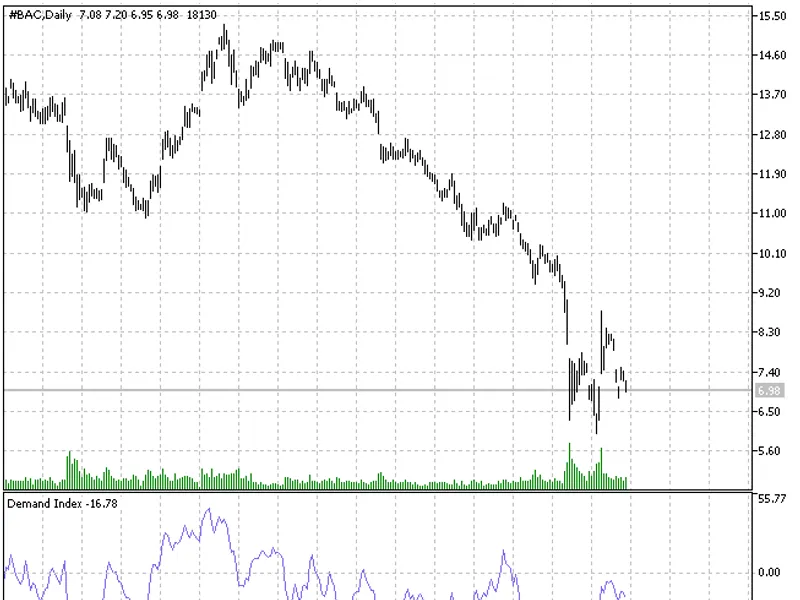
Understanding the Demand IndexThe Demand Index is a technical indicator that helps traders gauge the strength of market trends and anticipate potential reversals. It operates by co...
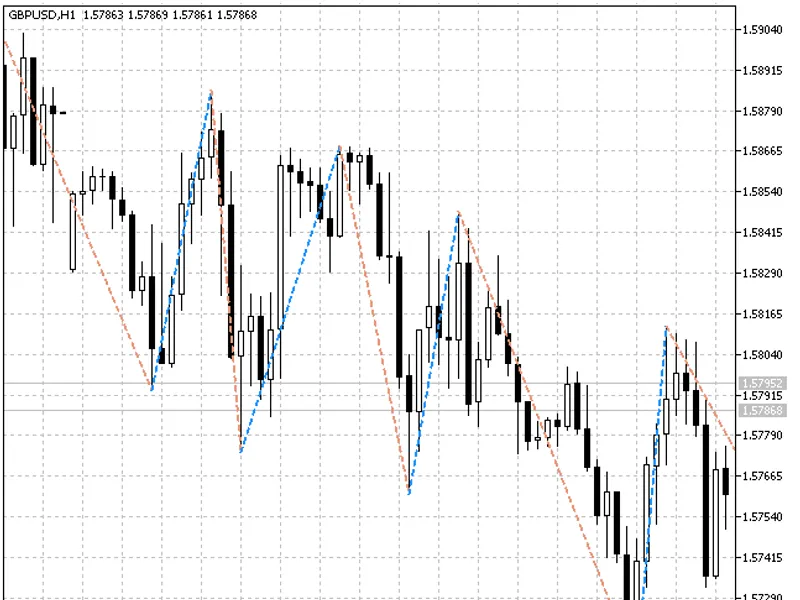
This indicator combines the Zig Zag pattern with the Parabolic SAR for enhanced trend identification.Input Parameters:Step(default value = 0.02) — Standard Parabolic SAR indicator ...
This indicator is a trend-following tool. Its operation principle is straightforward: a change to green signals the start of an uptrend, while a change to red indicates the beginni...
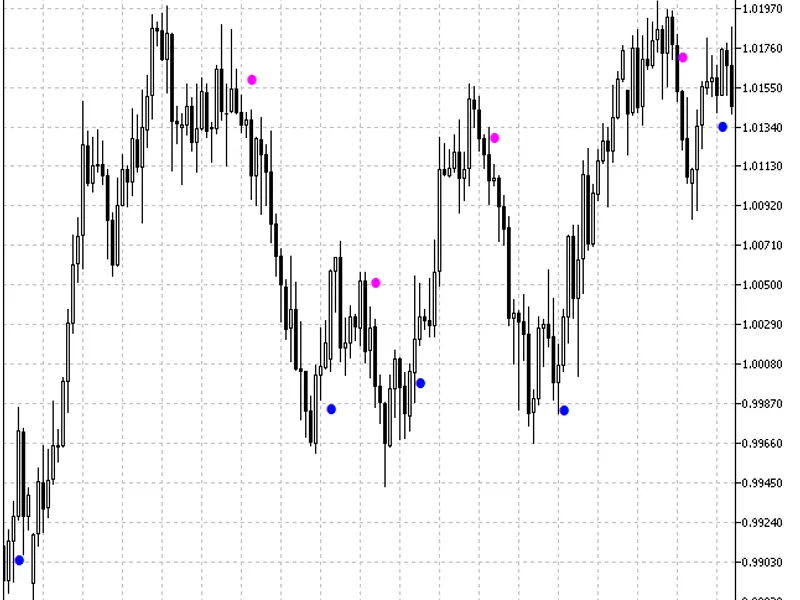
This indicator displays dots based on linear regression, with the regression period determined by the lr_per input parameter.Two arrays are utilized to construct the regression tra...
This Expert Advisor utilizes standard indicator signals: zero line crossover and signal line reversal.It also incorporates an aggressive strategy of adding to positions up to the m...
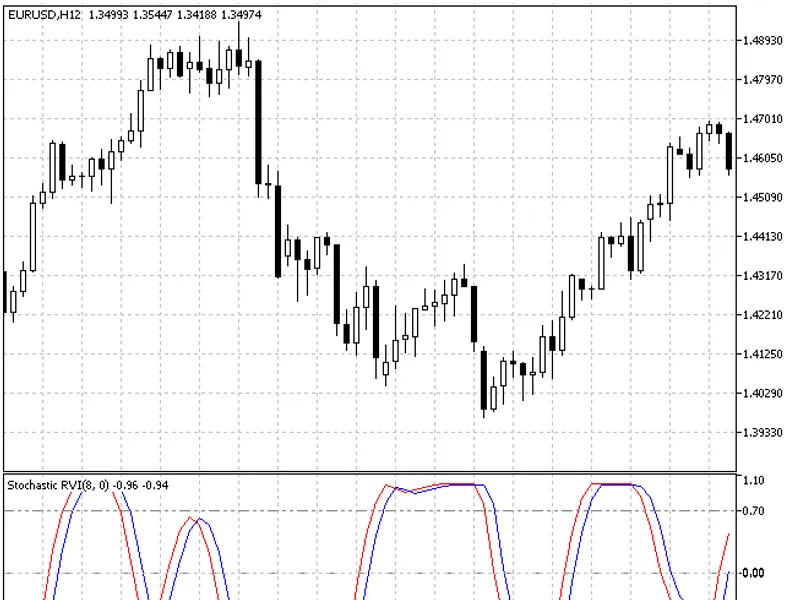
Stochastic RVI is a standard applied to the values of the Relative Vigor Index indicator instead of a price.Introduction to Stochastic RVIThe standard Stochastic Oscillator is not ...
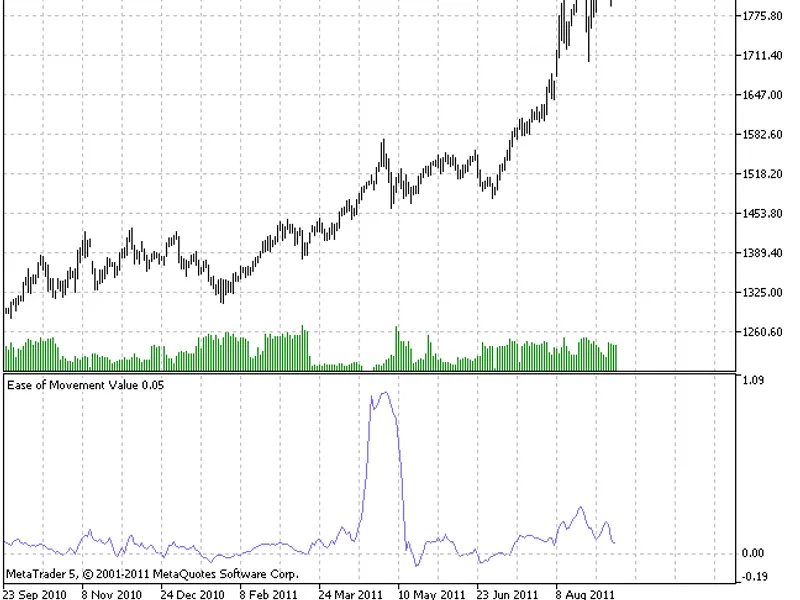
The Ease of Movement (EMV) technical indicator is used to display the ratio between the price change rate and market volume. The basic formula is as follows: Midpoint Move = (today...
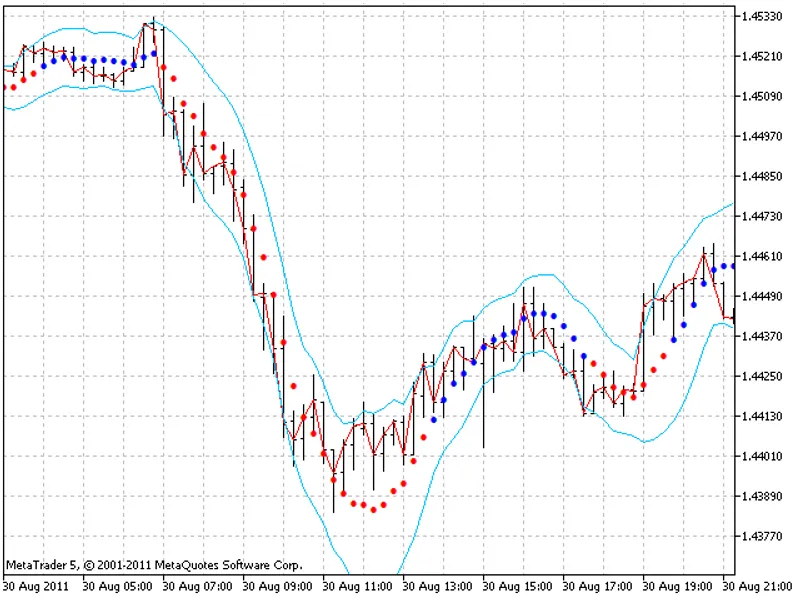
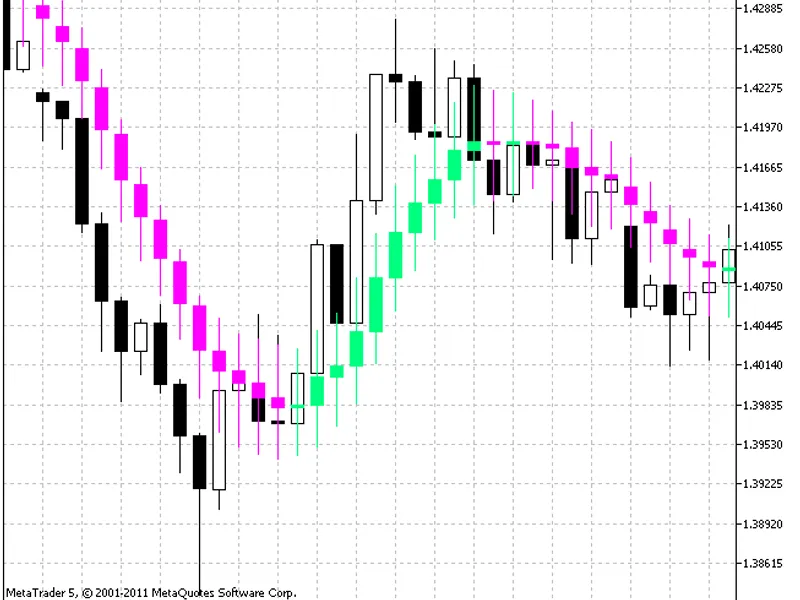
This indicator applies smoothing to all components of a price candlestick: open, high, low, and close.The indicator offers a clear visual representation of the current market trend...
The Bar Timer displays the current time position within a bar, showing the time elapsed since the bar's beginning and its duration as a percentage.This informer is useful for timin...
The Mass Index (MI) is intended for detection of trend reversals based on changes in the bandwidth between the highest and the lowest prices.When the bandwidth expands, the Mass In...
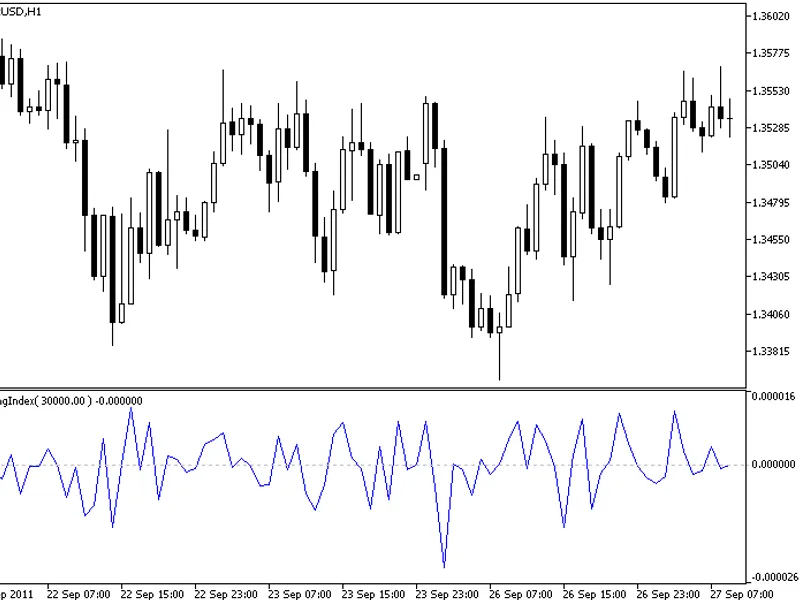
Swing Index is a mathematical expression representing trading activity over the last two bars. This indicator identifies an instrument's effective price by combining the current ba...
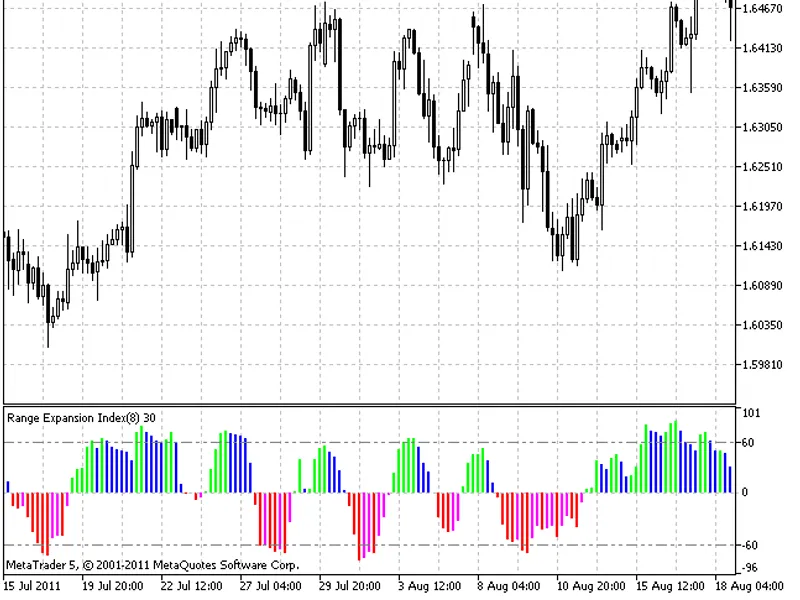
The Range Expansion Index (REI) is an oscillator designed to measure the rate of price change and identify overbought/oversold conditions, indicating price weakness or strength. It...
The indicator displays probabilistic reversal points.According to its developers, the price is most likely to reverse direction once the levels +0.5 and -0.5 are reached.This indic...
This indicator is inspired by an article published in November 2024.The indicator displays buy and sell signals. The simplest trading system using this indicator involves using mov...
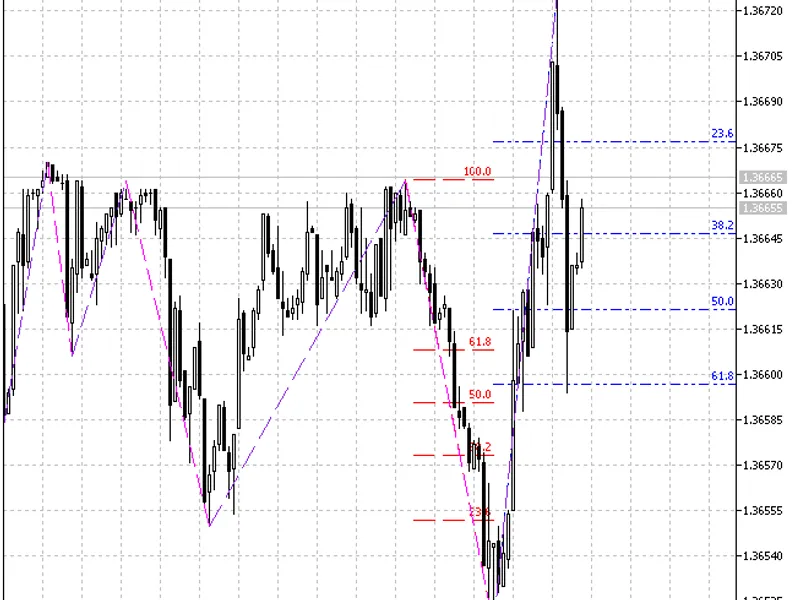
This indicator combines Zig Zag and Fibonacci levels to provide potential trading insights.Indicator Input ParametersThere are no configurable input parameters for this indicator. ...
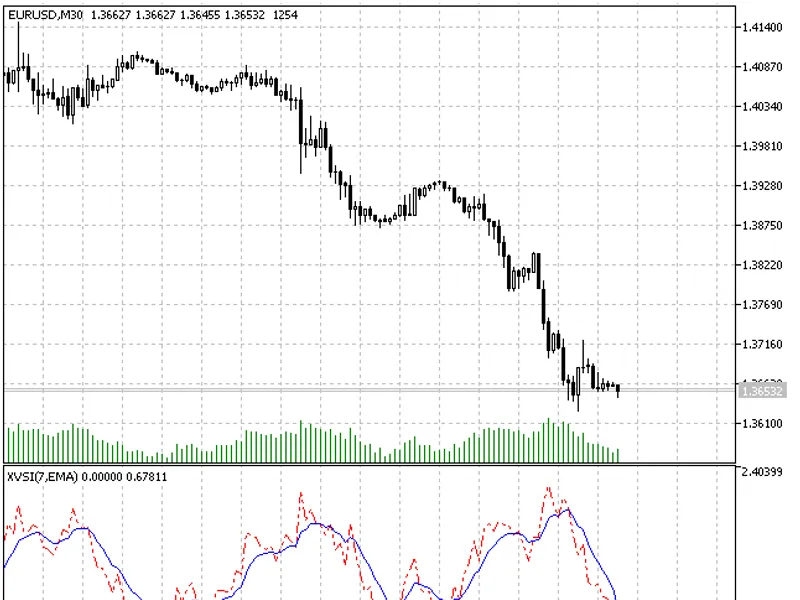
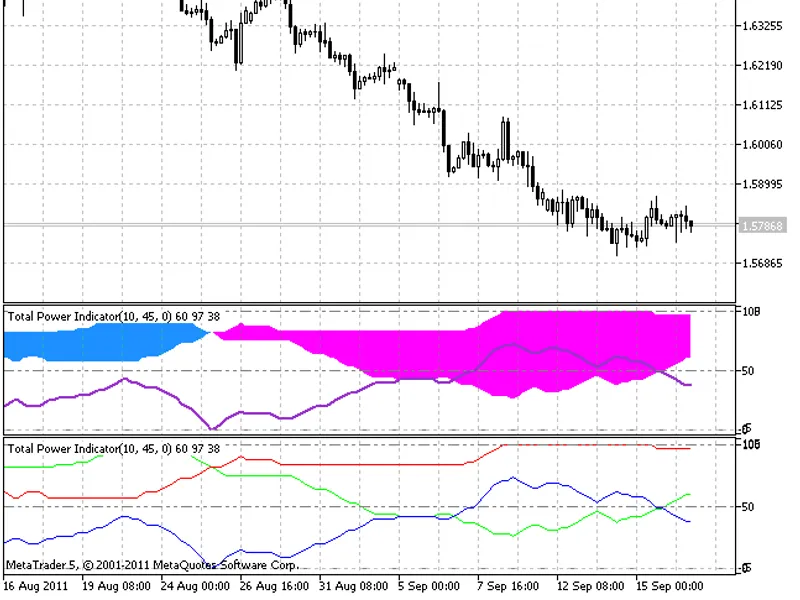
Total Power Indicator is based on two standard indicators.
The indicator calculates the number of bullish and bearish trend bars within a certain amount of time and then determine...
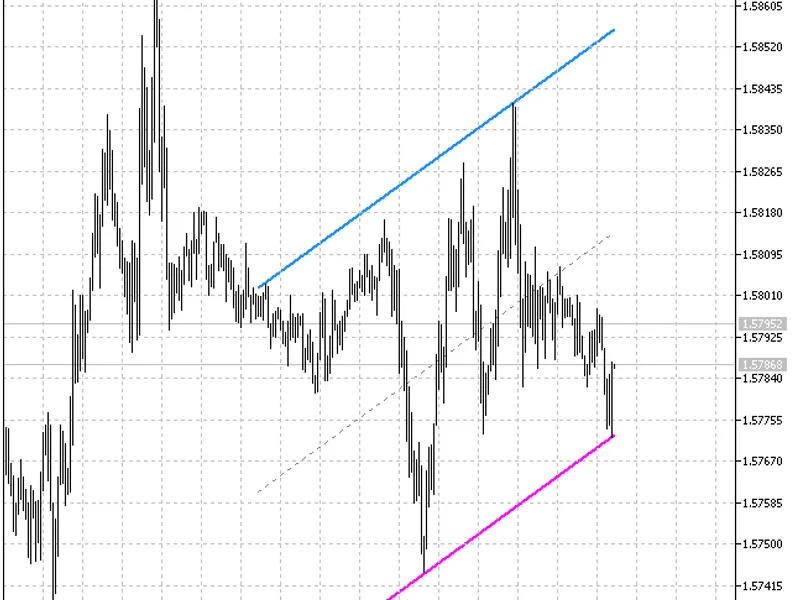
This trend indicator automatically generates channel lines in the direction of a trend.The indicator is quite simple, it is based on the assumption that the price moves from the up...