


Stochastic Oscillator: A Technical Indicator for Price Analysis
Info
The Stochastic Oscillator: A Technical Indicator for Price Analysis is a Indicator for MetaTrader 5 that the stochastic oscillator is a powerful technical indicator that provides insights into a security's price movement relative to its range over a specified time period. This indicator is presented as two lines: the %K line and the %D line.
Usage
This tool is typically used for enhancing chart analysis and decision making.
Platform
This Indicator works exclusively on MetaTrader 5 (both build 600+ and newer versions).
Setup
Place the downloaded file in MQL5/Indicators folder via File ? Open Data Folder in MetaTrader 5.
How to Install and Use Stochastic Oscillator: A Technical Indicator for Price Analysis
1. Installation: Place your file in the MQL/Indicators folder via "Open Data Folder" and restart your terminal.
2. Loading: Find the indicator in the Navigator, drag it onto your chart, and configure the input parameters in the popup window.
3. Customization: Press Ctrl+I to open the indicator list, select your tool, and click "Properties" to change colors, levels, or visual styles.
4. Updating: Replace the old file in the Indicators folder with the new version and restart the platform to apply changes.
Frequently Asked Questions
Q: Why is my indicator not showing? A: Verify the file is in the MQL/Indicators folder, or try right-clicking the "Indicators" tree in the Navigator and clicking "Refresh."
Q: Do custom indicators slow down the platform? A: Too many complex indicators can impact performance; remove unused ones via the "Indicator List" (Ctrl+I).
Q: Can I use MT4 indicators on MT5? A: No, MQL4 and MQL5 are distinct languages; ensure the indicator is compiled specifically for your platform version.
What this tool does
The Stochastic Oscillator is a powerful technical indicator that provides insights into a security's price movement relative to its range over a specified time period.
Typical Use Case
This Indicator excels in automated trading and technical analysis on MetaTrader 5.
Compatible Platform & Setup
This Indicator works on MetaTrader 5. Place the file in the MQL5/Indicators folder and restart the terminal.
Description & Settings
Related: Stochastic Multi-Timeframe Indicator - another powerful indicator for MetaTrader 5 traders.
The Stochastic Oscillator is a powerful technical indicator that provides insights into a security's price movement relative to its range over a specified time period.Also recommended: Stochastic Oscillator Indicator for MetaTrader 5 - similar indicator with strong performance on MetaTrader 5.
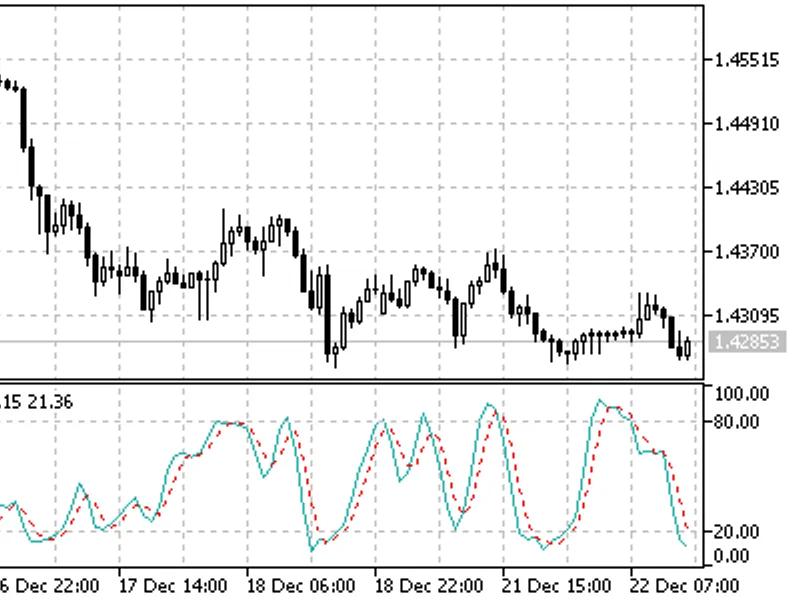
This indicator is presented as two lines: the %K line and the %D line. The %K line is the primary indicator, while the %D line is its moving average.
Here's how the Stochastic Oscillator can be interpreted:
- **Buy and Sell Signals**: Traders often look for specific levels, such as 20 and 80, as thresholds. When the oscillator falls below 20 and then rises above it, it may signal a buying opportunity. Conversely, when it rises above 80 and then falls below, it may indicate a selling opportunity.
- **Crossover Strategy**: Another approach is to watch for crossovers between the %K and %D lines. Buying when %K crosses above %D and selling when %K crosses below %D can be a simple yet effective strategy.
- **Divergence Analysis**: Traders also look for divergences between price action and the oscillator. For example, if prices are making new highs, but the Stochastic Oscillator fails to reach new highs, it could indicate a potential trend reversal.
Calculation:
The Stochastic Oscillator is calculated using four variables:
- **%K Period**: The number of time periods used in the stochastic calculation.
- **%K Slowing Period**: This value smooths the %K line. A setting of 1 is fast, while 3 is slow.
- **%D Period**: The number of periods for calculating the moving average of %K.
- **%D Smoothing Method**: The method (Exponential, Simple, Smoothed, or Weighted) used to calculate the %D moving average.
The formula for %K is:
%K = (CLOSE - LOW(%K)) / (HIGH(%K) - LOW(%K)) * 100
Where:
- CLOSE is the current closing price.
- LOW(%K) is the lowest low in the %K periods.
- HIGH(%K) is the highest high in the %K periods.
The %D moving average is calculated as:
%D = SMA(%K, N)
Where:
- N is the smoothing period.
- SMA is the Simple Moving Average.
You may also like: Channel and Stochastic Oscillator - excellent alternative for indicator users on MetaTrader 5.
⚠ Limitations & Risk Warning
- This tool is provided for educational and testing purposes only.
- Past performance does not guarantee future results.
- Trading involves substantial risk of loss. Use on a demo account first.
- Results may vary depending on market conditions, broker, and settings.
- We recommend thorough backtesting and forward testing before using with real funds.