


Color Parabolic SAR
Info
The Color Parabolic SAR is a Indicator for MetaTrader 5 that this indicator adds colors to the parabolic sar, enhancing its visual appeal and readability. The Parabolic SAR (Stop and Reverse) is a technical indicator designed for trend analysis in financial markets.
Usage
This tool is typically used for enhancing chart analysis and decision making.
Platform
This Indicator works exclusively on MetaTrader 5 (both build 600+ and newer versions).
Setup
Place the downloaded file in MQL5/Indicators folder via File ? Open Data Folder in MetaTrader 5.
How to Install and Use Color Parabolic SAR
1. Installation: Place your file in the MQL/Indicators folder via "Open Data Folder" and restart your terminal.
2. Loading: Find the indicator in the Navigator, drag it onto your chart, and configure the input parameters in the popup window.
3. Customization: Press Ctrl+I to open the indicator list, select your tool, and click "Properties" to change colors, levels, or visual styles.
4. Updating: Replace the old file in the Indicators folder with the new version and restart the platform to apply changes.
Frequently Asked Questions
Q: Why is my indicator not showing? A: Verify the file is in the MQL/Indicators folder, or try right-clicking the "Indicators" tree in the Navigator and clicking "Refresh."
Q: Do custom indicators slow down the platform? A: Too many complex indicators can impact performance; remove unused ones via the "Indicator List" (Ctrl+I).
Q: Can I use MT4 indicators on MT5? A: No, MQL4 and MQL5 are distinct languages; ensure the indicator is compiled specifically for your platform version.
What this tool does
This indicator adds colors to the Parabolic SAR, enhancing its visual appeal and readability.
Typical Use Case
This Indicator excels in automated trading and technical analysis on MetaTrader 5.
Compatible Platform & Setup
This Indicator works on MetaTrader 5. Place the file in the MQL5/Indicators folder and restart the terminal.
Description & Settings
Related: MACD Histogram Indicator (Multi-Color) - another powerful indicator for MetaTrader 5 traders.
This indicator adds colors to the Parabolic SAR, enhancing its visual appeal and readability.Also recommended: MACD Multi-Color Histogram with Signal Line - similar indicator with strong performance on MetaTrader 5.
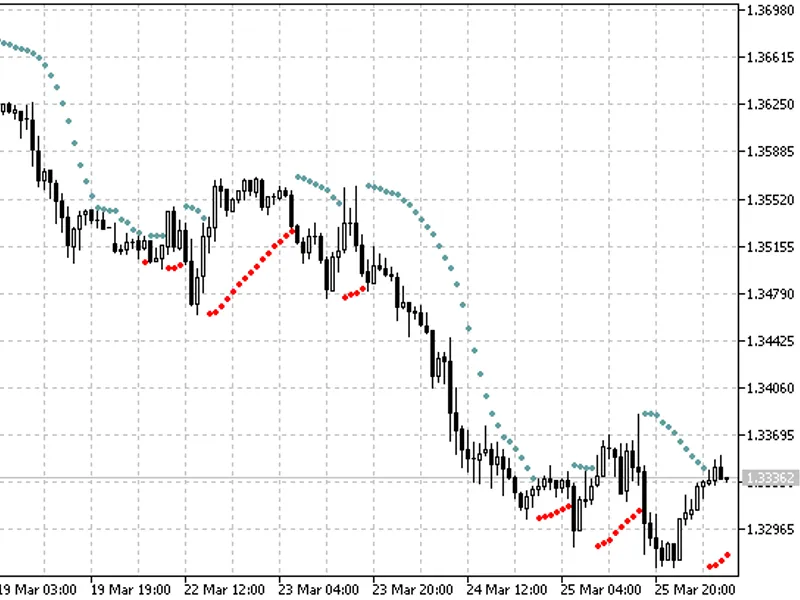
The Parabolic SAR (Stop and Reverse) is a technical indicator designed for trend analysis in financial markets. It is plotted on the price chart and functions similarly to a Moving Average, but with a key difference: the Parabolic SAR accelerates more rapidly and adjusts its position relative to the price.
During an uptrend, the Parabolic SAR is positioned below the price, while in a downtrend, it is above the price. When the price crosses the Parabolic SAR lines, the indicator reverses, and its subsequent values are plotted on the opposite side of the price. The maximum or minimum price of the previous period serves as the starting point for this reversal.
The indicator's reversal provides valuable signals, indicating a potential trend reversal or a transition to a correction or flat phase.
You may also like: Color Parabolic 2 - excellent alternative for indicator users on MetaTrader 5.
⚠ Limitations & Risk Warning
- This tool is provided for educational and testing purposes only.
- Past performance does not guarantee future results.
- Trading involves substantial risk of loss. Use on a demo account first.
- Results may vary depending on market conditions, broker, and settings.
- We recommend thorough backtesting and forward testing before using with real funds.