


Murrey Math Lines Indicator
Info
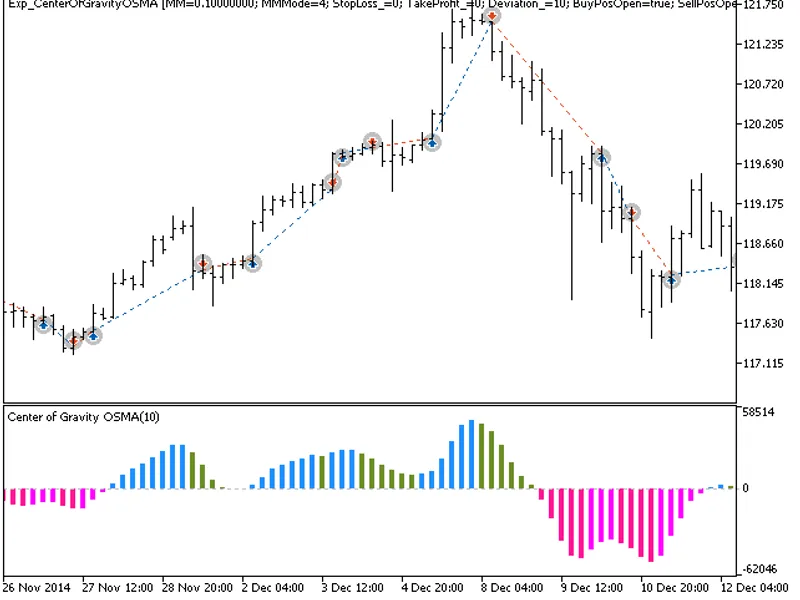
The Murrey Math Lines Indicator is a Indicator for MetaTrader 5 that this indicator is based on an algorithm that plots murrey math lines for historical price data without using objects. The concept is derived from Gann's theory that prices move in 1/8's, which act as support and resistance levels.
Usage
This tool is typically used for enhancing chart analysis and decision making.
Platform
This Indicator works exclusively on MetaTrader 5 (both build 600+ and newer versions).
Setup
Place the downloaded file in MQL5/Indicators folder via File ? Open Data Folder in MetaTrader 5.
How to Install and Use Murrey Math Lines Indicator
1. Installation: Place your file in the MQL/Indicators folder via "Open Data Folder" and restart your terminal.
2. Loading: Find the indicator in the Navigator, drag it onto your chart, and configure the input parameters in the popup window.
3. Customization: Press Ctrl+I to open the indicator list, select your tool, and click "Properties" to change colors, levels, or visual styles.
4. Updating: Replace the old file in the Indicators folder with the new version and restart the platform to apply changes.
Frequently Asked Questions
Q: Why is my indicator not showing? A: Verify the file is in the MQL/Indicators folder, or try right-clicking the "Indicators" tree in the Navigator and clicking "Refresh."
Q: Do custom indicators slow down the platform? A: Too many complex indicators can impact performance; remove unused ones via the "Indicator List" (Ctrl+I).
Q: Can I use MT4 indicators on MT5? A: No, MQL4 and MQL5 are distinct languages; ensure the indicator is compiled specifically for your platform version.
What this tool does
This indicator is based on an algorithm that plots Murrey Math Lines for historical price data without using objects.
Typical Use Case
This Indicator excels in automated trading and technical analysis on MetaTrader 5.
Compatible Platform & Setup
This Indicator works on MetaTrader 5. Place the file in the MQL5/Indicators folder and restart the terminal.
Description & Settings
Related: Murrey Math Lines for the Current Bar - another powerful indicator for MetaTrader 5 traders.
This indicator is based on an algorithm that plots Murrey Math Lines for historical price data without using objects.Also recommended: Murrey Math Fix Period - similar indicator with strong performance on MetaTrader 5.
The concept is derived from Gann's theory that prices move in 1/8's, which act as support and resistance levels. Each of the Murrey Math Lines (MMLs) has specific properties:
8/8 th's and 0/8 th's Lines
(Ultimate Resistance). These lines are the strongest barriers, offering significant resistance on the way up and support on the way down. Prices may struggle to break through these lines.
7/8 th's Line
(Weak, Stall and Reverse). This line is relatively weak. Prices that rise rapidly and stall at this line tend to reverse downwards. If prices continue without stalling, they may move towards the 8/8 th's line.
6/8 th's and 2/8 th's Lines
(Pivot, Reverse). These lines are powerful in forcing price reversals, both upwards and downwards, second only to the 4/8 th's line.
5/8 th's Line
(Top of Trading Range). Prices often fluctuate between the 5/8 th's and 3/8 th's lines, spending 40% of the time within this range. If prices sustain above this line for 10-12 days, they are considered to be in a premium area. However, if they fall below, they may seek support at lower levels.
4/8 th's Line
(Major Support/Resistance). This line offers the strongest support when prices are above it and the strongest resistance when prices are below. It is an ideal level for buying and selling.
3/8 th's Line
(Bottom of Trading Range). When prices are below this line and rising, it can be challenging to break through. If prices remain above for 10-12 days, they are likely to stay in the upper range.
1/8 th Line
(Weak, Stall and Reverse). Similar to the 7/8 th's line, this line is weak. Rapid price declines that stall at this line tend to reverse upwards. If prices continue, they may move towards the 0/8 th's line.
Note: This indicator is a valuable tool for traders, providing insights into potential support and resistance levels based on historical price behavior.
You may also like: Entropy Math - excellent alternative for indicator users on MetaTrader 5.
⚠ Limitations & Risk Warning
- This tool is provided for educational and testing purposes only.
- Past performance does not guarantee future results.
- Trading involves substantial risk of loss. Use on a demo account first.
- Results may vary depending on market conditions, broker, and settings.
- We recommend thorough backtesting and forward testing before using with real funds.