Murrey Math Lines for the Current Bar
This tool for MetaTrader 5 is specifically engineered to streamline your trading operations. This technical indicator acts as a specialized analysis tool designed to visualize market data. It helps traders identify emerging trends, momentum shifts, and key support or resistance levels by plotting statistical calculations directly onto price charts.
How to Setup and Use Murrey Math Lines for the Current Bar
1. Installation: Place your file in the MQL/Indicators folder via "Open Data Folder" and restart your terminal.
2. Loading: Find the indicator in the Navigator, drag it onto your chart, and configure the input parameters in the popup window.
3. Customization: Press Ctrl+I to open the indicator list, select your tool, and click "Properties" to change colors, levels, or visual styles.
4. Updating: Replace the old file in the Indicators folder with the new version and restart the platform to apply changes.
Frequently Asked Questions
Q: Why is my indicator not showing? A: Verify the file is in the MQL/Indicators folder, or try right-clicking the "Indicators" tree in the Navigator and clicking "Refresh."
Q: Do custom indicators slow down the platform? A: Too many complex indicators can impact performance; remove unused ones via the "Indicator List" (Ctrl+I).
Q: Can I use MT4 indicators on MT5? A: No, MQL4 and MQL5 are distinct languages; ensure the indicator is compiled specifically for your platform version.
Description & Settings
Vladislav Goshkov (VG)
The well-known theorist Thomas Henning Murrey is widely known in the world of the modern trading. It was he who adapted the theory of the legendary William Gann making it more understandable. Murrey created his famous math lines on the basis of the Gann's "Square of Nine" principles. The lines proved to be an effective and widely used tool for forecasting the market movements changes.
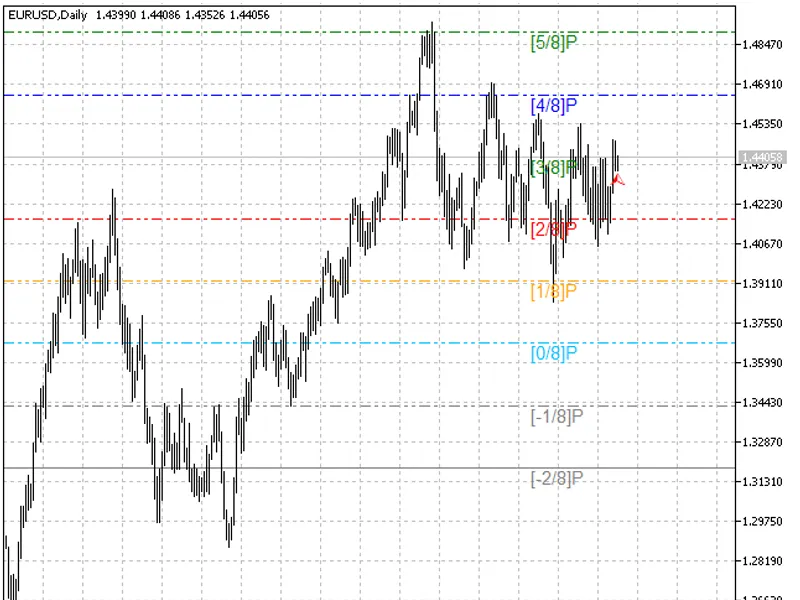
The idea of Murrey Lines can be shortly described the following way: the range is divided into 8 equal parts (areas) and two outer areas are additionally generated above and below. Areas are divided into lines.
Lines description (for a daily chart):
8/8 andf 0/8 lines (ultimate resistance). These are the most strong lines causing the most considerable resistance and support.
7/8 line (weak, stall and reverse). This is a weak line. If the price has moved too far and too fast and stopped near this line, it will quickly reverse downwards. If the price has not stopped near this line, it will continue moving up to 8/8.
1/8 line (weak, stall and reverse). This is a weak line. If the price has moved too far and too fast and stopped near this line, it will quickly reverse upwards. If the price has not stopped near this line, it will continue moving down to 0/8.
6/8 and 2/8 lines (pivot, reverse). These two lines are inferior only to the 4/8 line in their ability to reverse the price movement.
5/8 line (top of trading range). Prices of all markets spend 40% of their time to move between the 5/8 and 3/8 lines. In case the price moves around the 5/8 line and sticks to it for 10-12 days, it means that this is a "premium area" for selling and many traders follow this signal. But in case the price stays above 5/8, it is going to stay in the area for long. But if the price falls below 5/8, then it will most probably fall down to the next resistance level.
3/8 line (bottom of trading range). If the price below this level is moving upwards, it will be very difficult for it to break this level. In case this line is passed and the price stays above it for 10-12 days, then it will remain above this line and spend 40% of time moving between this line and the 5/8 line.
4/8 line (major support/resistance). This line provides maximum of resistance/support. This line is the best for buying/selling. In case the price is higher than 4/8, then it is a strong support level. In case the price is lower than 4/8, then it is a splendid resistance level.
The area between 8/8 and +2/8 is an overbought zone.
The area between 0/8 and -2/8 is an oversold zone.
This indicator was first implemented in MQL4 and published in 12.10.2007.