Williams’ Percent Range (%R)
This software component for MetaTrader 5 is built to enhance the capabilities of your trading environment. This technical indicator acts as a specialized analysis tool designed to visualize market data. It helps traders identify emerging trends, momentum shifts, and key support or resistance levels by plotting statistical calculations directly onto price charts.
How to Setup and Use Williams’ Percent Range (%R)
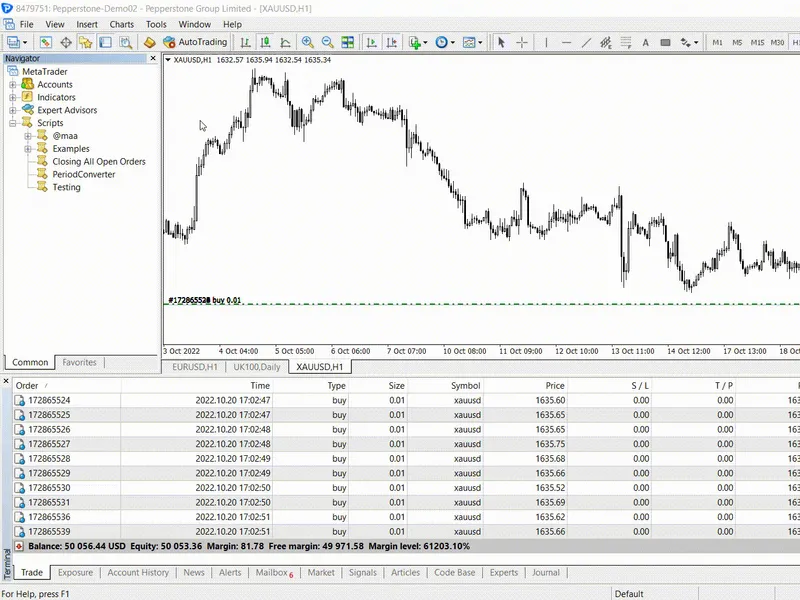
1. Installation: Place your file in the MQL/Indicators folder via "Open Data Folder" and restart your terminal.
2. Loading: Find the indicator in the Navigator, drag it onto your chart, and configure the input parameters in the popup window.
3. Customization: Press Ctrl+I to open the indicator list, select your tool, and click "Properties" to change colors, levels, or visual styles.
4. Updating: Replace the old file in the Indicators folder with the new version and restart the platform to apply changes.
Frequently Asked Questions
Q: Why is my indicator not showing? A: Verify the file is in the MQL/Indicators folder, or try right-clicking the "Indicators" tree in the Navigator and clicking "Refresh."
Q: Do custom indicators slow down the platform? A: Too many complex indicators can impact performance; remove unused ones via the "Indicator List" (Ctrl+I).
Q: Can I use MT4 indicators on MT5? A: No, MQL4 and MQL5 are distinct languages; ensure the indicator is compiled specifically for your platform version.
Description & Settings
Williams’ Percent Range technical indicator (%R) is a dynamic technical indicator, which determines whether the market is overbought/oversold. Williams’ %R is very similar to Stochastic Oscillator. The only difference is that %R has an upside down scale and the Stochastic Oscillator has internal smoothing.
To show the indicator in this upside down fashion, one places a minus symbol before the Williams Percent Range values (for example -30%). One should ignore the minus symbol when conducting the analysis.
Indicator values ranging between 80 and 100% indicate that the market is oversold. Indicator values ranging between 0 and 20% indicate that the market is overbought.
As with all overbought/oversold indicators, it is best to wait for the security’s price to change direction before placing your trades. For example, if an overbought/oversold indicator is showing an overbought condition, it is wise to wait for the security’s price to turn down before selling the security.
An interesting phenomenon of the Williams Percent Range indicator is its uncanny ability to anticipate a reversal in the underlying security’s price. The indicator almost always forms a peak and turns down a few days before the security’s price peaks and turns down. Likewise, Williams Percent Range usually creates a trough and turns up a few days before the security’s price turns up.
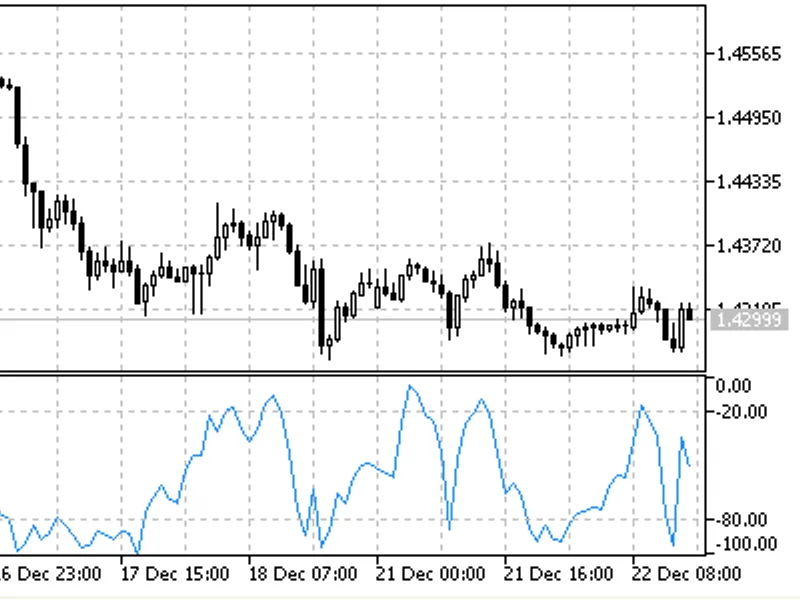
Williams’ Percent Range indicator
Calculation:
Below is the formula of the %R indicator calculation, which is very similar to the Stochastic Oscillator formula:
%R = (HIGH(i-n)-CLOSE)/(HIGH(i-n)-LOW(i-n))*100
where:
CLOSE - today’s closing price;
HIGH(i-n) - the highest high over a number (n) of previous periods;
LOW(i-n) - the lowest low over a number (n) of previous periods.