Fibonacci Structure Engine
This professional-grade solution for MetaTrader 5 helps traders achieve greater efficiency in their daily workflow. This technical indicator acts as a specialized analysis tool designed to visualize market data. It helps traders identify emerging trends, momentum shifts, and key support or resistance levels by plotting statistical calculations directly onto price charts.
How to Setup and Use Fibonacci Structure Engine
1. Installation: Place your file in the MQL/Indicators folder via "Open Data Folder" and restart your terminal.
2. Loading: Find the indicator in the Navigator, drag it onto your chart, and configure the input parameters in the popup window.
3. Customization: Press Ctrl+I to open the indicator list, select your tool, and click "Properties" to change colors, levels, or visual styles.
4. Updating: Replace the old file in the Indicators folder with the new version and restart the platform to apply changes.
Frequently Asked Questions
Q: Why is my indicator not showing? A: Verify the file is in the MQL/Indicators folder, or try right-clicking the "Indicators" tree in the Navigator and clicking "Refresh."
Q: Do custom indicators slow down the platform? A: Too many complex indicators can impact performance; remove unused ones via the "Indicator List" (Ctrl+I).
Q: Can I use MT4 indicators on MT5? A: No, MQL4 and MQL5 are distinct languages; ensure the indicator is compiled specifically for your platform version.
Description & Settings
The
FibStructureEngine
is a custom indicator for MetaTrader 5 that combines market structure analysis with automated Fibonacci retracement plotting. It detects pivot-based swing highs and swing lows, classifies each structural break as either a
Break of Structure (BOS)
or a
Change of Character (CHoCH)
, and anchors a complete Fibonacci grid between the most recent significant swing points. The result is a single, self-contained tool that replaces several manual steps a price action trader would otherwise perform by hand on every chart and every timeframe.
The indicator uses a 14-period ATR (Average True Range) internally both for filtering weak swing points and for computing signal confirmation scores. When a confirmed buy or sell condition is met, the indicator fires a real-time Alert with symbol, entry price, calculated stop-loss, and take-profit levels. This makes it practical not just as a visual aid but also as a monitoring tool in live trading sessions.
Key Features
Pivot-Based Swing Detection.
The indicator scans each bar using a configurable lookback length (SwingLength) to identify confirmed pivot highs and pivot lows. An optional ATR filter rejects minor swings that are too small relative to recent volatility, keeping the structure clean and noise-free.
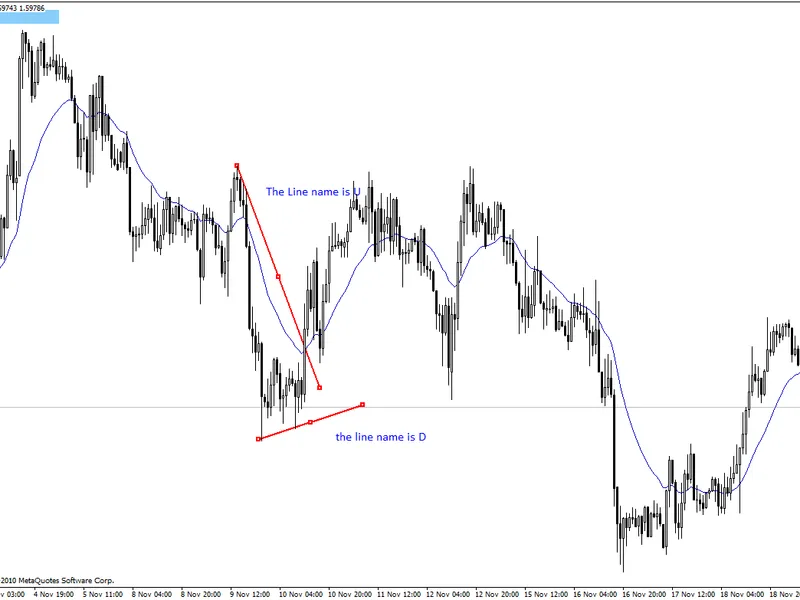
BOS and CHoCH Classification.
Every structural break is evaluated against the previous swing sequence. A break that continues the existing trend is labeled BOS. A break that violates the prior trend direction is labeled CHoCH, signaling a possible trend reversal. Both labels are drawn directly on the chart with colored trend lines.
Swing Labels (HH / HL / LH / LL).
Each confirmed pivot is tagged with its structural label: Higher High, Higher Low, Lower High, or Lower Low. These labels keep the context of the trend visible at a glance without any manual annotation.
Automated Fibonacci Grid.
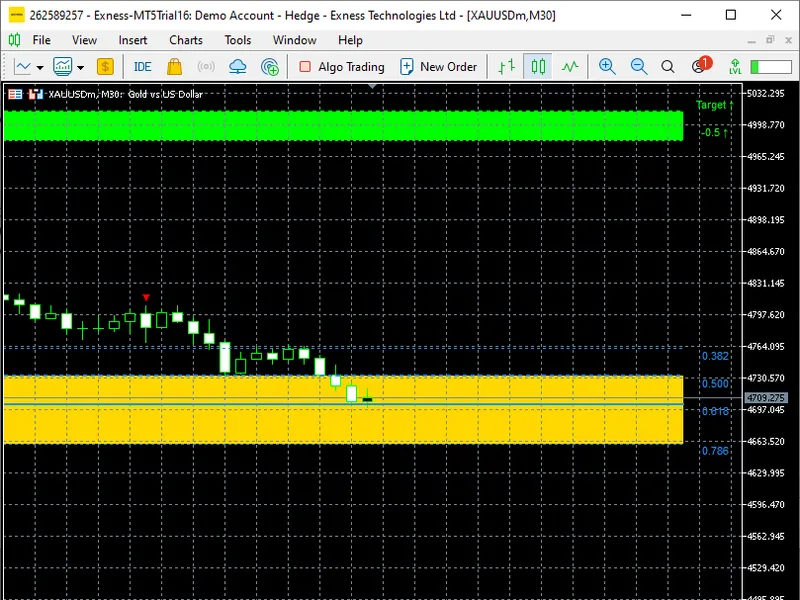
After every structural event, the indicator anchors Fibonacci retracement levels between the relevant swing high and swing low. Levels 0.236, 0.382, 0.500, 0.618, and 0.786 are supported individually, and each can be toggled on or off. A shaded Golden Zone box highlights the 0.500 to 0.786 area, which is the primary retracement window used in most price action frameworks.
Extension Targets.
In addition to retracement levels, the indicator draws extension targets at -0.500 and -0.618 beyond the swing origin. These act as projected take-profit zones in the direction of the structural break.
Confluence Detection.
When a Fibonacci level falls within a configurable ATR-based tolerance zone of another nearby level, it is highlighted in a separate color to mark high-confluence price areas where reactions are statistically more probable.
Engulfing Signal Detection.
The indicator identifies bullish and bearish engulfing candle patterns and incorporates them into its signal scoring system. Engulfing patterns near a Fibonacci level add to the overall confirmation score of a buy or sell signal.
Signal Confirmation and Cooldown.
Buy and sell signals are only emitted when a minimum confirmation score is met. A configurable cooldown parameter prevents back-to-back signals from firing on consecutive bars, reducing signal noise during choppy conditions.
Alert System.
On the most recently closed bar, when a confirmed signal is detected, a platform alert is fired with full trade information: symbol, direction, entry price, confirmation score, stop-loss, and take-profit calculated at ATR multiples of 1.5 and 2.5 respectively.
Full Visual Customization.
All drawn objects use configurable colors for bullish elements, bearish elements, Fibonacci lines, and confluence highlights. The structure line style and width are independently adjustable. Input Parameters How the Signal Logic Works
The indicator builds a confirmation score for each bar by checking several independent conditions and assigning a weight to each. A structural bias in the direction of the potential signal adds the highest weight. Price interacting with the Golden Zone (0.500 to 0.786 Fibonacci retracement area) adds a second layer. The presence of an engulfing candle pattern near a Fibonacci level, if ShowEngulfing is enabled, contributes an additional increment. The signal is only emitted when the accumulated score meets a minimum threshold, and only if the cooldown bars since the last signal of the same type have elapsed. This layered approach means that isolated Fibonacci touches without structural context will not generate false signals, while high-probability setups that align structure, retracement, and candle pattern receive fast confirmation.
Stop-loss is calculated as the entry price minus 1.5 x ATR for buy signals, and entry plus 1.5 x ATR for sell signals. Take-profit is set at 2.5 x ATR from entry in the signal direction. These values are reported in the alert message but are not plotted on the chart, leaving the trader free to use the Fibonacci extension targets as their preferred TP reference instead.
Note:
This indicator is provided for educational and analytical purposes. Always validate its signals on a demo account across different symbols and timeframes before applying it to a live trading environment. Past visual accuracy on historical bars does not guarantee future performance.