

Zig Zag Indicator with Enhanced Features
Info
The Zig Zag Indicator with Enhanced Features is a Indicator for MetaTrader 4 that taking a closer look at the workings of the zigzag indicator the zigzag indicator is one of those indicators that, at a misleading first glance, seems to be the holy grail of all indicators for finding tops and bottoms for set-ups like swing or trend following strategies. Quite often, newcomers tend to be totally amazed by it, believing that with it, they cannot go wrong.
Usage
This tool is typically used for enhancing chart analysis and decision making.
Platform
This Indicator works exclusively on MetaTrader 4 (both build 600+ and newer versions).
Setup
Place the downloaded file in MQL4/Indicators folder via File ? Open Data Folder in MetaTrader 4.
How to Install and Use Zig Zag Indicator with Enhanced Features
1. Installation: Place your file in the MQL/Indicators folder via "Open Data Folder" and restart your terminal.
2. Loading: Find the indicator in the Navigator, drag it onto your chart, and configure the input parameters in the popup window.
3. Customization: Press Ctrl+I to open the indicator list, select your tool, and click "Properties" to change colors, levels, or visual styles.
4. Updating: Replace the old file in the Indicators folder with the new version and restart the platform to apply changes.
Frequently Asked Questions
Q: Why is my indicator not showing? A: Verify the file is in the MQL/Indicators folder, or try right-clicking the "Indicators" tree in the Navigator and clicking "Refresh."
Q: Do custom indicators slow down the platform? A: Too many complex indicators can impact performance; remove unused ones via the "Indicator List" (Ctrl+I).
Q: Can I use MT4 indicators on MT5? A: No, MQL4 and MQL5 are distinct languages; ensure the indicator is compiled specifically for your platform version.
What this tool does
Taking a closer look at the workings of the zigzag indicator The zigzag indicator is one of those indicators that, at a misleading first glance, seems to be the holy grail of all indicators for finding tops and bottoms for set-ups like swing or trend following strategies.
Typical Use Case
This Indicator excels in automated trading and technical analysis on MetaTrader 4.
Compatible Platform & Setup
This Indicator works on MetaTrader 4. Place the file in the MQL4/Indicators folder and restart the terminal.
Description & Settings
Related: External Range Liquidity (ERL) Indicator: Advanced Market Structure and Liquidity Analysis - another powerful indicator for MetaTrader 4 traders.
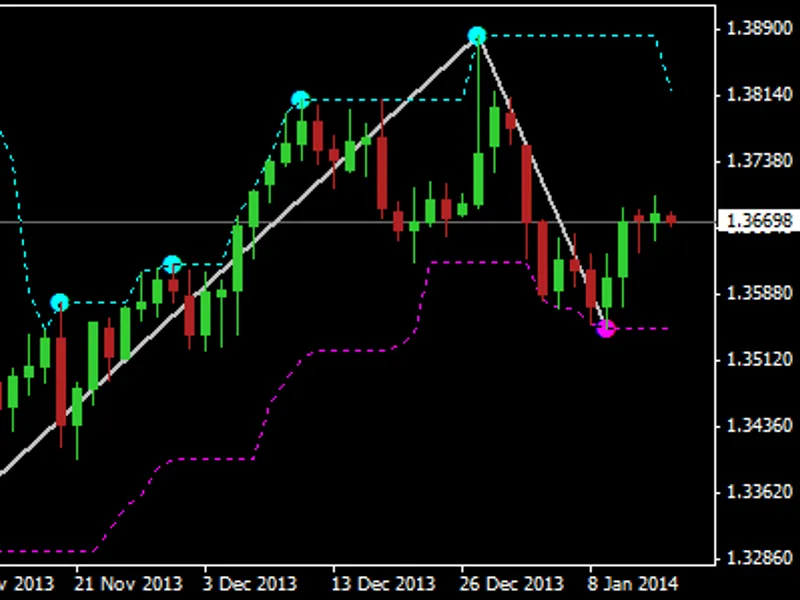
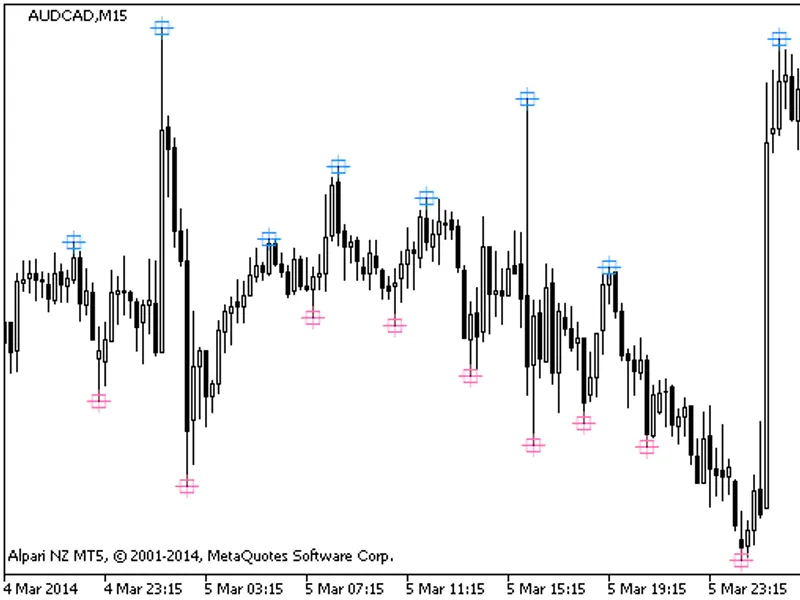
Taking a closer look at the workings of the zigzag indicator The zigzag indicator is one of those indicators that, at a misleading first glance, seems to be the holy grail of all indicators for finding tops and bottoms for set-ups like swing or trend following strategies. Quite often, newcomers tend to be totally amazed by it, believing that with it, they cannot go wrong. In reality, however, nothing could be further from the truth, mainly because it does something called repainting. In other words, during a live progression of price action changes, the indicator changes the most recent top or bottom in order to reflect the new price data. By the time the zigzag top or bottom has settled in and established itself on the indicator, the current situation of the market has long changed and is no longer congruent with the point that was initially indicated as being a top or a bottom of the prices. This, however, does not mean that this indicator is worthless. On the contrary, it can be used quite effectively for analyzing past data and creating very good setups for many a strategy - just not in the way most newcomers believe it to be. Now, there are many ways that this indicator is used effectively, and commenters are invited to share their ideas about how to effectively use it in their strategies, but that is not the main objective of this article. The original zigzag code was taken and rewritten in a more easily readable form, and to visually display many of its internal workings which usually are not visible with the original indicator. Here is the list of the extra features which this rendition of the indicator, namely zigzagextras, will display: - Lines graphs are displayed showing the highest highs and lowest lows for the depth period, one of the parameters of the original indicator. - Besides the current and finalized top and bottom points used in the zigzag pattern, it also displays the past points that were considered as strong candidates that at a point were considered a valid top or bottom for the zigzag pattern. These are displayed as little fully filled circles at highs and lows. - Optionally, the indicator can also display all breakout points, breaking above highs or below lows of the depth period, that were also considered as potential tops and bottoms in the internal workings of the zigzag indicator. It is usually these that are most often repainted as current prices evolve and that newcomers erroneously consider as a valid current top or bottom with disastrous results for their egos and account balance. The main purpose of the code and the extra visual cues serves the purpose of not only better understanding the workings of this indicator, but also as possible signals that could be used in many a strategy that you may wish. They could be useful for quick scalping in breakouts or as pre-signals prior to retracements or others which have not even occurred to me yet. I am sure that many of you will come up with many ideas and hopefully will be willing to share them here with all that read this. Instructions: - Just attach the indicator to a chart and set the parameters as you would for the original zigzag indicator. Please note, however, that the order of the parameters is different and that the depth and backstep were placed together as they are bar periods or counts. Also, the deviation parameter also caters for decimal fractions of a pip (in the case of 3/5 digit brokers). Optionally set the boolean flag to also show breakout points on the graph. - You can also enable an alert to be triggered on breakouts of highs and lows. The alert text is configurable so that it can be presented in your own language or words. Version change log: - Please let me know if you find any bugs or have any suggestions or features that you would like to have incorporated in future releases. - v1.5: Added compiler directive for strict compilation mode. - v1.4: Bug fix of a sporadic array out of range error. - v1.3: Allows the alerts to be used, even if not displaying the breakouts. - v1.2: Displays the symbol and time frame (period) in alert messages, facilitating its use on multiple charts simultaneously. - v1.1: Allows an alert to be set on breakouts of highs or lows. There was also a bug fixed that prevented the indicator from updating on fresh tick data. Example views of the indicator (without and with the optional breakout points): Please note, that all codebase publications' source code are now also available in public projects tab of metaeditor under the name fmic in 2026.Also recommended: B Bands Psar Indicator - similar indicator with strong performance on MetaTrader 4.
You may also like: Fast Stochastic Indicator - excellent alternative for indicator users on MetaTrader 4.
Source Code
/.......
⚠ Limitations & Risk Warning
- This tool is provided for educational and testing purposes only.
- Past performance does not guarantee future results.
- Trading involves substantial risk of loss. Use on a demo account first.
- Results may vary depending on market conditions, broker, and settings.
- We recommend thorough backtesting and forward testing before using with real funds.