
ma c d-v
Info
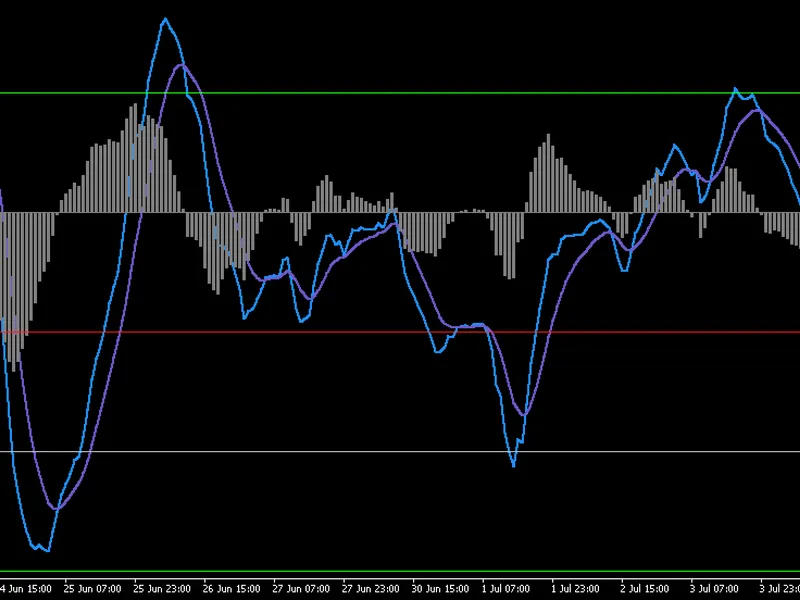
The ma c d-v is a Indicator for MetaTrader 4 that the indicator computes a fast and slow moving average of the selected price source, derives the macd line as their difference, and forms a smoothed signal line. the histogram represents the gap between macd and signal, which helps to identify momentum build-up, exhaustion, and early trend shifts.
Usage
This tool is typically used for enhancing chart analysis and decision making.
Platform
This Indicator works exclusively on MetaTrader 4 (both build 600+ and newer versions).
Setup
Place the downloaded file in MQL4/Indicators folder via File ? Open Data Folder in MetaTrader 4.
How to Install and Use ma c d-v
1. Installation: Place your file in the MQL/Indicators folder via "Open Data Folder" and restart your terminal.
2. Loading: Find the indicator in the Navigator, drag it onto your chart, and configure the input parameters in the popup window.
3. Customization: Press Ctrl+I to open the indicator list, select your tool, and click "Properties" to change colors, levels, or visual styles.
4. Updating: Replace the old file in the Indicators folder with the new version and restart the platform to apply changes.
Frequently Asked Questions
Q: Why is my indicator not showing? A: Verify the file is in the MQL/Indicators folder, or try right-clicking the "Indicators" tree in the Navigator and clicking "Refresh."
Q: Do custom indicators slow down the platform? A: Too many complex indicators can impact performance; remove unused ones via the "Indicator List" (Ctrl+I).
Q: Can I use MT4 indicators on MT5? A: No, MQL4 and MQL5 are distinct languages; ensure the indicator is compiled specifically for your platform version.
What this tool does
the indicator computes a fast and slow moving average of the selected price source, derives the macd line as their difference, and forms a smoothed signal line.
Typical Use Case
This Indicator excels in automated trading and technical analysis on MetaTrader 4.
Compatible Platform & Setup
This Indicator works on MetaTrader 4. Place the file in the MQL4/Indicators folder and restart the terminal.
Description & Settings
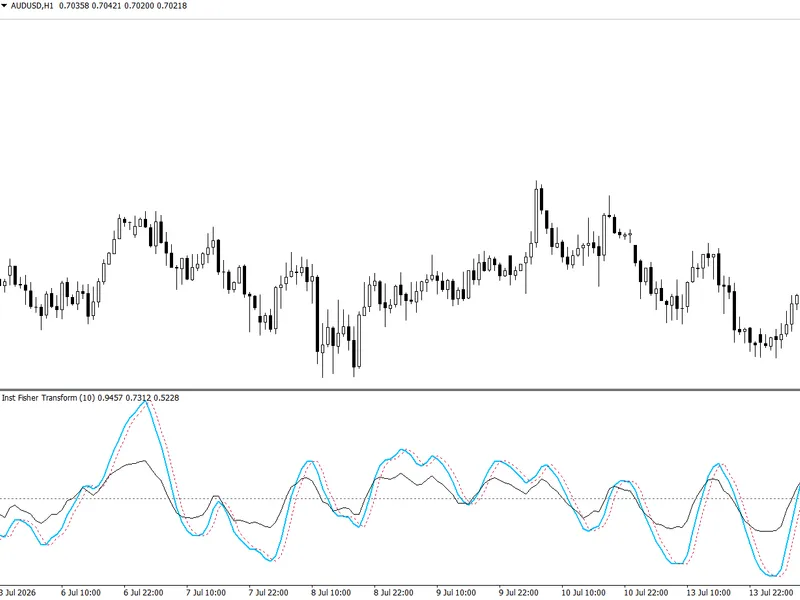
Related: Institutional Ehlers Fisher Transform: Advanced Price Normalization for MT4 - another powerful indicator for MetaTrader 4 traders.
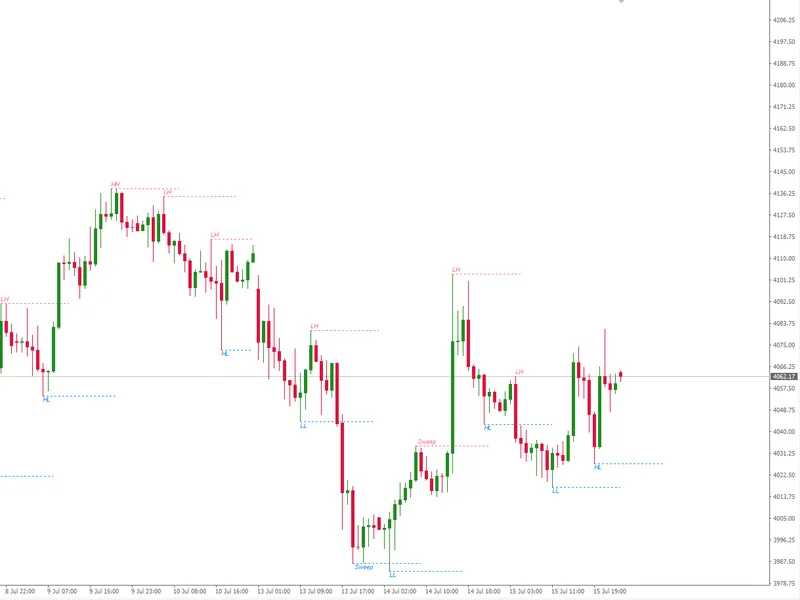
Also recommended: External Range Liquidity (ERL) Indicator: Advanced Market Structure and Liquidity Analysis - similar indicator with strong performance on MetaTrader 4.
the indicator computes a fast and slow moving average of the selected price source, derives the macd line as their difference, and forms a smoothed signal line. the histogram represents the gap between macd and signal, which helps to identify momentum build-up, exhaustion, and early trend shifts. crossovers and histogram expansion serve as primary trade-timing cues. zero-line interaction reveals broader momentum regime changes, while contraction warns of potential reversals or consolidation phases.interpretation remains consistent with standard macd theory, while providing a more balanced response to volatility. a macd line crossing above the signal suggests rising bullish momentum; crossing below signals growing bearish momentum. histogram expansion indicates acceleration, whereas flattening signals deceleration. divergences between price and histogram may highlight weakening trends. the indicator functions effectively across all liquid symbols and timeframes, though confirmation with a higher-timeframe trend filter is recommended for robustness.
external variables
fastlen: period for fast ema in macd-v numerator.
slowlen: period for slow ema; paired with fast to form spread.
signallen: ema smoothing length for the signal line.
atrperiod: atr lookback used to normalize macd spread (volatility scaling).
maxbarsback: limit on historical bars processed (0 = use all available).
showhistogram: toggles rendering of macd-v minus signal histogram.
showlevels: enables creation of predefined horizontal level lines.
these variables enable users to tailor sensitivity, display, and alert behaviour to the trading style. no symbol-specific configuration is required; it is suitable for all markets.
recommended use
the indicator may be applied on any timeframe. intraday traders may prefer m15–h1, while swing or position traders will find h4–d1 advantageous. combining the indicator with a trend filter significantly reduces noise and enhances cross-direction accuracy. the histogram is especially useful for assessing momentum exhaustion and identifying potential reversals when expansion slows.
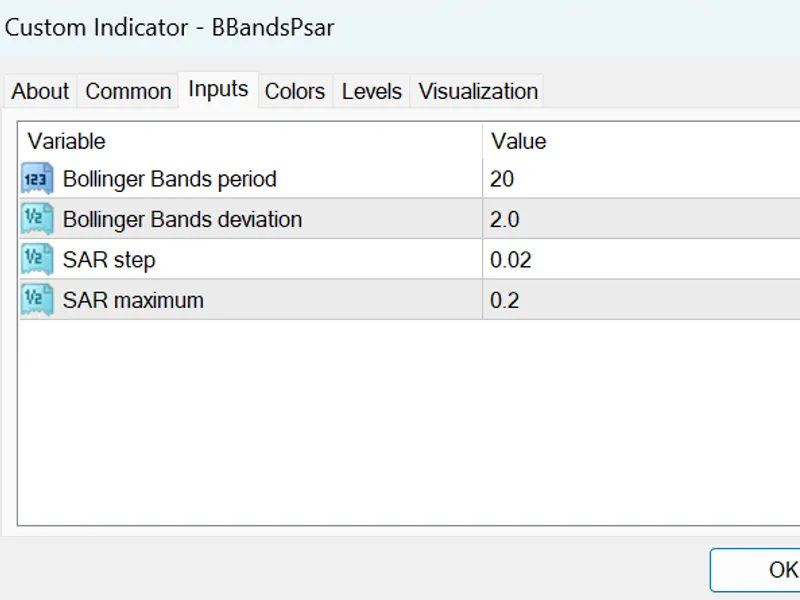
You may also like: B Bands Psar Indicator - excellent alternative for indicator users on MetaTrader 4.
Source Code
#property copyright "robotfx"
#property link "https://robotfx.org"
#property version   "1.13"
#property strict
#property indicator_chart_window
#property indicator_buffers 1
enum enum_macdv_display_mode
   {
   heat_map   = 0,
   dashboard  = 1
.......
⚠ Limitations & Risk Warning
- This tool is provided for educational and testing purposes only.
- Past performance does not guarantee future results.
- Trading involves substantial risk of loss. Use on a demo account first.
- Results may vary depending on market conditions, broker, and settings.
- We recommend thorough backtesting and forward testing before using with real funds.