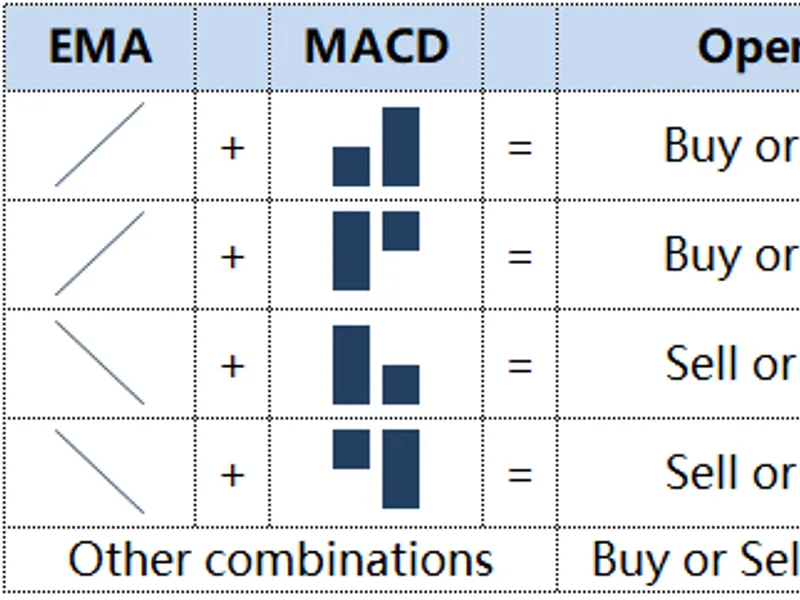
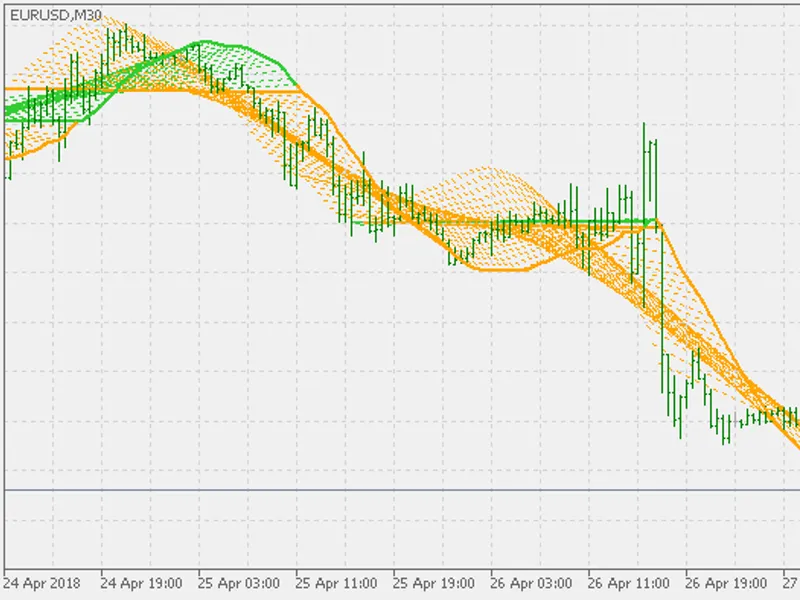
The index is mainly based on the slope of EMA and MACD, and the following figure shows the principle of the indicator:Figure 1: How the index worksThe effect is as follows:Figure 2...
A variation of linear regression.Instead of showing just the liner regression value, the indicator is showing corresponding linear regression lines too to indicate what is the best...
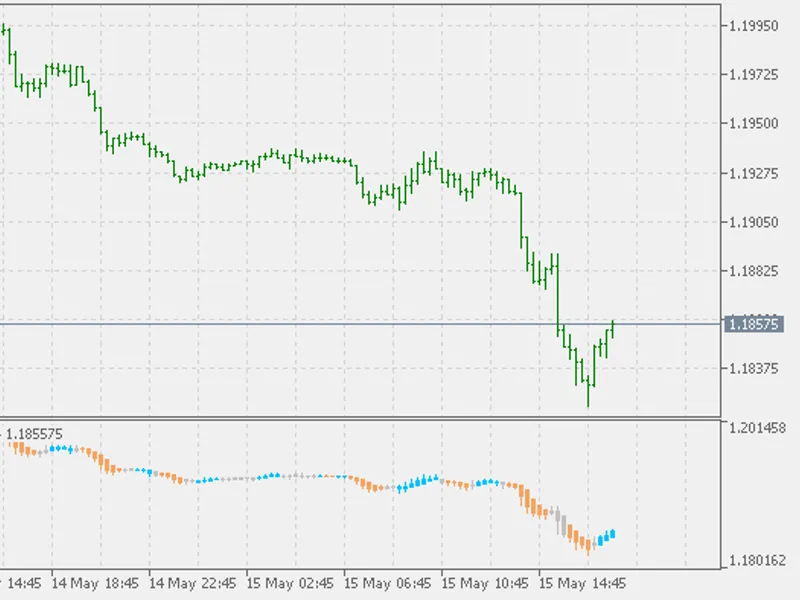
Indicator that calculates dynamic balance point for the desired period.Even though it is a sort of a multi timeframe indicator, it calculates the balance point without usual issues...
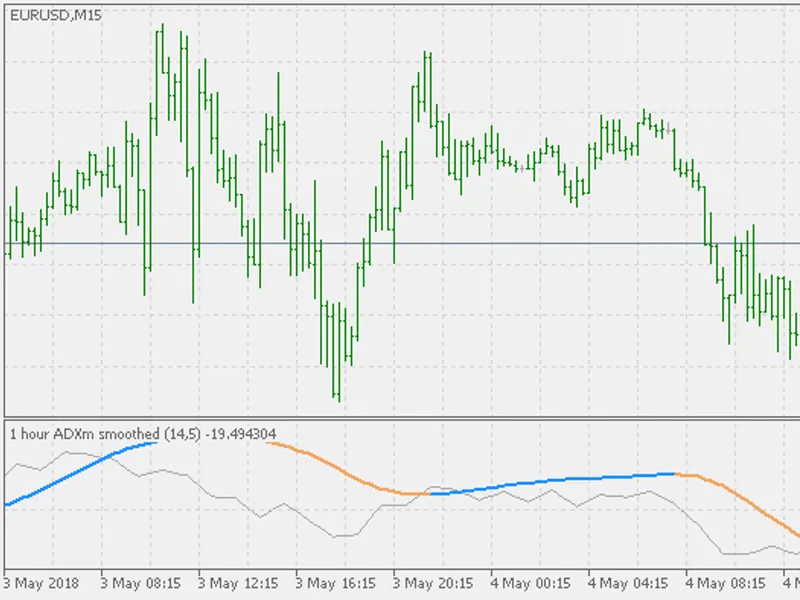
ADXm is a variation of a well known ADX indicator.Unlike the ADX indicator, which is directionless (the value of the ADX itself does not show the direction of the market, but is ju...
ADXm is a variation of a well known ADX indicator.Unlike the ADX indicator, which is directionless (the value of the ADX itself does not show the direction of the market, but is ju...
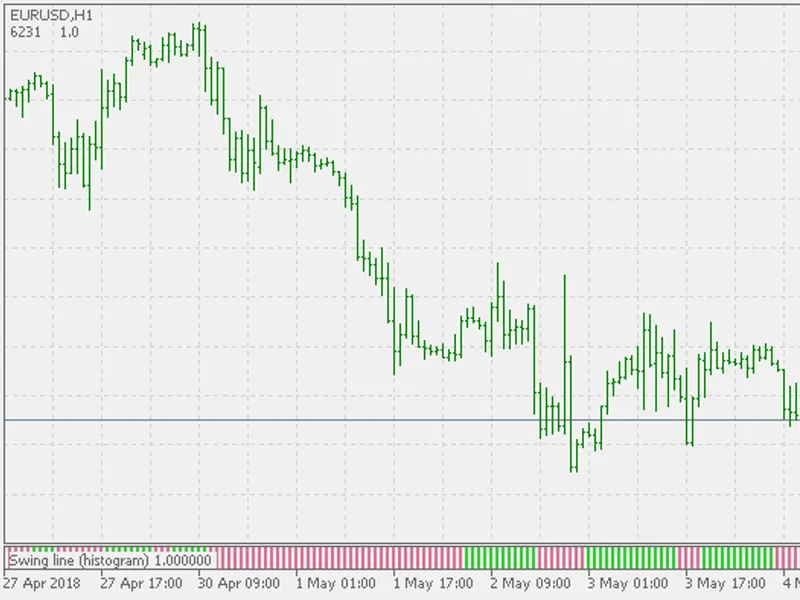
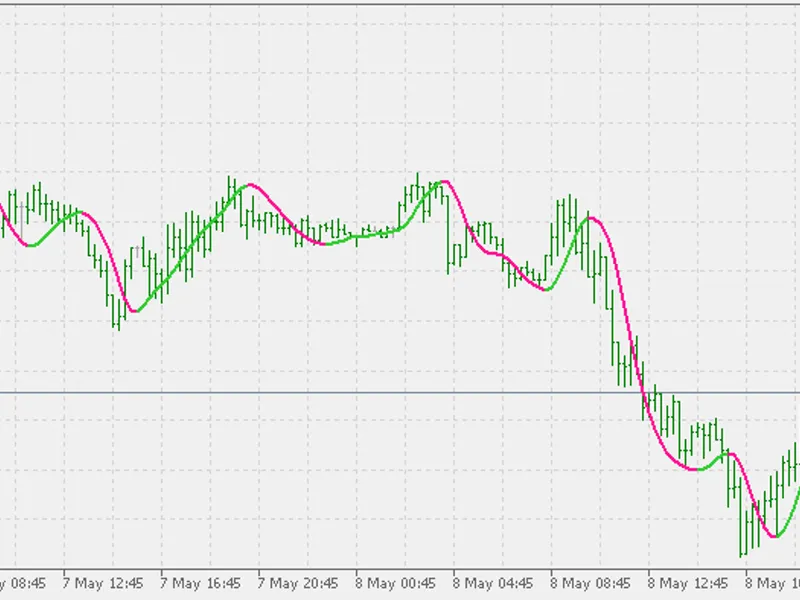
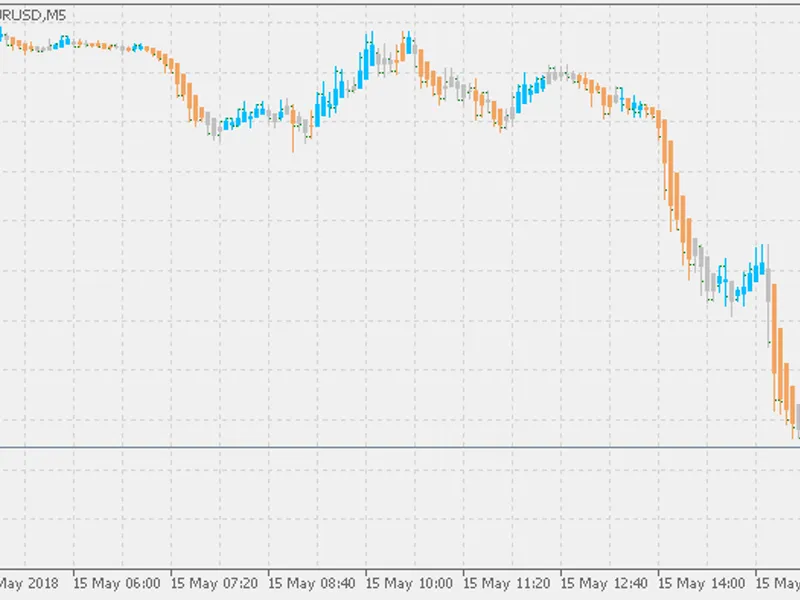
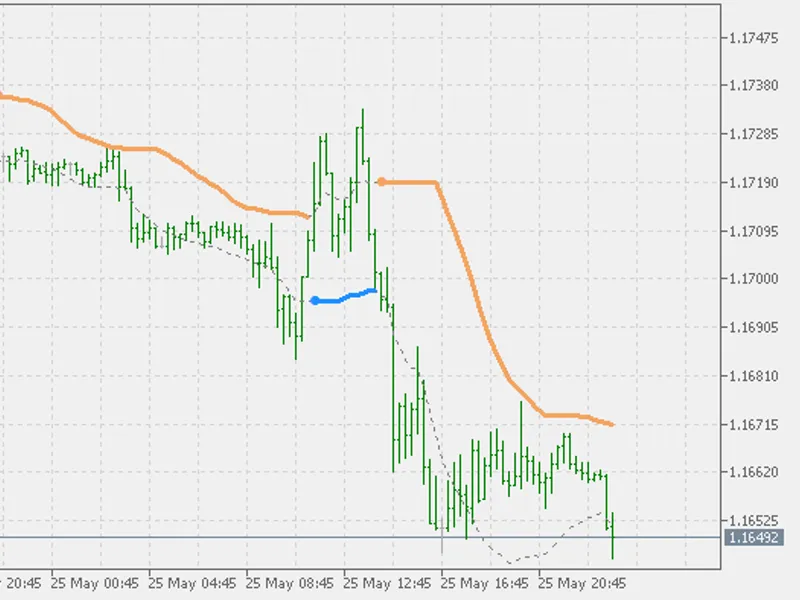
Ron Black's swing line indicator with adjusted display option.You can chose to:Display colored line. Display colored bars. Display colored candles. Let the indicator automatically ...
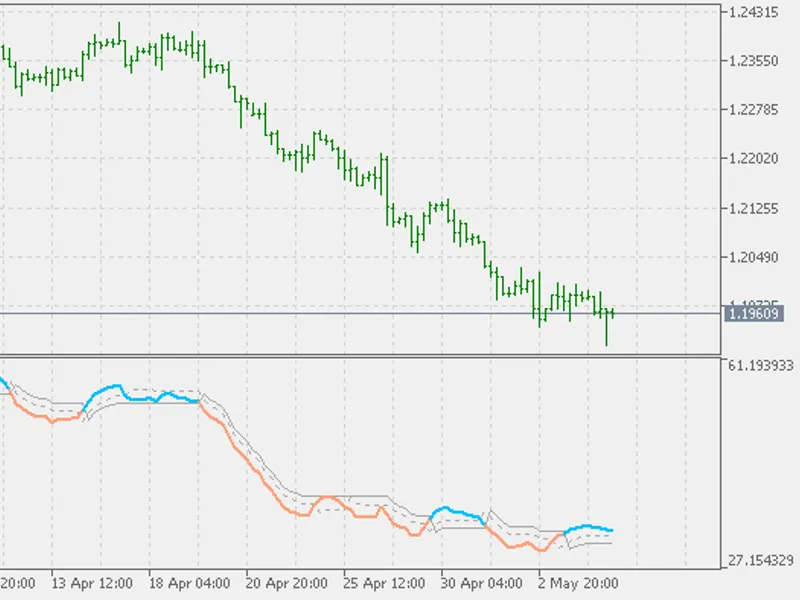
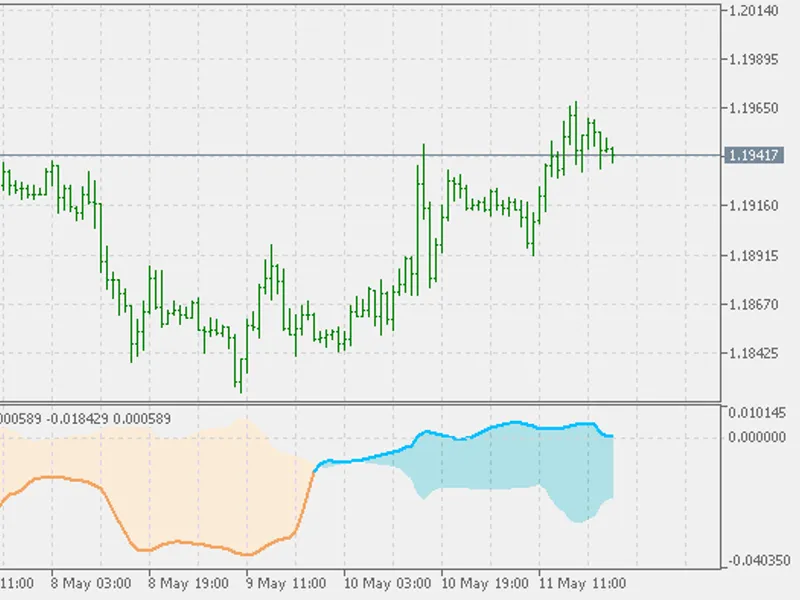
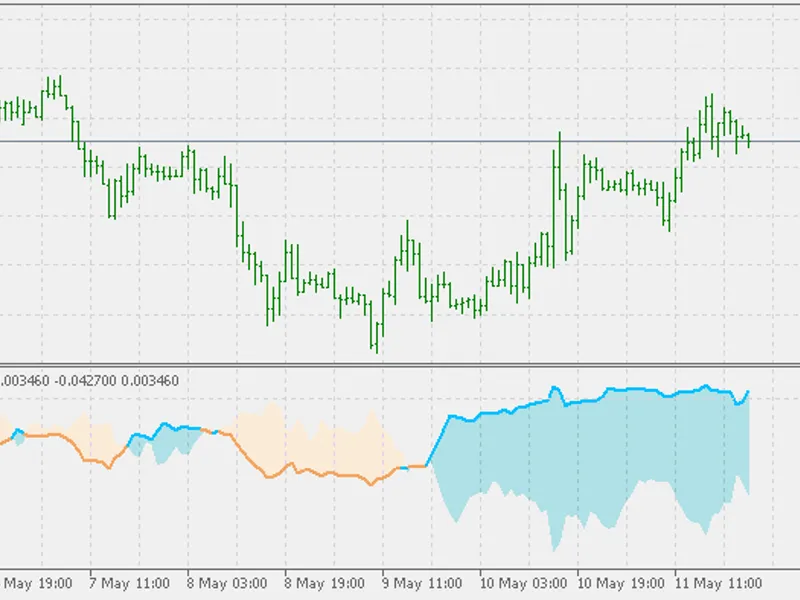
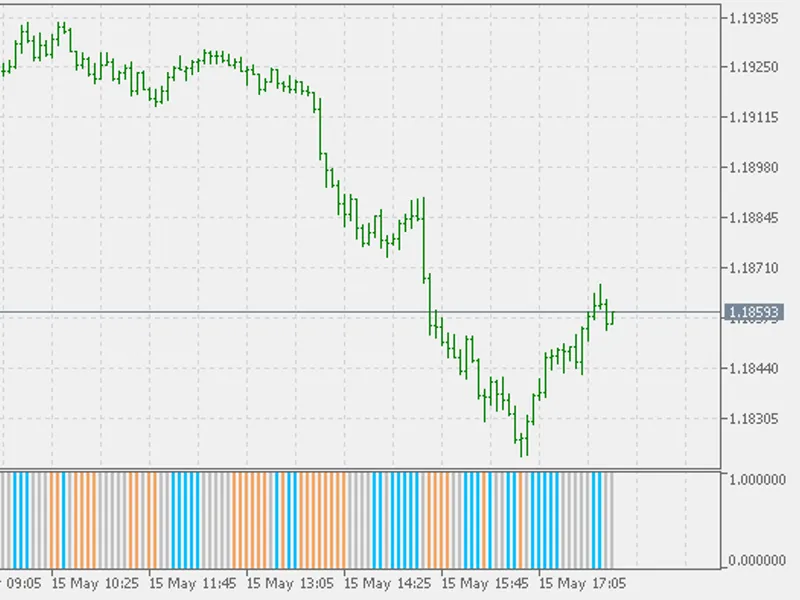
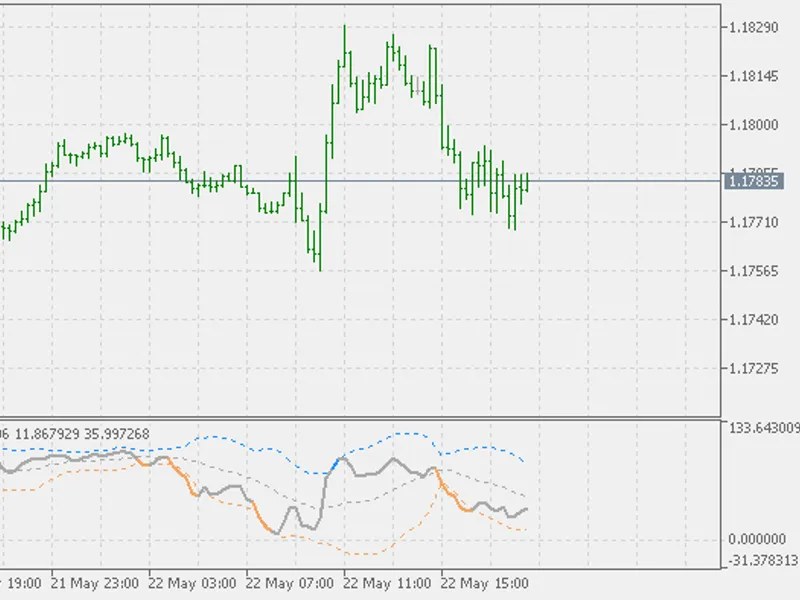
The QQE (Quantitative Qualitative Estimator) indicator consists of a smoothed Relative Strength Index (RSI) indicator and two volatility-based trailing levels (fast and slow).The F...
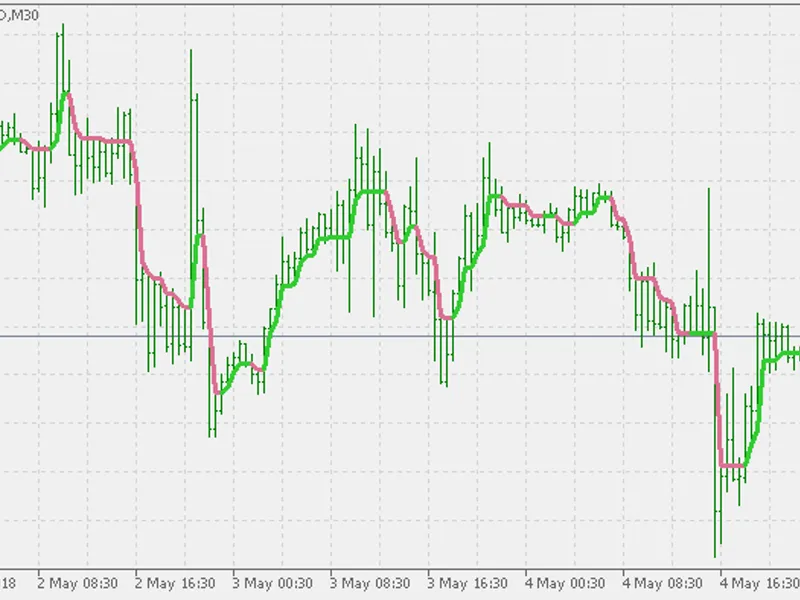
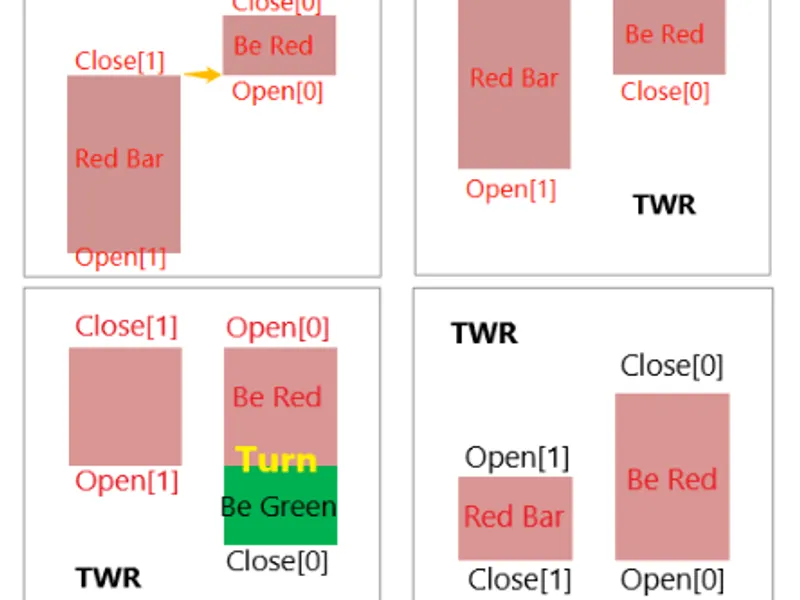
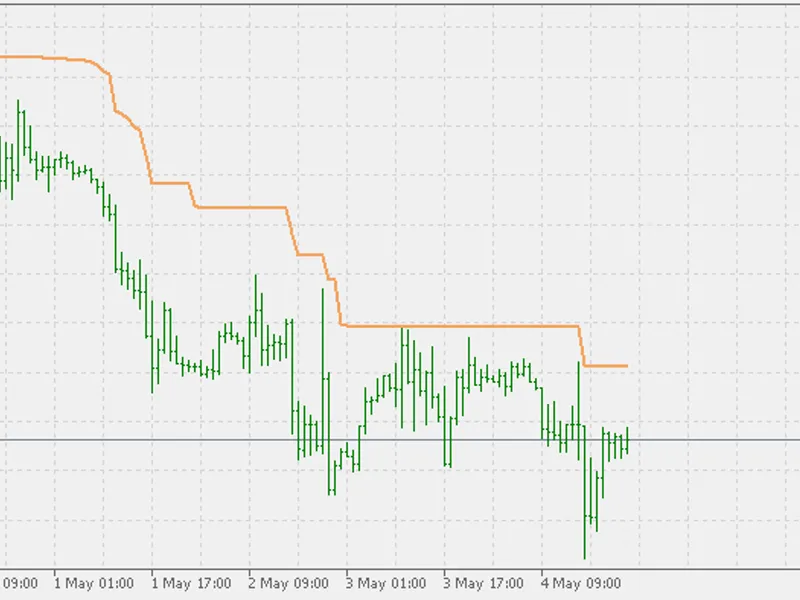
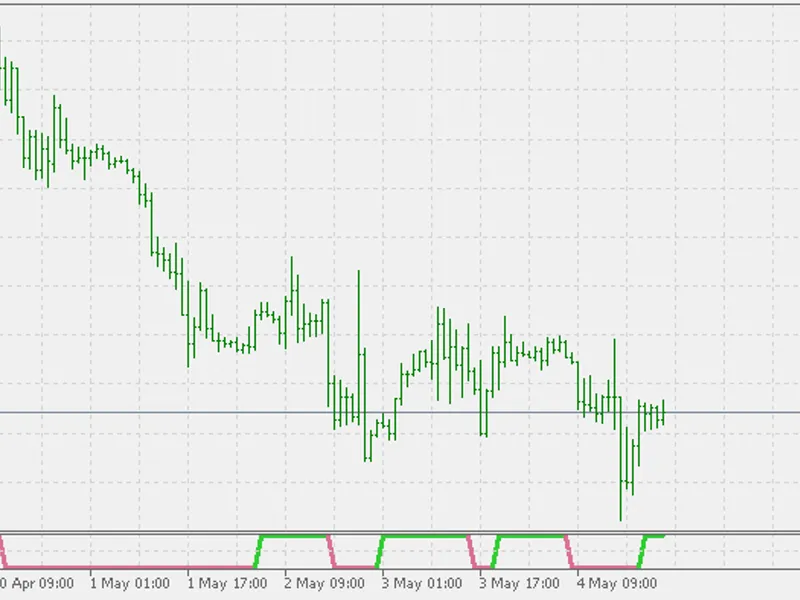
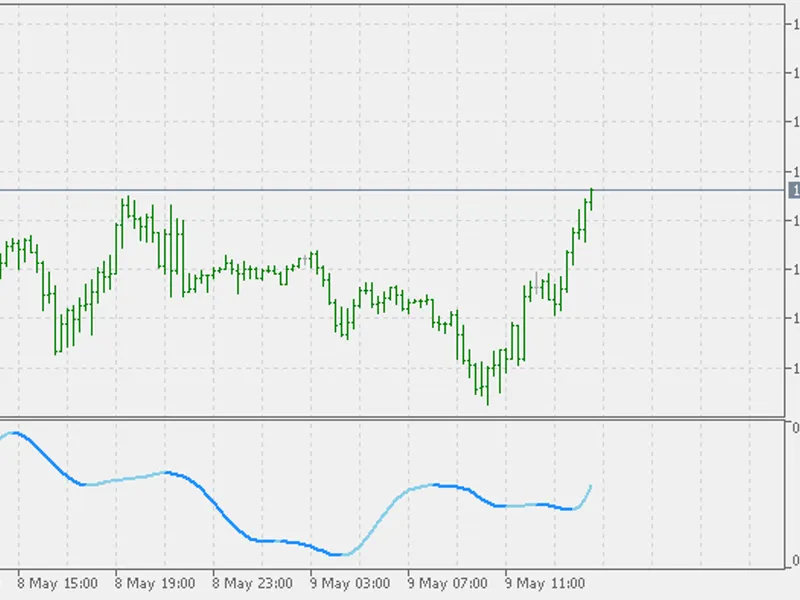
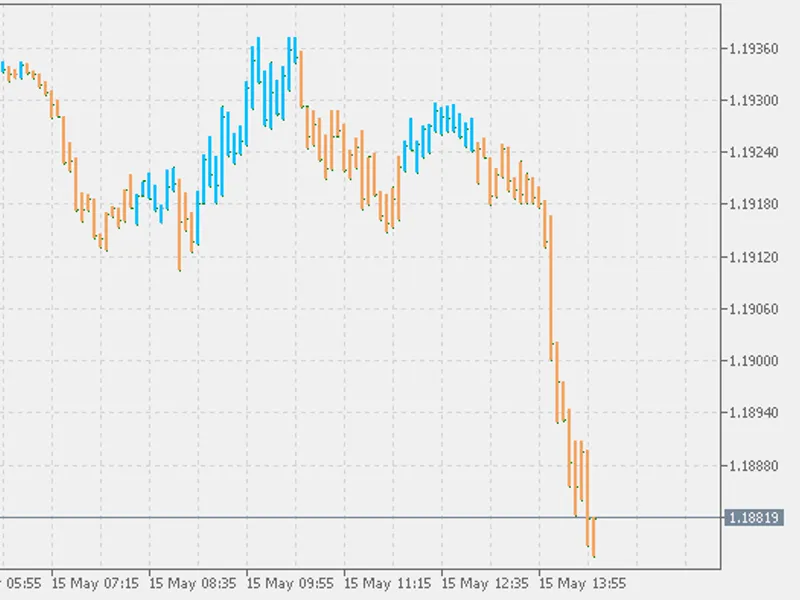
TWR is calculated based on the color of the previous bar and the closing price of the current bar, ignoring the other price information, and actually redrawing the candle chart usi...
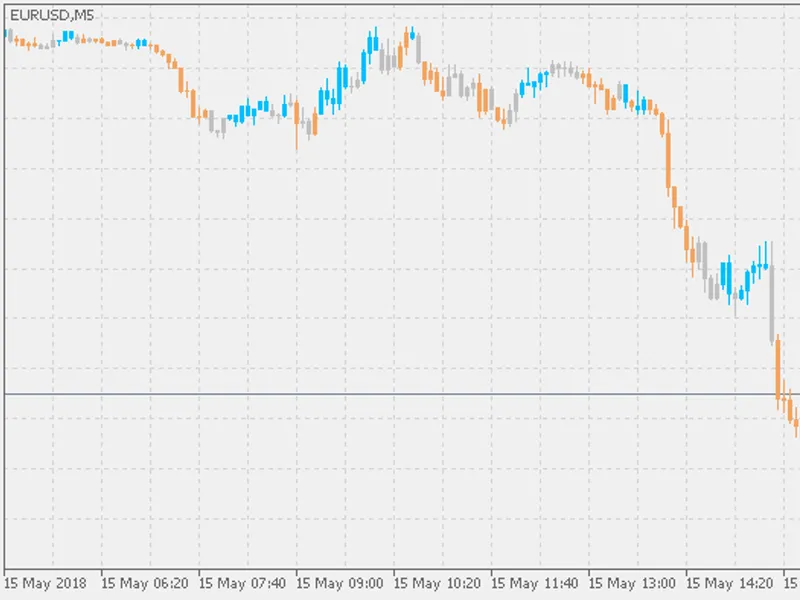
Ron Black's Swing Line indicator with only two states displayed:State up. State down. Since it is using only two states, it is suitable for simple usage from Expert Adviser(s)....
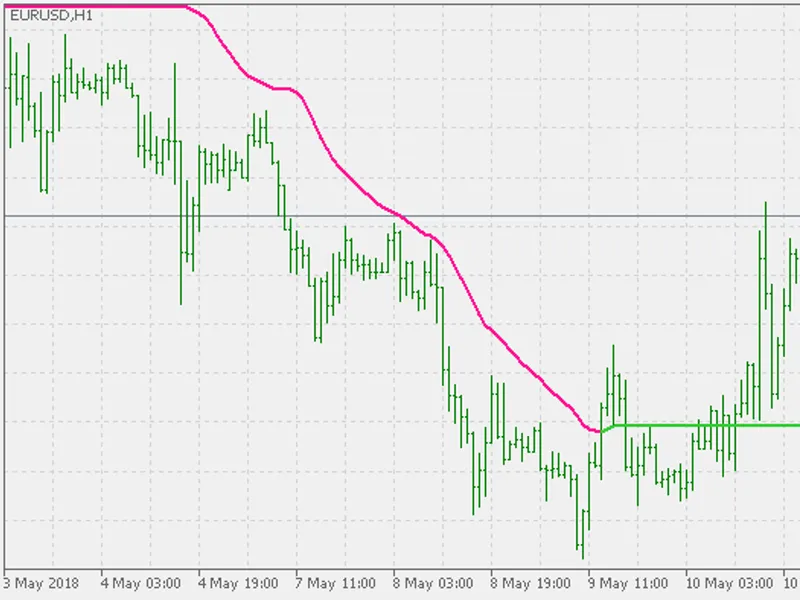
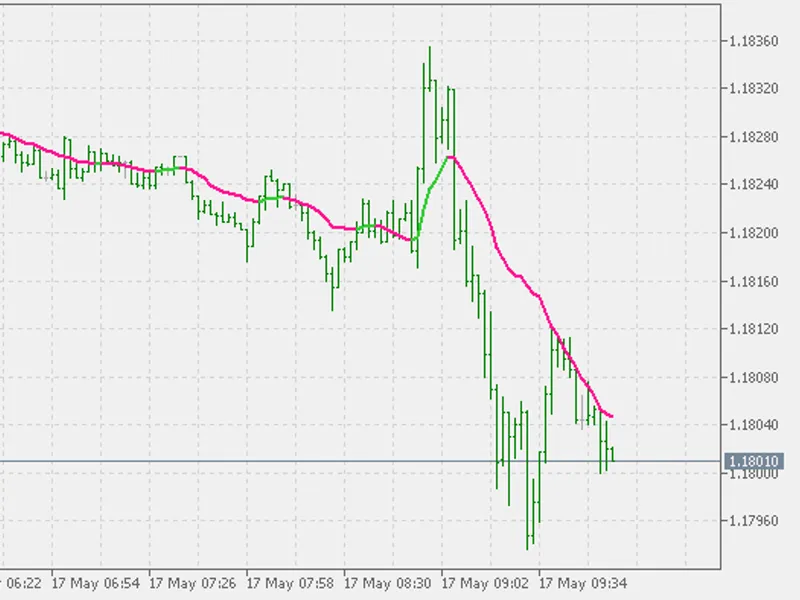
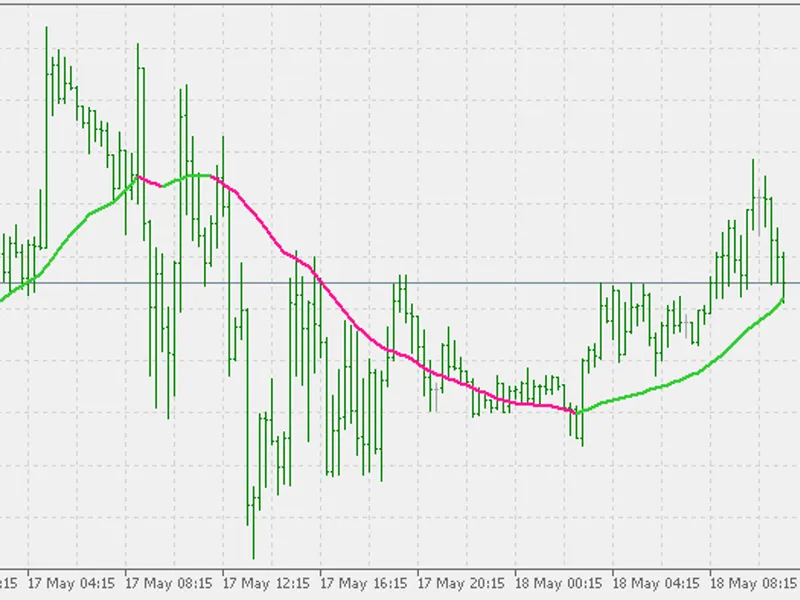
The Hull Moving Average (HMA), developed by Alan Hull, is an extremely fast and smooth Moving Average. In fact, the HMA almost eliminates lag altogether and manages to improve smoo...
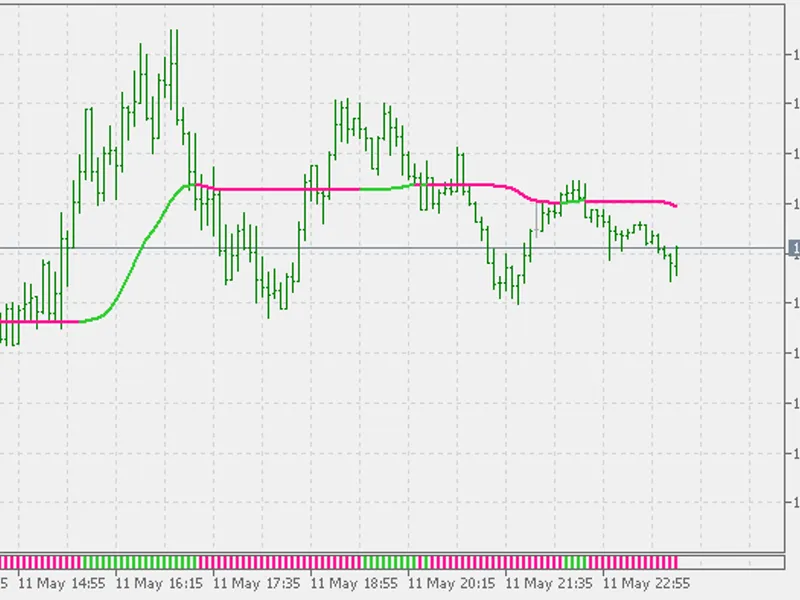
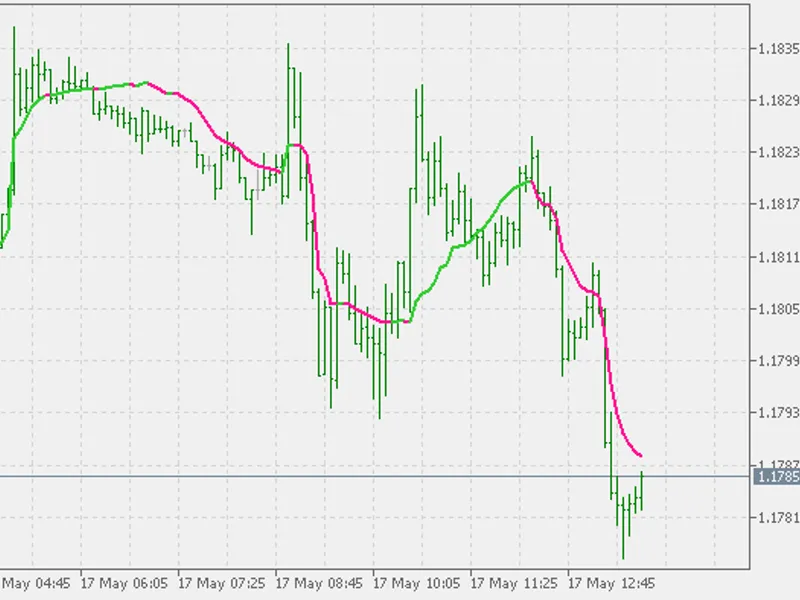
T3 is a very well known indicator. It is smooth and it is fast.But it also uses the "zero lagging" method to make it even faster and to keep the smoothness. This is the Zero lag T3...
The original idea came from Bob Fulks and Alex Matulich (they are the ones that improved the original Tim Tillson T3 calculation).The calculation is not a Standard Deviation smooth...
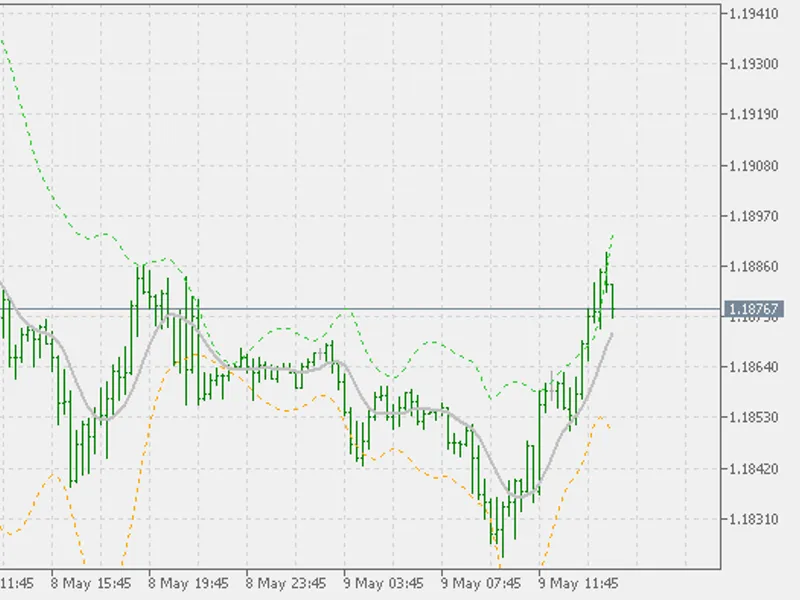
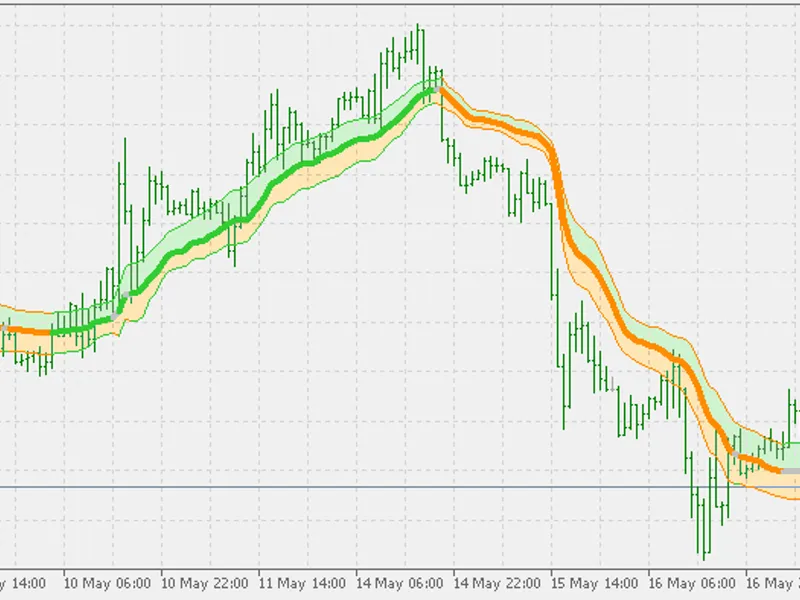
Variation of the well known Bollinger Bands indicator.Instead of using SMA for the central value of the bands, T3 is used. Also, instead of using standard deviations for upper band...
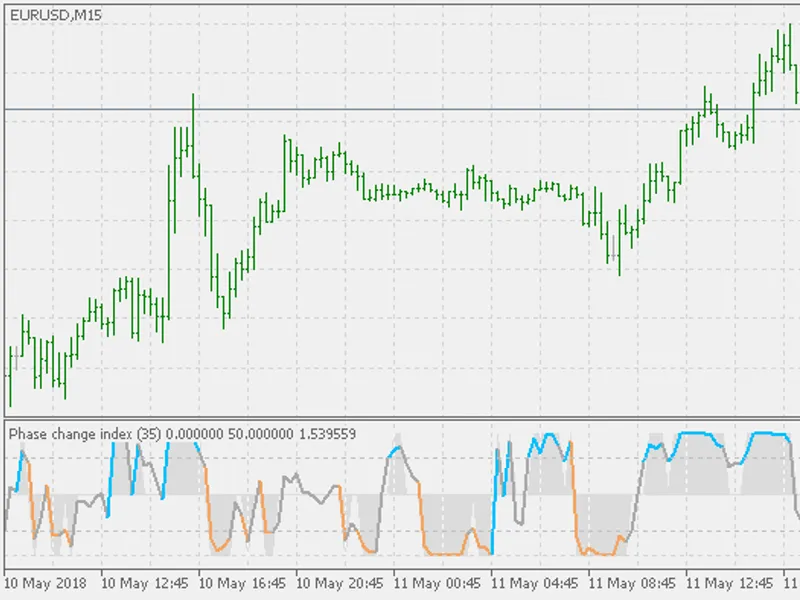
Based on the M.H. Pee's TASC article "Phase Change Index".Prices at any time can be up, down, or unchanged. A period where market prices remain relatively unchanged is referred to ...
Indicator based on M.H.Pee's article "Just How Long Will A Trend Go On? Trend Continuation Factor".Because trends are an important component of the market, it is imperative you can...
Indicator based on M.H.Pee's article "Just How Long Will A Trend Go On? Trend Continuation Factor".Because trends are an important component of the market, it is imperative you can...
ADXVMA is one new sort of a Moving Average.It uses modified ADX calculation for adapting Moving Average calculation. The process of adapting is so efficient that it filters out a l...
ADXVMA is one new sort of a Moving Average.It is using modified ADX calculation for adapting Moving Average calculation. The process of adapting is so efficient that it filters out...
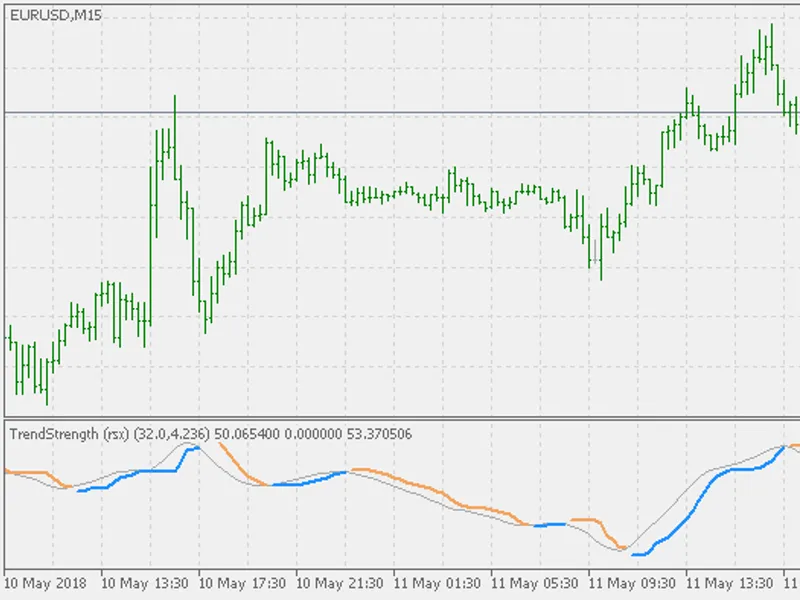
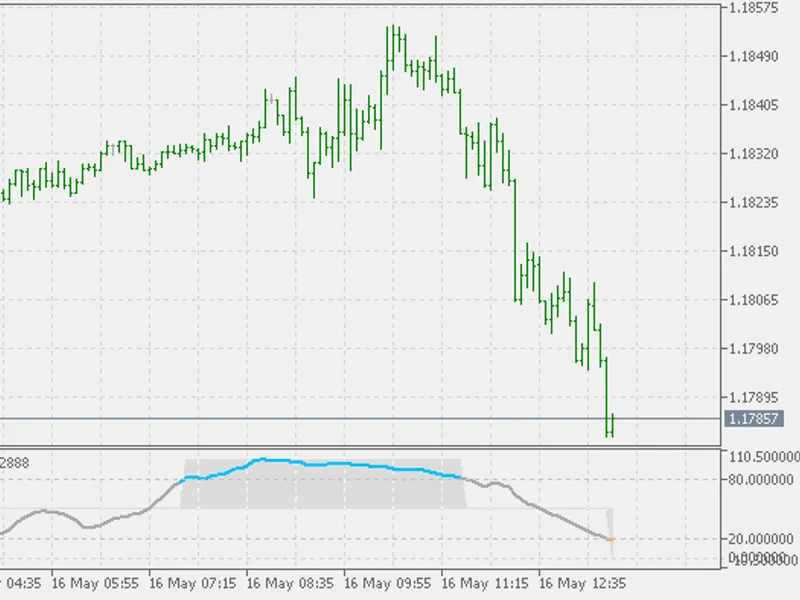
Trend strength assessment based on RSX.The purpose of the "trend strength" is to try to determine when the change of some other indicator is significant enough to make it a trend. ...
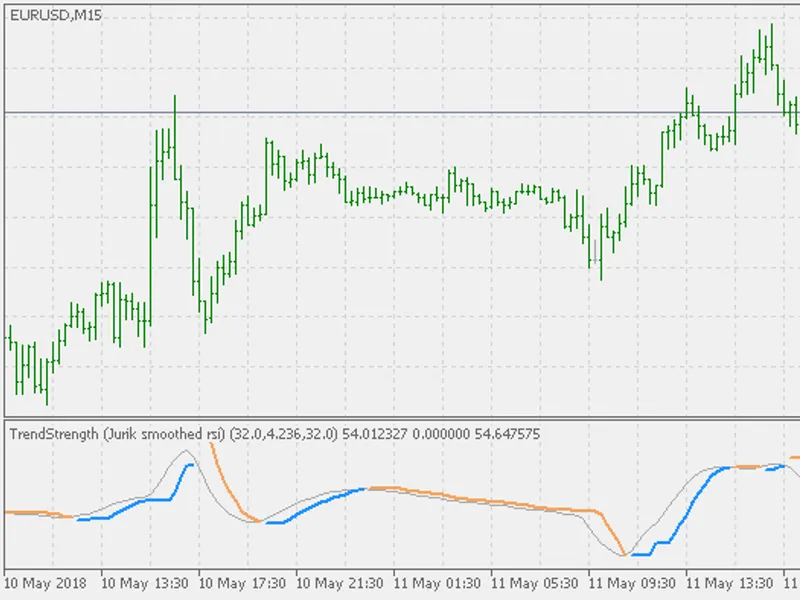
Trend strength assessment based on Jurik smoothed RSI.The purpose of the "trend strength" is to try to determine when the change of some other indicator is significant enough to ma...
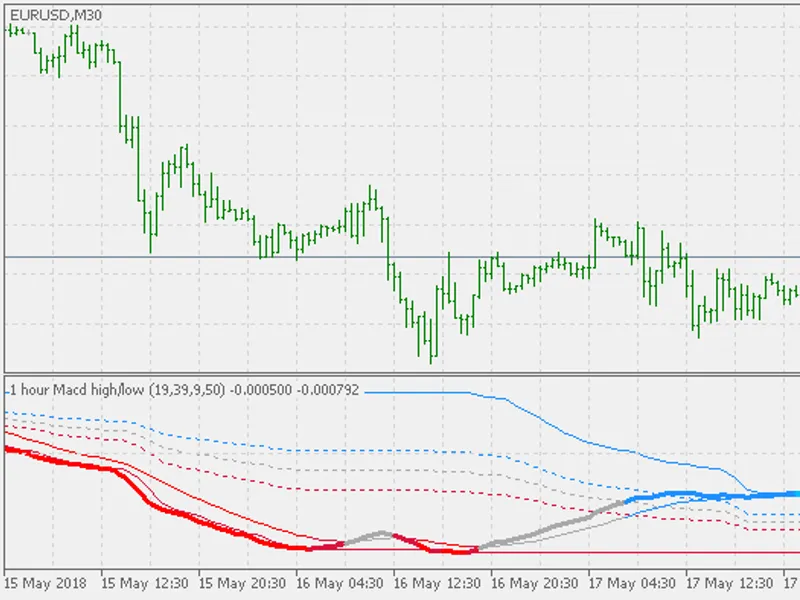
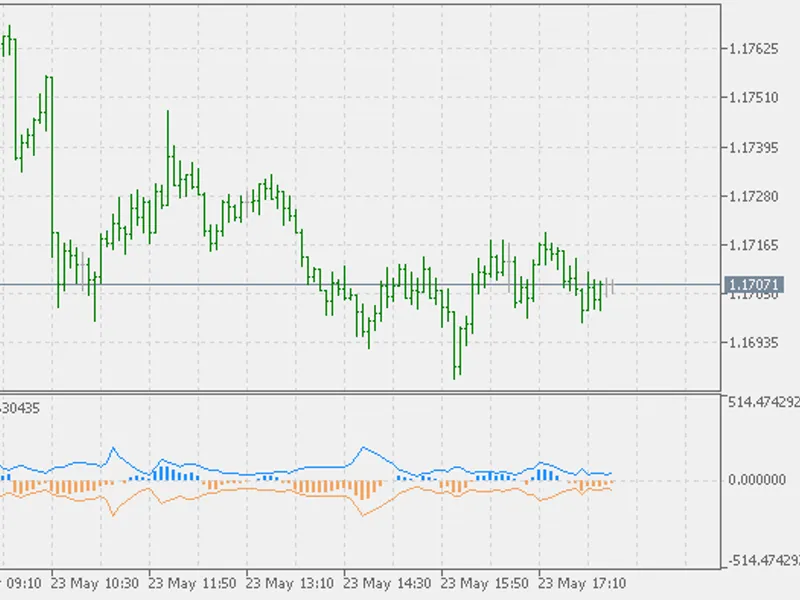
This is the Leader of the MACD as described by Giorgos E. Siligardos. In short, in this indicator there are 2 indicators in 1. There are a regular MACD (which is drawn as lines (co...
Heiken Ashi Zone Trade indicator is based on 3 indicators:Heiken Ashi. Accelerator Oscillator. Awesome Oscillator. The combined states and values of the 3 are producing zones and t...
Heiken Ashi Zone Trade - Separate indicator is based on 3 indicators:Heiken Ashi. Accelerator Oscillator. Awesome Oscillator. The combined states and values of the 3 are producing ...
The indicator was described by B. Williams as fourth dimension - Trading Zone:If the current bars of AC and AO are trending up, it shows that the zone is up If the current bars of ...
The indicator was described by B. Williams as fourth dimension - Trading Zone:If the current bars of AC and AO are trending up, it shows that the zone is up. If the current bars of...
John Ehlers is known for making a lot of new tools for technical analysis. Here is one more.According to Ehlres:These filters provide extraordinary smoothing in sideways markets an...
This is the "zone" indicator using for calculation."Zone" is calculated using High, Low and Median price in order to attempt to assess the trend of the current chart instrument. Fo...
Indicator based on the .Instead of displaying average line, it displays colored bars on the chart and that way helps in assessment of the current trend. Since NonLag MA is very fas...
indicator made as multi timeframe.Timeframes supported are all the possible timeframes supported by MetaTrader 5 and it has 3 "special" timeframes:Next higher timeframe: first high...
made multi timeframe.Timeframes supported are all the possible timeframes supported by MetaTrader 5 and it has 3 "special" timeframes:Next higher timeframe: first higher timeframe ...
Timeframes supported are all the possible timeframes supported by MetaTrader 5 and it has 3 "special" timeframes:Next higher timeframe: first higher timeframe compared to active ch...
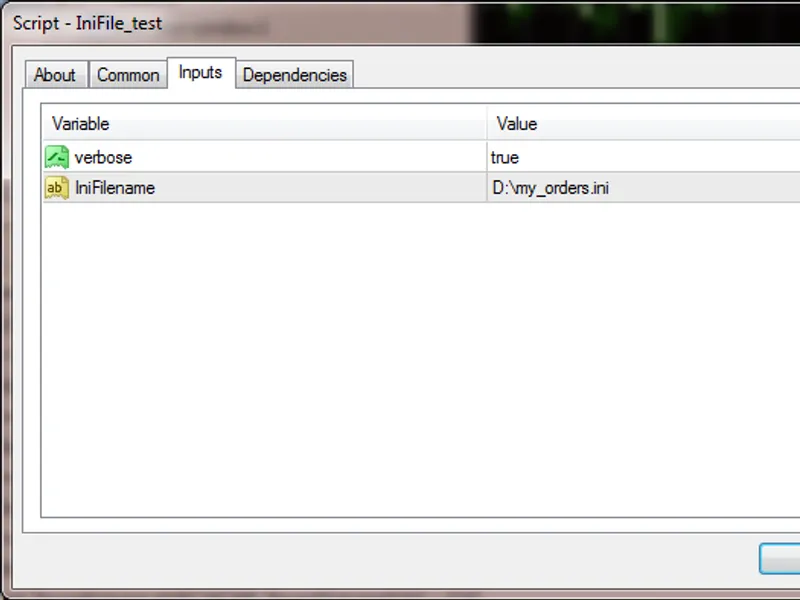
Handy functions for comparison of doubles Handy functions for rounding of doubles Miscellaneous handy functions for doubles Handy functions for low-level binary operations on doubl...
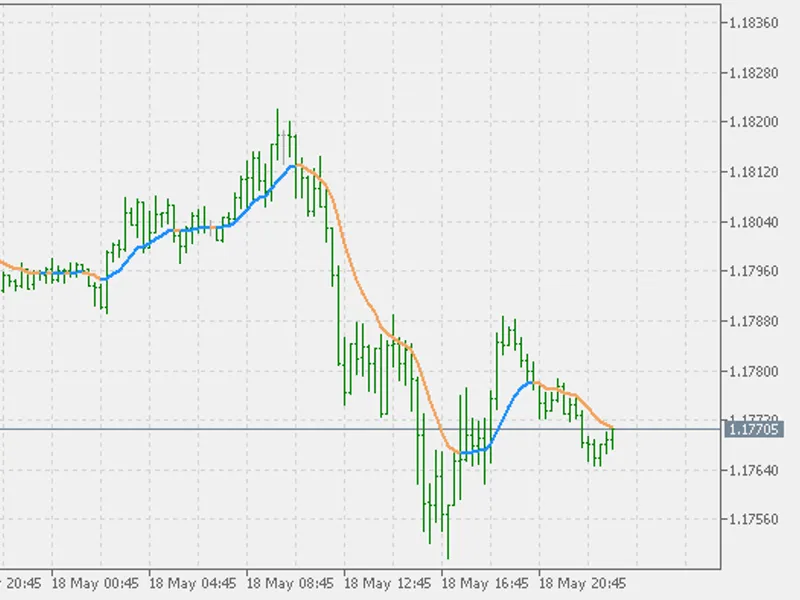
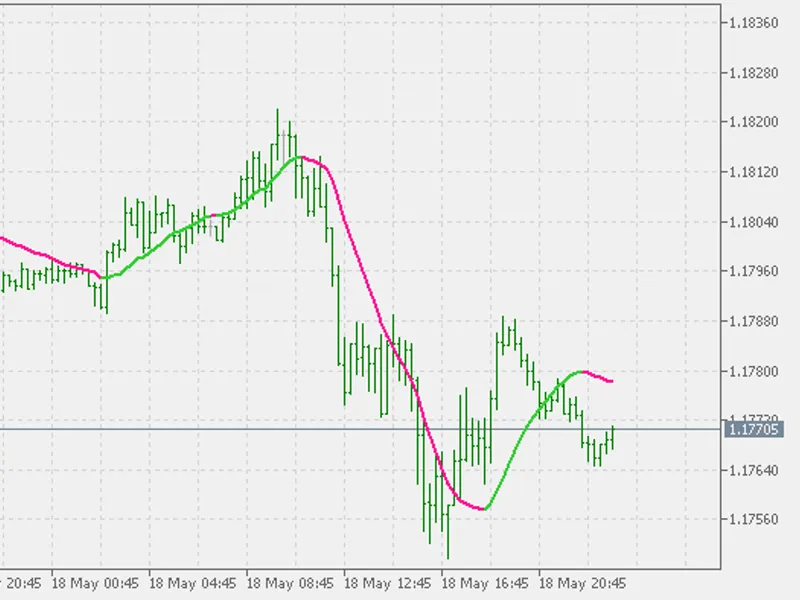
A set of 4 types of digital filters that naturally are placed on main chart.The supported digital filter types:FATL- Fast Adaptive Trend Line.SATL- Slow Adaptive Trend Line.RFTL- R...
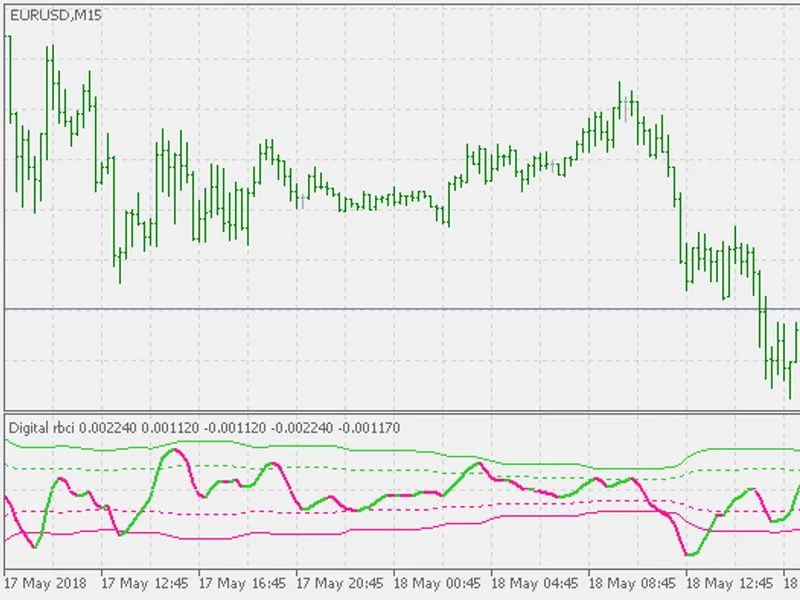
A set of digital filters that are always drawn in separate window (due to their nature).Supported types are:FTLM- Fast Trend Momentum.STLM- Slow Trend Momentum.RBCI- Range Bound Ch...
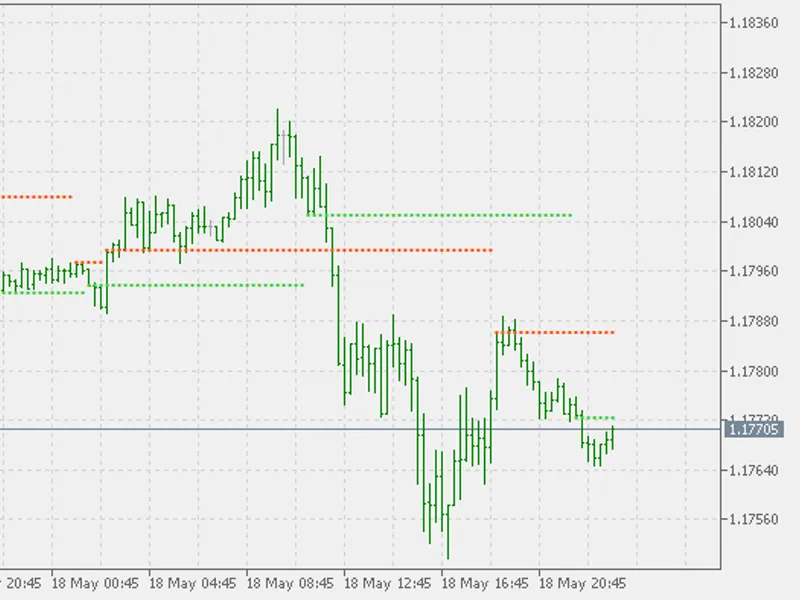
WPR (Williams Percent Range) based support/resistance.When WPR significant level (adjustable in parameters) is broken, then the indicator starts a new support or resistance on the ...
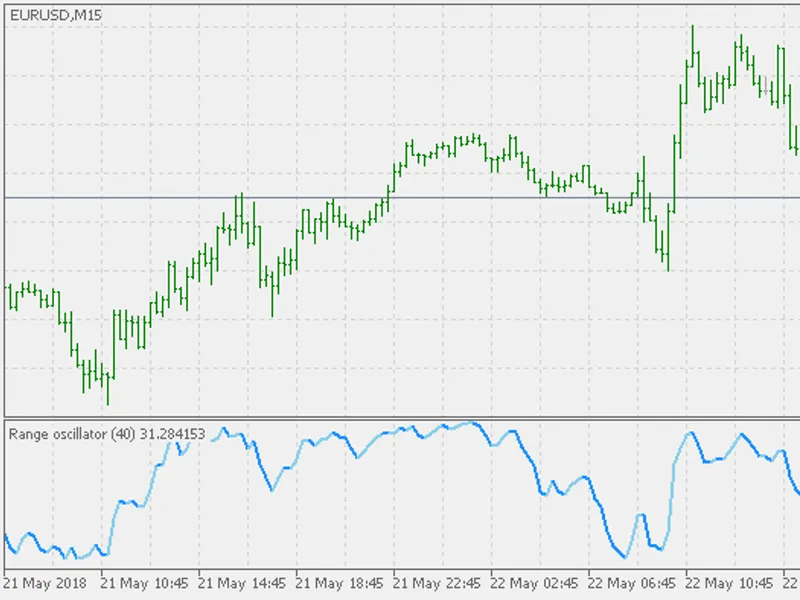
Indicator that is similar to "raw" Stochastic and Williams Percent Range.Range Oscillator is an indicator that shows the relative position of median price in the highest high to lo...
The indicator is mainly intended to show the trend of the market. But, using the levels (that are dynamic - they depend on the market changes), you can use it to assess overbought ...
As described in the May 2018 edition of Technical Analysis of Stocks & Commodities by John F. Ehlers. This indicators is an enhancement to the traditional RSI for detecting cyc...
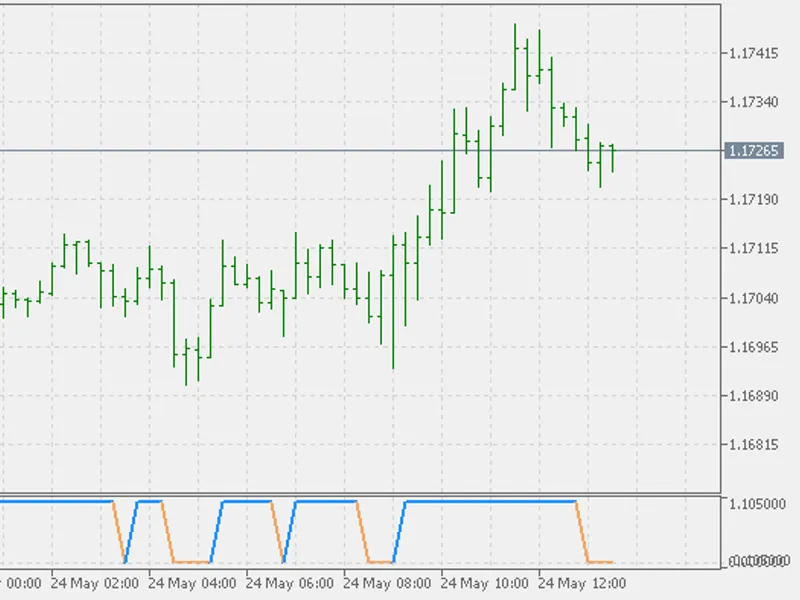
It shows only two states:state up. state down. That makes it suitable for cases when a simple access to indicator values is required (like from experts)....
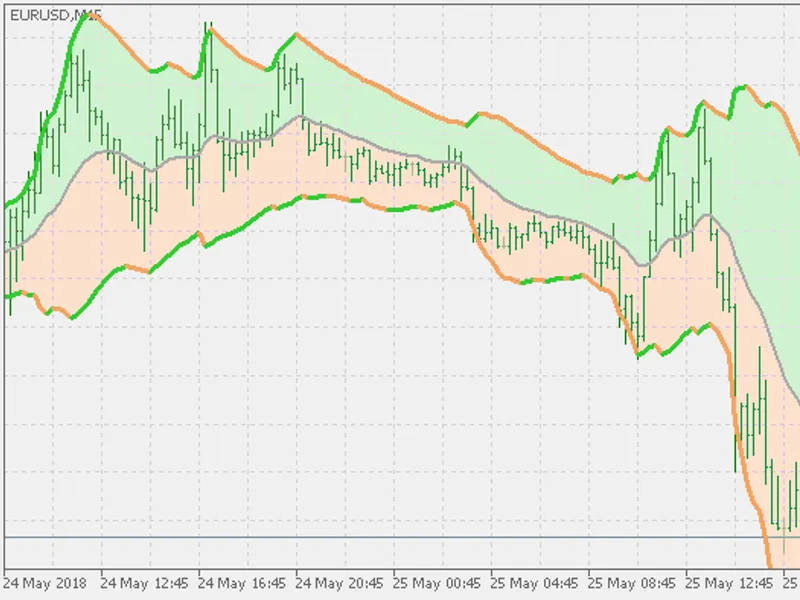
Bollinger Bands consist of a N-period Moving Average (MA), an Upper Band at K times an N-period standard deviation above the Moving Average (MA + Kσ), and a Lower Band at K times a...
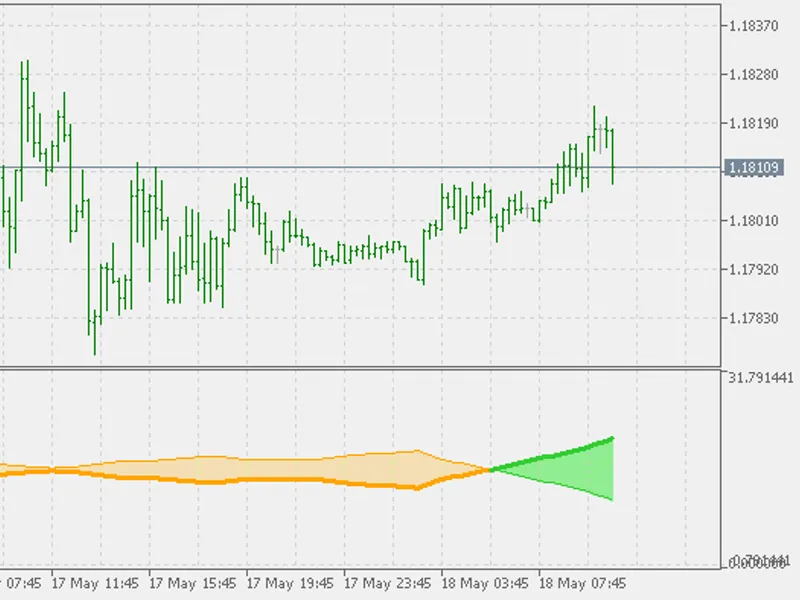
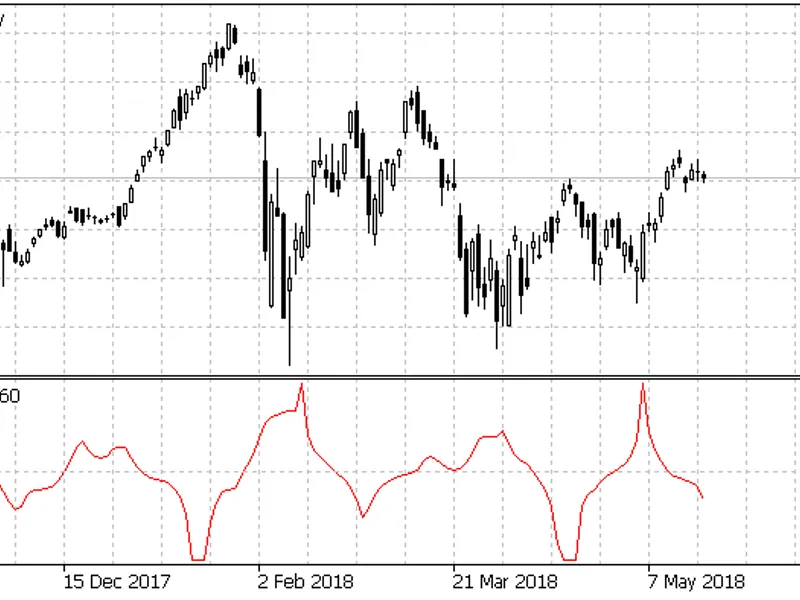
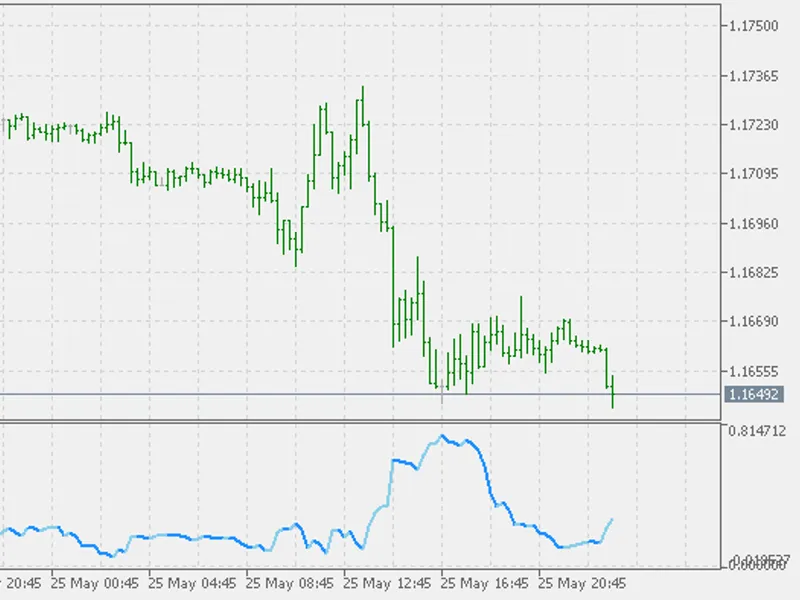
The Synthetic VIX indicator is based on Larry Williams' TASC article "Fix the VIX":PS: Synthetic VIX is not a directional indicator. It indicates the increase or decrease of volati...