Chandes Quick Stick (Qstick)
This is a powerful addition to your MetaTrader 5 toolkit designed to optimize market analysis and performance. This technical indicator acts as a specialized analysis tool designed to visualize market data. It helps traders identify emerging trends, momentum shifts, and key support or resistance levels by plotting statistical calculations directly onto price charts.
How to Setup and Use Chandes Quick Stick (Qstick)
1. Installation: Place your file in the MQL/Indicators folder via "Open Data Folder" and restart your terminal.
2. Loading: Find the indicator in the Navigator, drag it onto your chart, and configure the input parameters in the popup window.
3. Customization: Press Ctrl+I to open the indicator list, select your tool, and click "Properties" to change colors, levels, or visual styles.
4. Updating: Replace the old file in the Indicators folder with the new version and restart the platform to apply changes.
Frequently Asked Questions
Q: Why is my indicator not showing? A: Verify the file is in the MQL/Indicators folder, or try right-clicking the "Indicators" tree in the Navigator and clicking "Refresh."
Q: Do custom indicators slow down the platform? A: Too many complex indicators can impact performance; remove unused ones via the "Indicator List" (Ctrl+I).
Q: Can I use MT4 indicators on MT5? A: No, MQL4 and MQL5 are distinct languages; ensure the indicator is compiled specifically for your platform version.
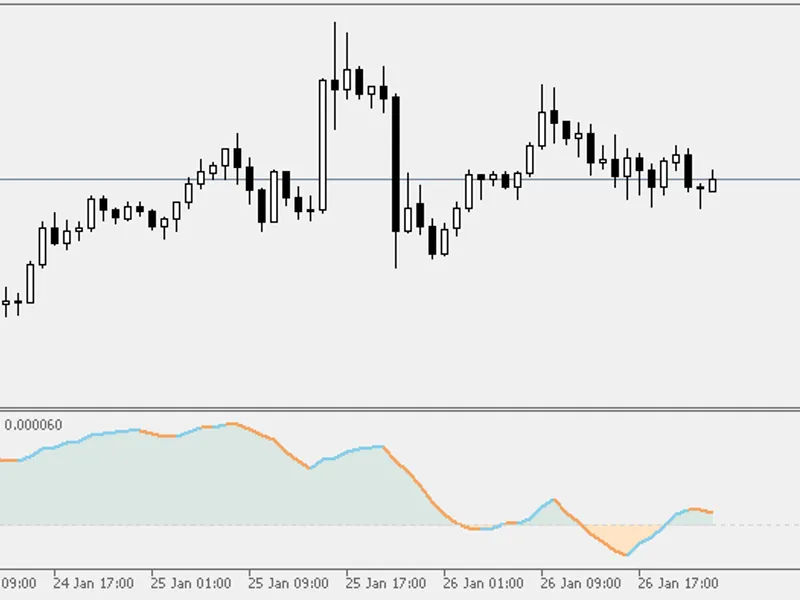
Description & Settings
In case the Qstick indicator shows a reading below zero, this is indicative that the majority of candlesticks during the examined period are bearish, thus, the bias for the trading instrument is bearish.
In case the Qstick indicator shows a reading above zero, this is indicative that the majority of candlesticks during the examined period are bullish, thus, the bias for the trading instrument is bullish.
There are several ways, in which the Qstick can generate trading signals:
Crossings over the zero line. If the indicator crosses above zero, this is a signal to buy. If the indicator crosses below zero, this is a signal to sell.
Looking for extreme levels. If the Qstick indicator is at very low level and begin reversing up, this is a signal to buy. If the indicator is at very high level and begin reversing down, this is a signal to sell.
Looking for divergences. If the market is forming lower lows and the Qstick is forming higher lows, this is a bullish divergence and a signal to buy. If the market is forming higher highs and the Qstick is forming lower highs, this is a bearish divergence and a signal to sell.