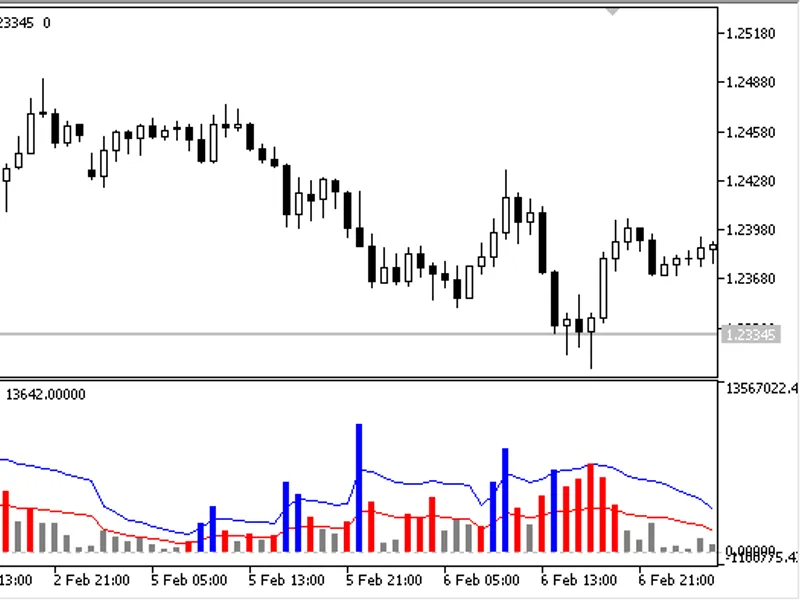
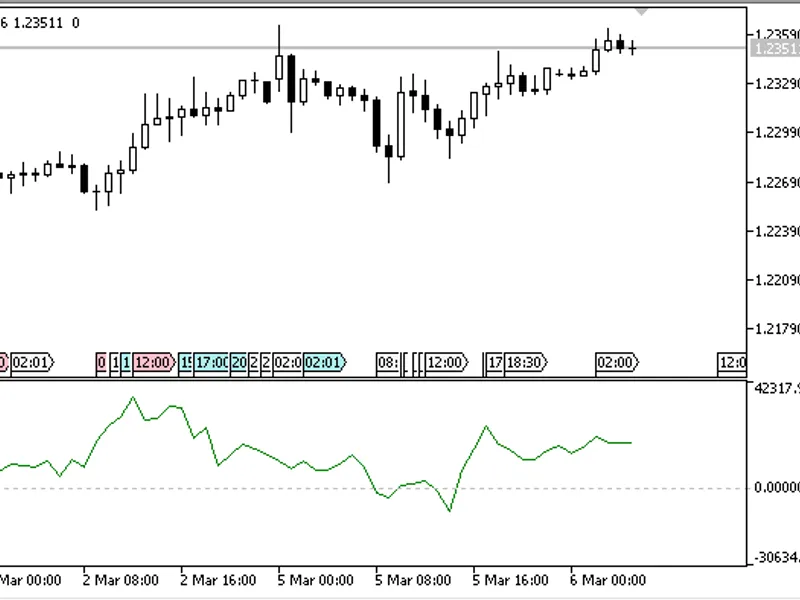
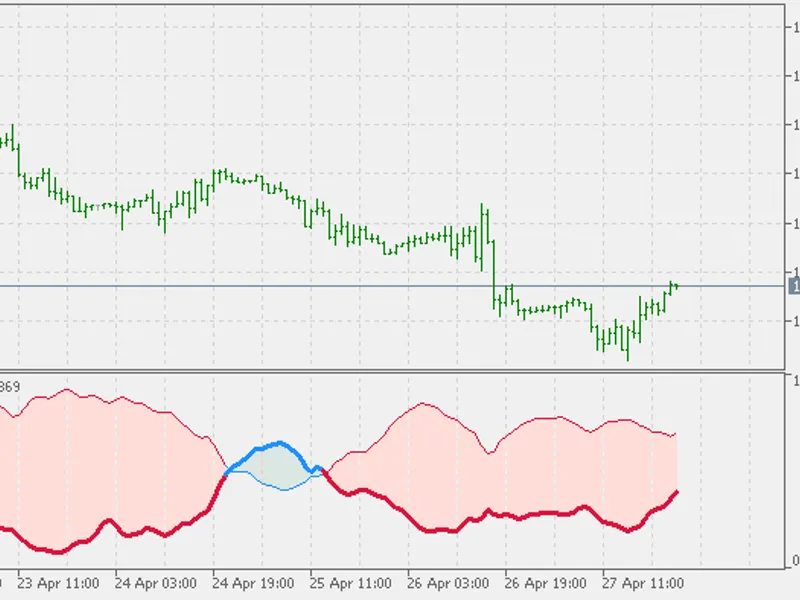
The oscillator indicator draws a histogram (with border levels at two moving averages on the indicator histogram) showing three market states: a trend, a moderate or fading trend a...
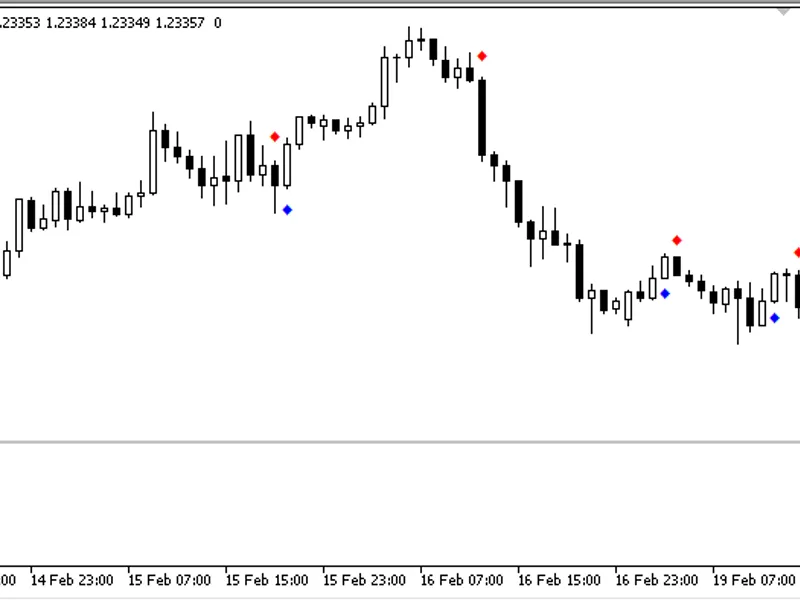
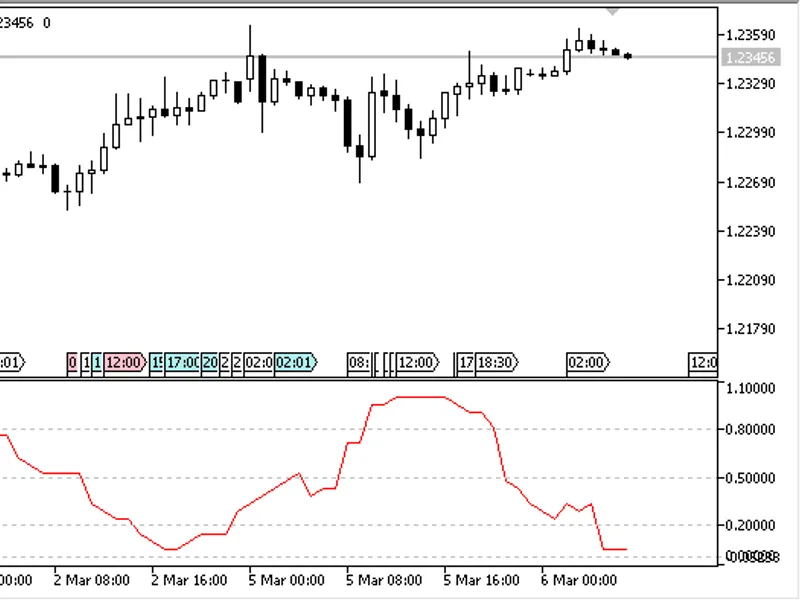
The indicator adds signal marks to a price chart when the indicator crosses its zero line. If CCI crosses the zero line upwards, a dot is added below the candlestick, if downwards ...
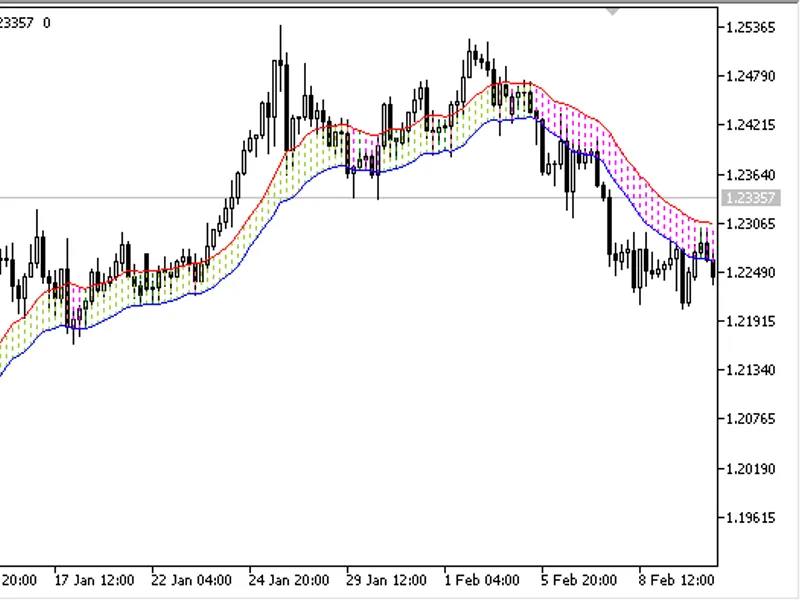
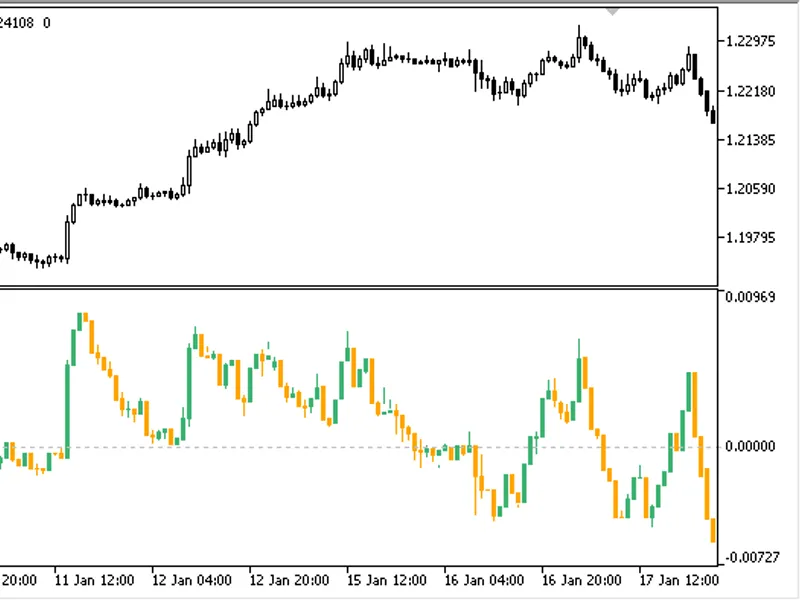
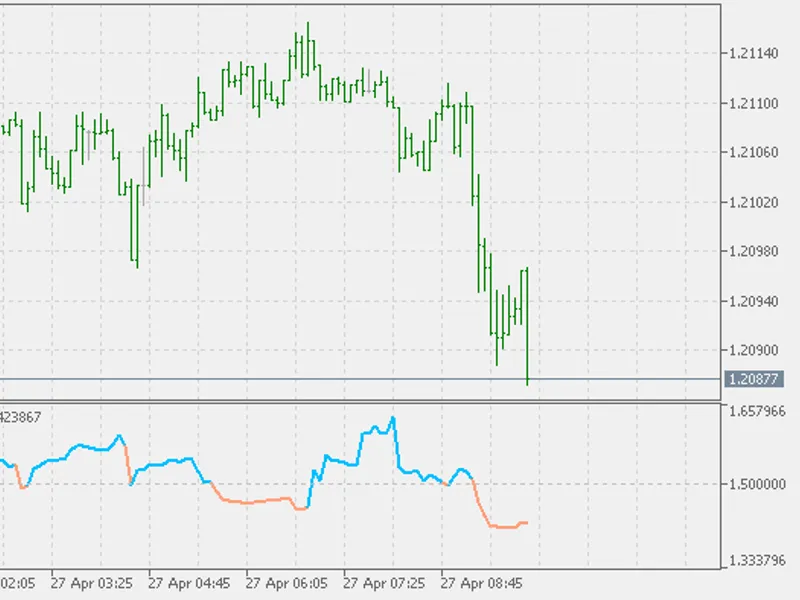
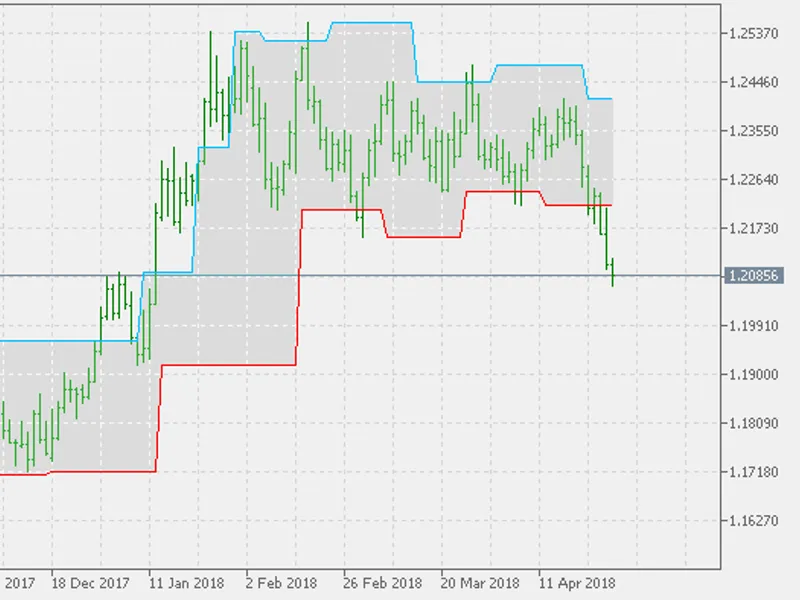
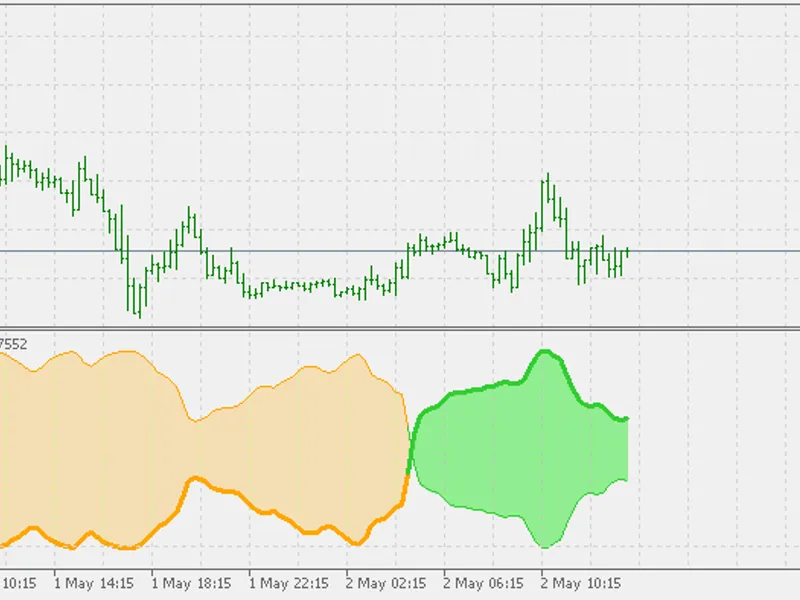
The indicator draws a colored area on a price chart in the form of a histogram between two Moving Averages based on High/Low prices.It has two parameters:MA period- MA calculation ...
Two indicators in one: Momentum and Stochastic:If smoothing is applied, it is an Average Stochastic Momentum (ASM); If not, it is a Stochastic Momentum (SM). The indicator has eigh...
The IDayIIndex (Intraday Intensity Index) oscillator indicator.It is calculated by the following formula:III = Sum((2C-H-L)/(H-L))*TickVolume Normalized:Normalized III = (III /Sum(...
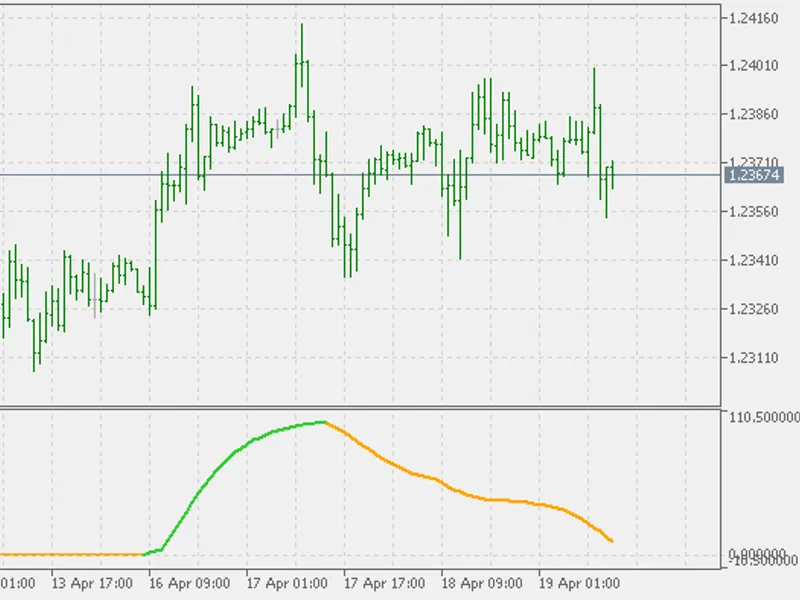
VSI - Volatility Switch Indicator. The indicator measures the current volatility with respect to historical data for the selected period. It allows to evaluate the market state. Th...
This library is a further development of .What's New in ver. 3 The CurrentBarSizeparameter allows setting the size of the current bar (which is calculated as Close-Open); The Prev...
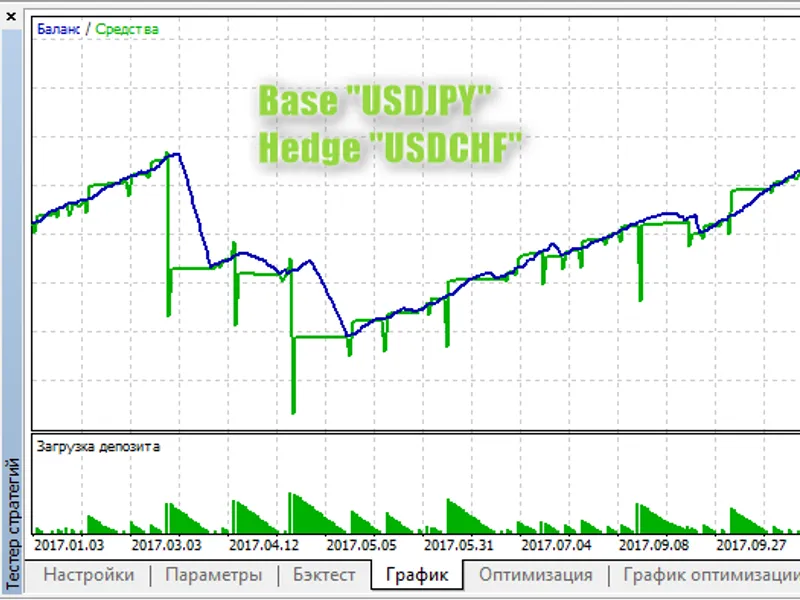
The Expert Advisor opens two opposite positions at the moment of formation of a bar.One of the positions should be closed with Stop Loss, and the other one should close with profit...
It is a semiautomatic Expert Advisor. It opens a position at the intersection of the lines drawn on the symbol chart.Four types of lines are supported Trendline Trendline by Angle...
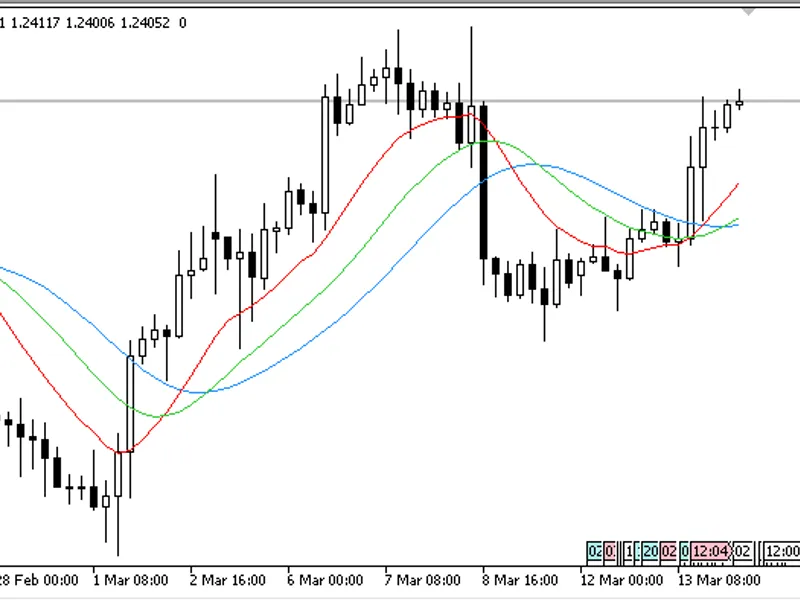
The Expert Advisor trades based on the signals of two iMA (Moving Average, MA) indicators (one of which has a hard coded 'period' parameter set to D1) and one iSAR (Parabolic SAR)....
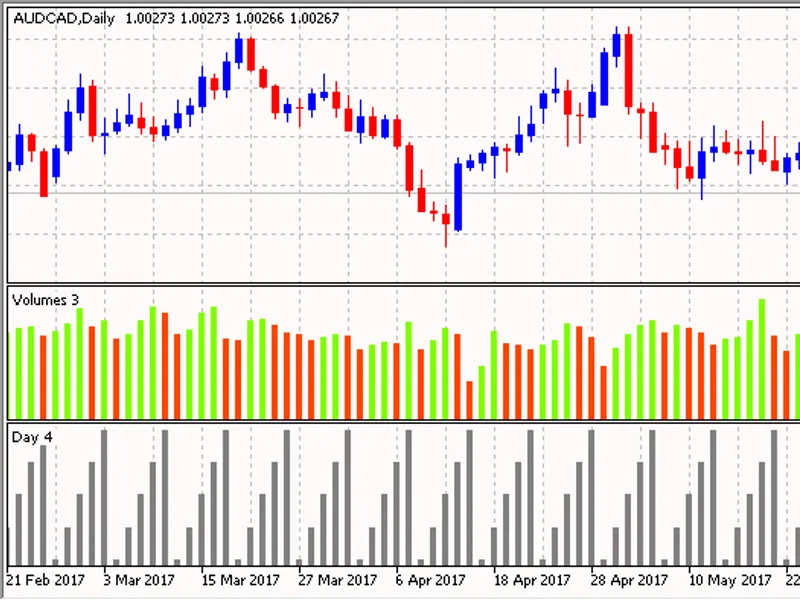
The indicator shows the current day of the week as a histogram. The histogram rule matches the numbering of days in the structure:The "Days of the week" indicator can be applied on...
The Expert Advisor determines the trend based on the last three formed bars.The trader can set time, during which the EA will analyze the previous three bars before that time, and ...
The Expert Advisor places pending Buy Stop and Sell Stop orders.The EA searches through an array of the last 100 bars for the prices to be used for pending orders. The price of the...
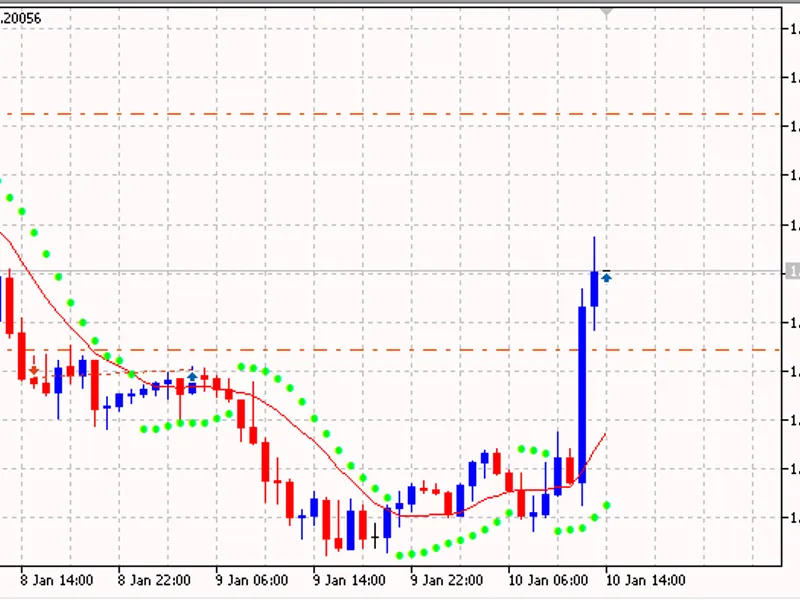
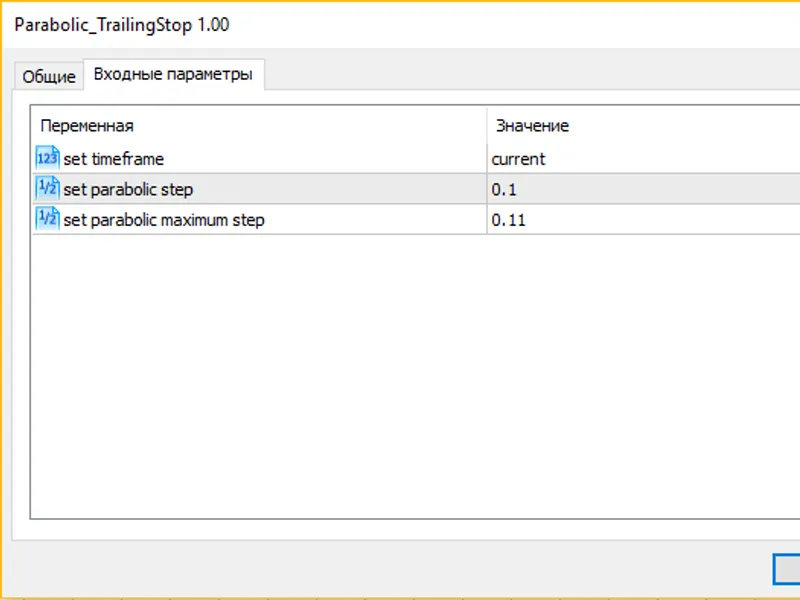
The Stop Loss value of an open position changes when the following conditions are met:The value of Parabolic SAR at index 1 is greater/less than the open price (for buy and sell tr...
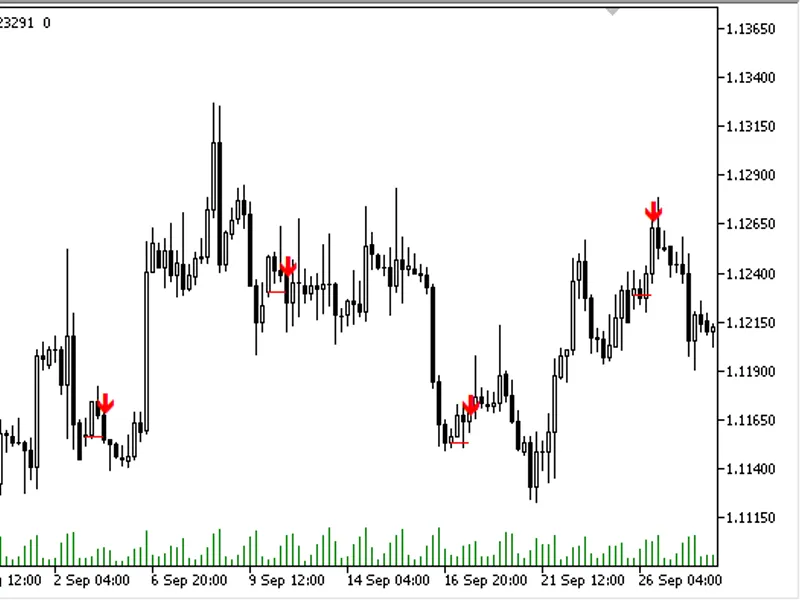
The indicator adds signal arrows on the specified day of the week and time:If the Close price of a candlestick preceding the given one is lower than the Open price of the specified...
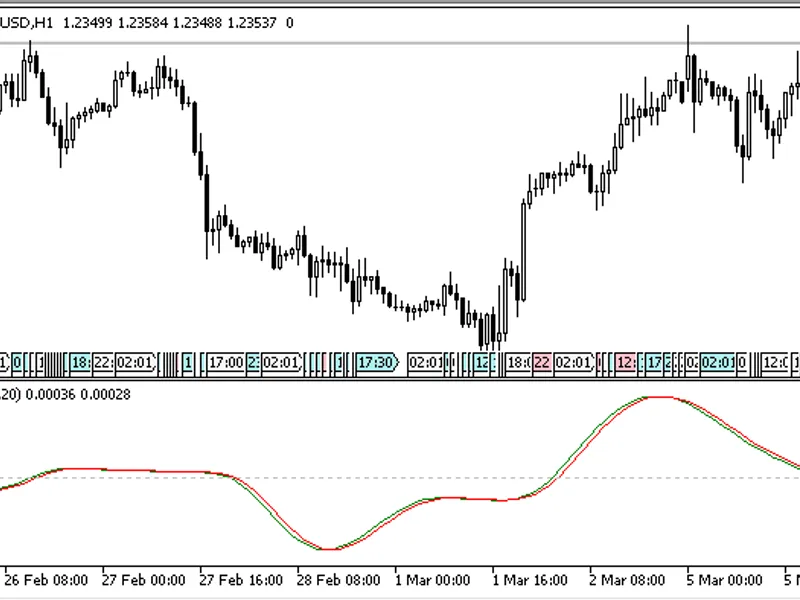
The style requires two buffers (a buffer of values HistogramBufferand a color buffer HistogramColors):Colors are set in the lineHere, color clrCyan has index "0", clrRed has index ...
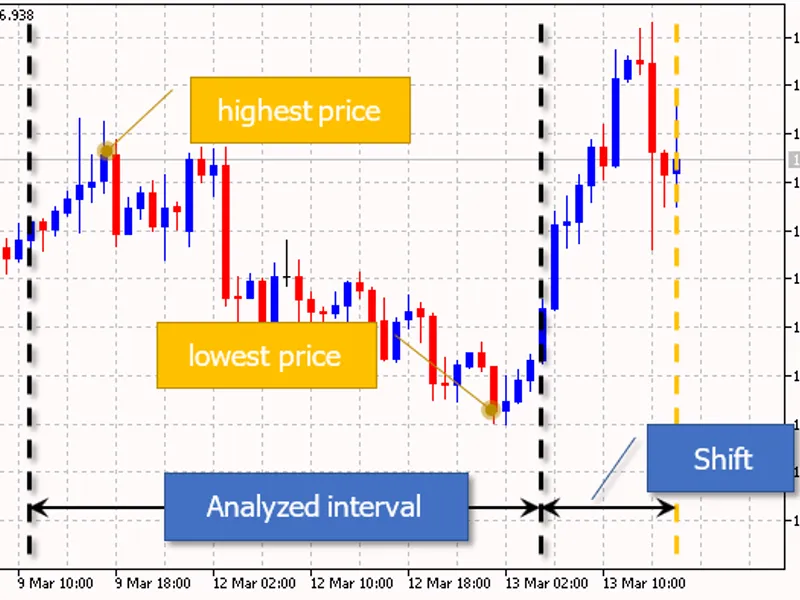
The Expert Advisor opens no more than one position per day. Conditions for opening a position are checked at the specified time. The EA searches for the highest high priceand the l...
Detrended Price Oscillator Bar- this oscillator indicator eliminates the trend component of the price movement chart. This simplifies the process of determining price fluctuation c...
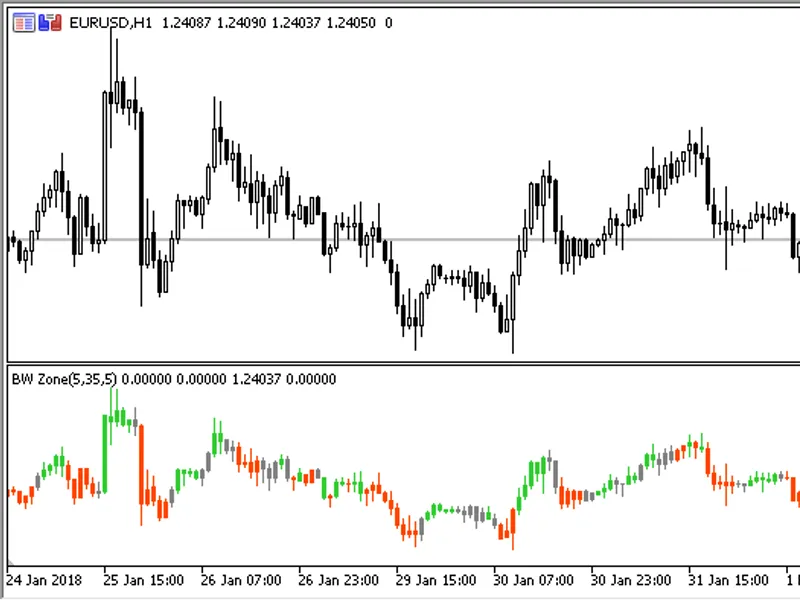
A modified indicator of Bill Williams' zone trading.In contrast to using standard Awesome Oscillator (AO) and Accelerator Oscillator (AC), this indicator allows setting the calcula...
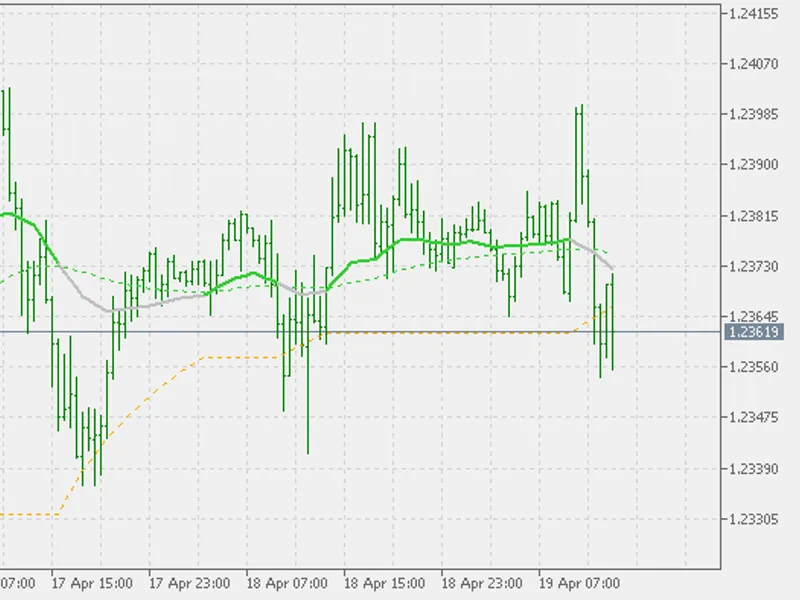
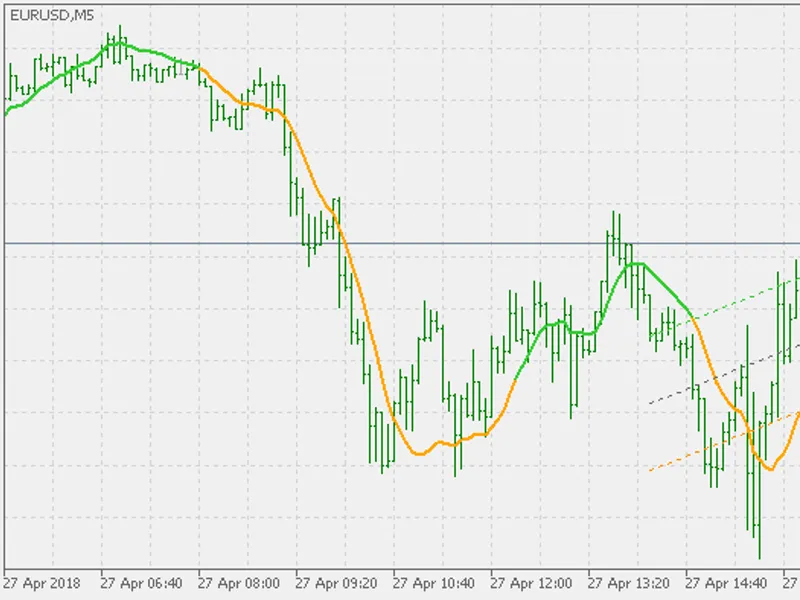
This indicator is a moving average built on Heiken Ashi candlesticks.It has two parameters:Period- calculation period;Method- calculation method. Calculation formulas:where:...
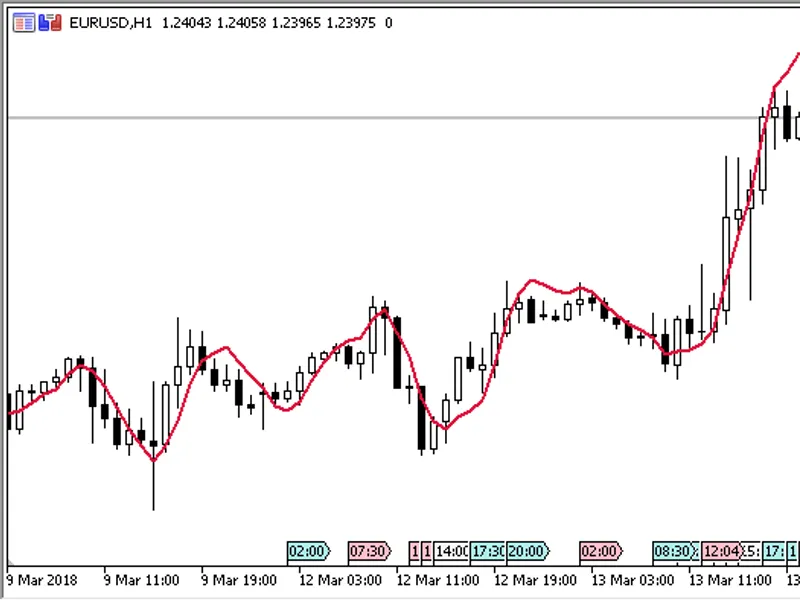
A Moving Average calculated by linear regression.The indicator has two input parameters:Period- calculation period;Applied price- price used for calculations. ...
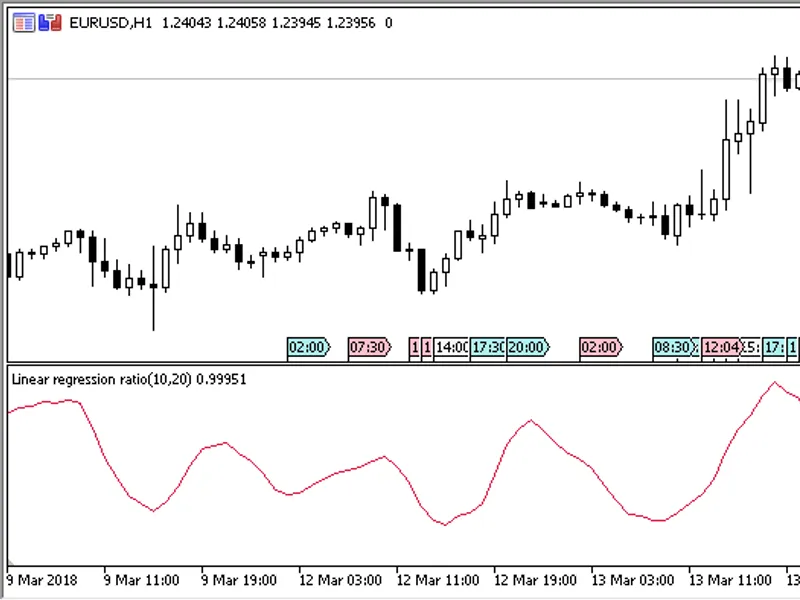
An oscillator indicator. Shows the ratio of two moving averages constructed by the method.There indicator has three adjustable parameters:Period LSMA first- period of the first LSM...
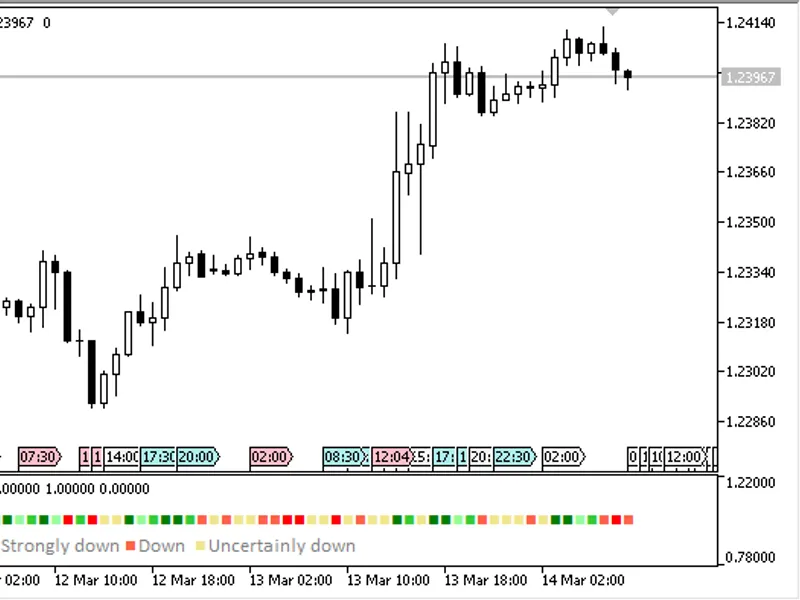
A trend state indicator. It is a signal modification of the of the same name.It has only one input parameter:Period- indicator calculation period. The indicator displays color mark...
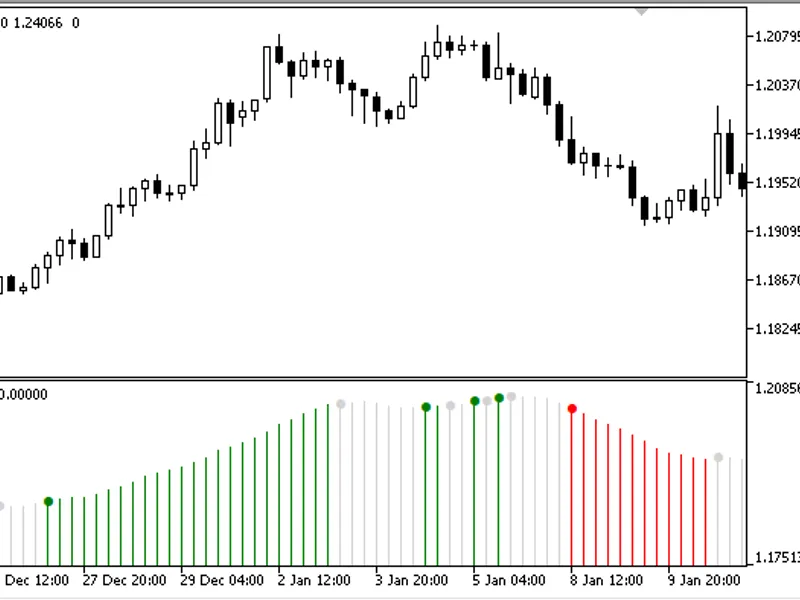
A signal histogram indicator. Draws a histogram with signal marks in a separate window. The histogram has three colors to determine buying, selling and the neutral state. Signal ma...
The indicator draws on a price chart a stochastic with overbought/oversold zones.The indicator has eight configurable parameters:%K period- main line calculation period;%D period- ...
The Expert Advisor searches for position opening conditions only on a new bar (performs operations at the moment of new bar emergence), while Virtual Profitis controlled on every t...
Third-party applications for MetaTrader 4 allowing to obtain a tick history from various sources have always been popular. This history is typically used in the Strategy Tester for...
with an option to work in multi timeframe mode too.Timeframes supported are all the possible timeframes supported by MetaTrader 5 and it has 3 "special" timeframes:Next higher time...
with an option to work in multi timeframe mode.Timeframes supported are all the possible timeframes supported by MetaTrader 5 and it has 3 "special" timeframes:Next higher timefram...
Timeframes supported are all the possible timeframes supported by MetaTrader 5 and it has 3 "special" timeframes:Next higher timeframe: first higher timeframe compared to active ch...
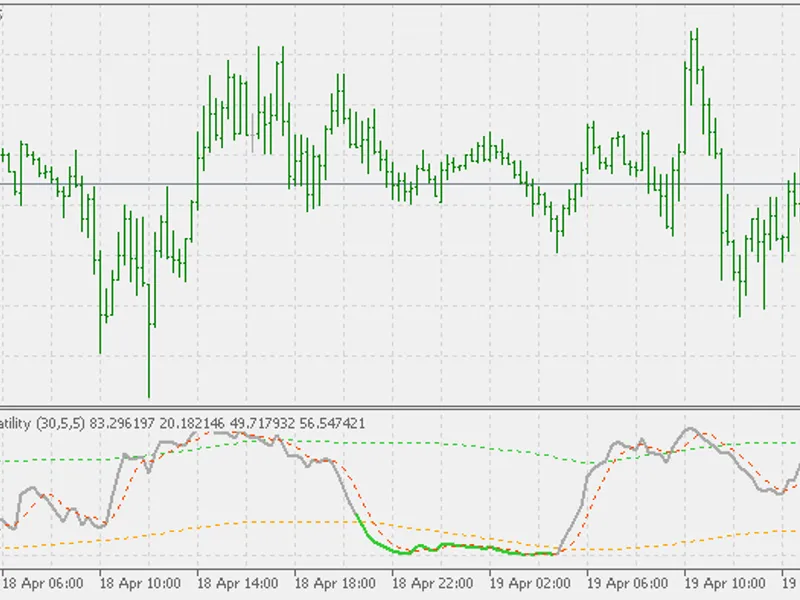
The indicator is made after the original work and idea of Francesco G. Cavasino (described in his published article "Stochastic volatility").Original stochastic (OriginalStochinput...
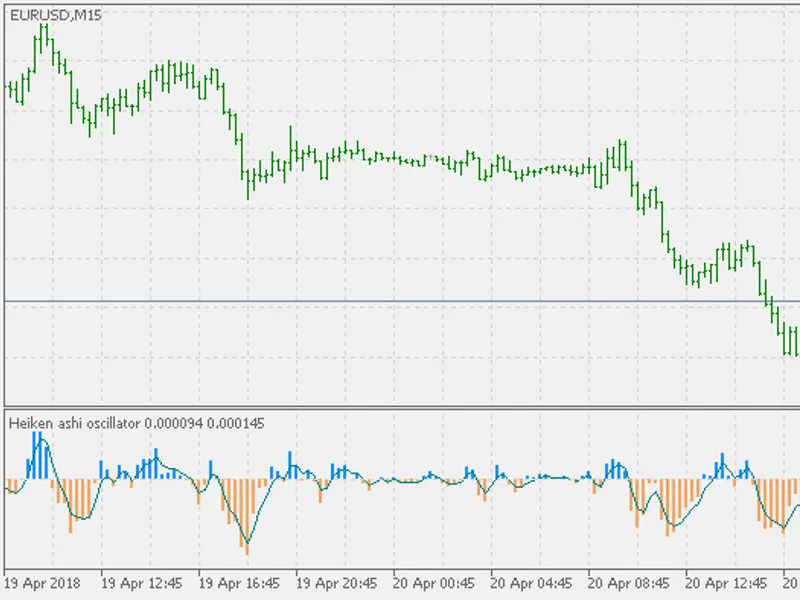
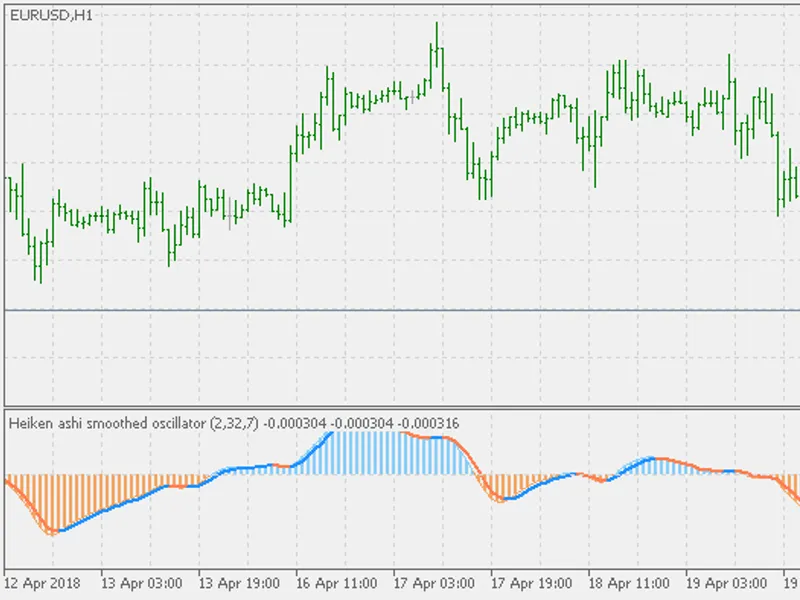
This is one of indicators that falls into the price oscillators family.Instead of using "pure price" this indicator uses Heiken Ashi values to determine the trend as well as the "s...
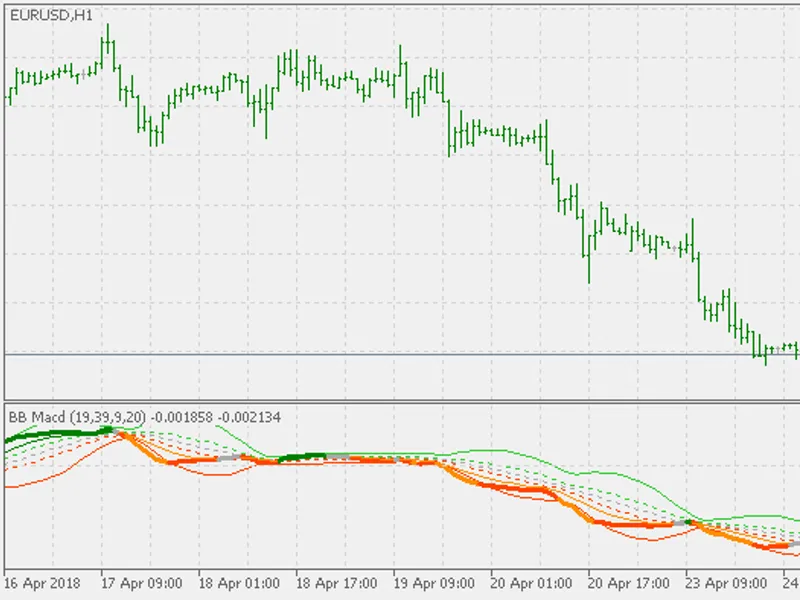
BB MACD is a MACD (Moving Average Convergence Divergence) indicator variation with an addition of Bollinger Bands, which helps in detecting trend change points and measuring curren...
Based on the June 2010 issue of TASC article by John Ehlers and Rick Ways "Fractal Dimension As A Market Mode Sensor".Short descriptions of their interpretation of fractal dimensio...
A lot of people have attempted to build indicator that assesses if there is a trend going on or the market is ranging. One of them was Mark Jurik too....
The Hurst Exponentis used as a measure of long-term memory of time series. It relates to the autocorrelations of the time series, and the rate at which these decrease as the lag be...
Indicator based on "Automated Support And Resistance" article by Mel Widner published in TASC.Two oscillators are defined: the WSO (Widner Support Oscillator) and the WRO (Widner R...
Linear regression line with an addition of standard error channel projection.Linear regression attempts to model the relationship between two variables by fitting a linear equation...
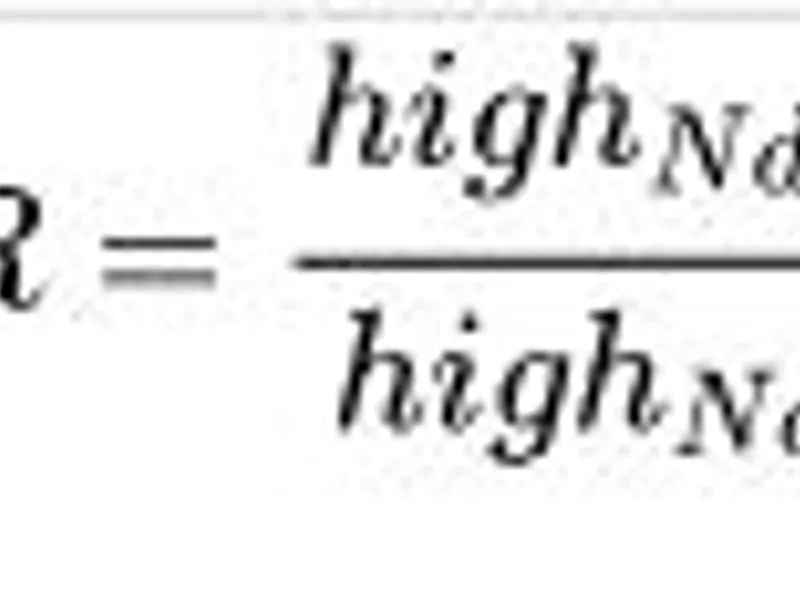
Williams %R, WPR, or just %R, is a technical analysis oscillator showing the current closing price in relation to the high and low of the past N days (for a given N). It was develo...
Based on the Austin Passamonte's idea, this indicator calculates intra-day pivots.Also, when alternative pivots are used, it looks like the example bellow. The alternative pivots a...
indicator (based on the article that was published in the January 2010 issue of TASC) with a smoothing option.Smoothing is done by filtering (smoothing) prices prior to vortex calc...
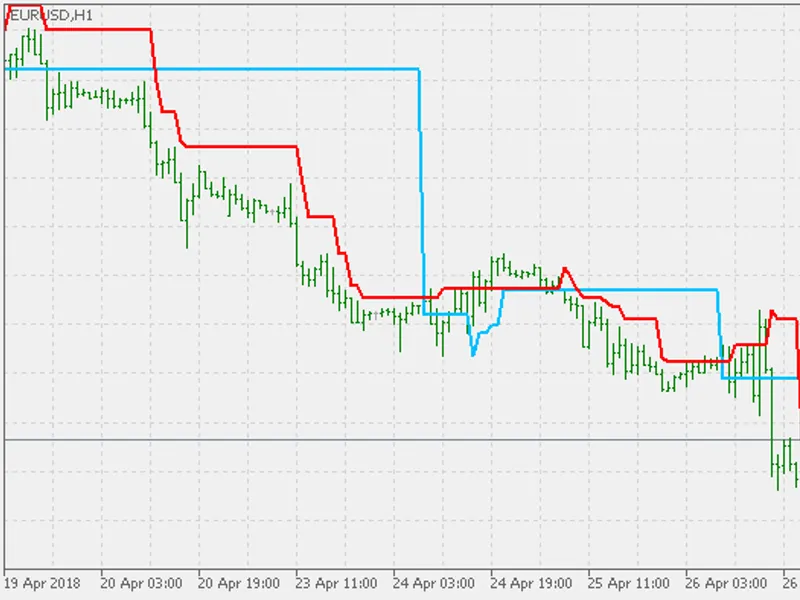
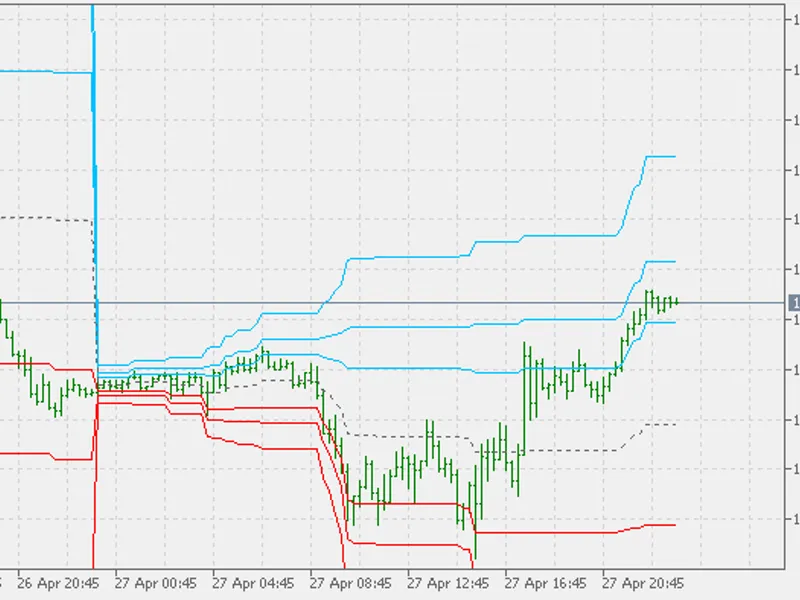
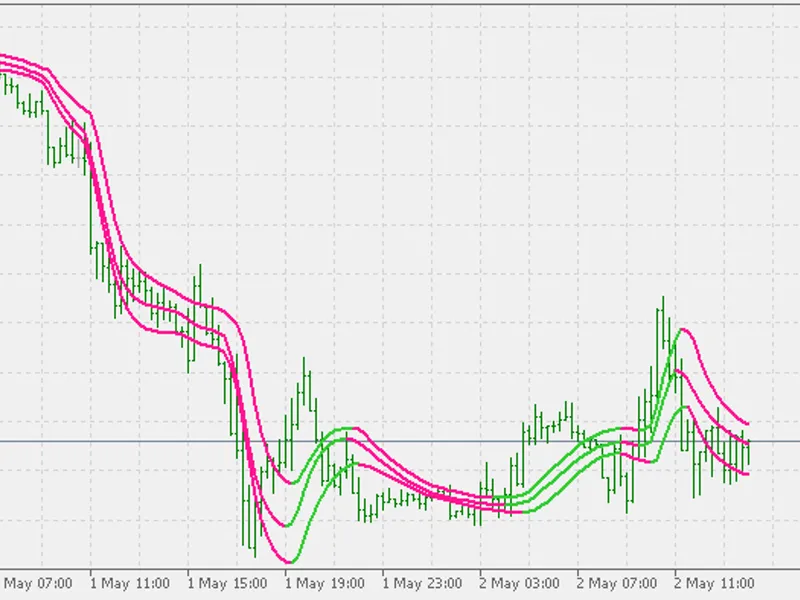
Ultra Trend is one of the well known indicators made for MetaTrader 5 now.The way how Ultra Trend is calculated is simple:Multiple period Jurik smooth values are calculated. Slope ...
Jurik smoothing (not the same as Jurik average - the Jurik smoothing we are using for MetaTrader 5 is actually an indicator that is completely done using MetaTrader 5 and was not d...