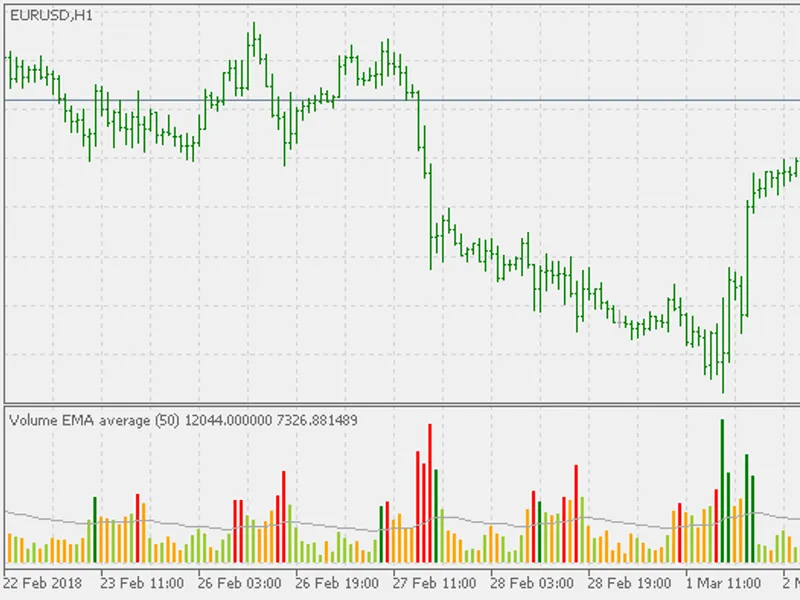
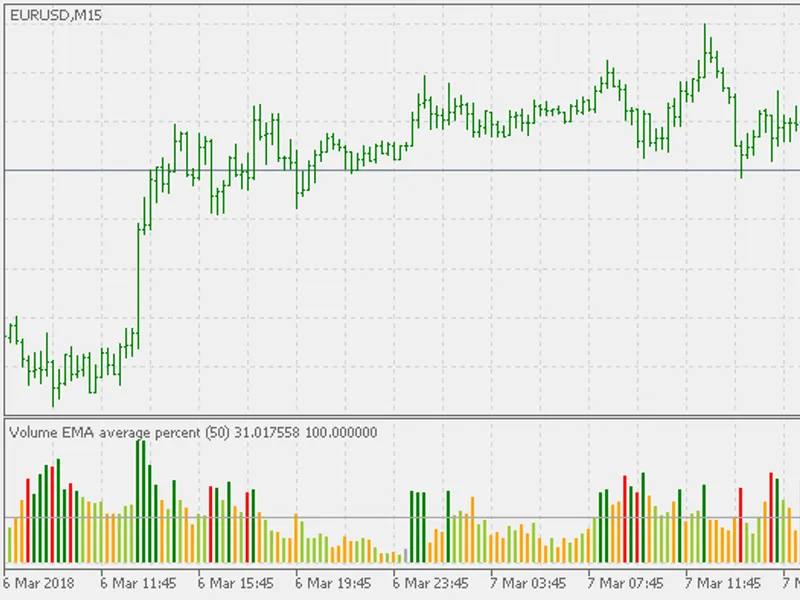
Long known volume analysis method.In capital markets, volume, or trading volume, is the amount (total number) of a security (or a given set of securities, or an entire market) that...
In capital markets, volume, or trading volume, is the amount (total number) of a security (or a given set of securities, or an entire market) that was traded during a given period ...
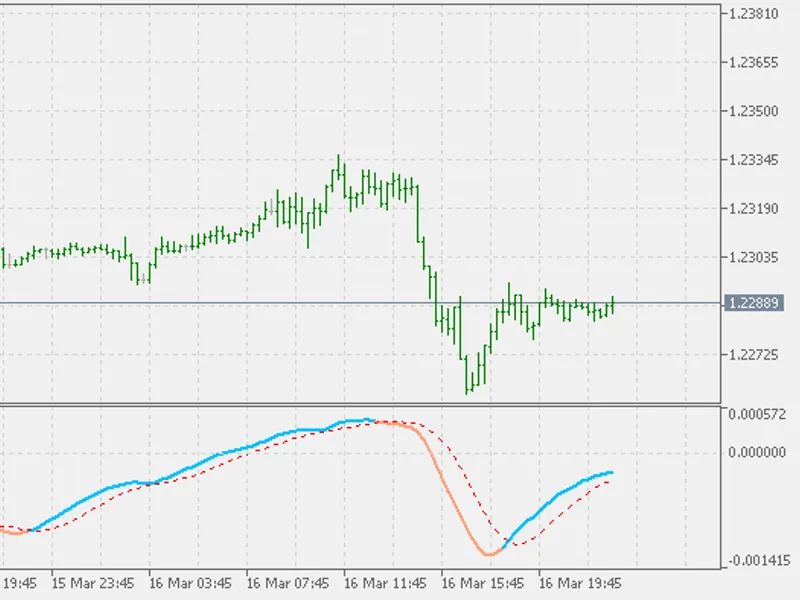
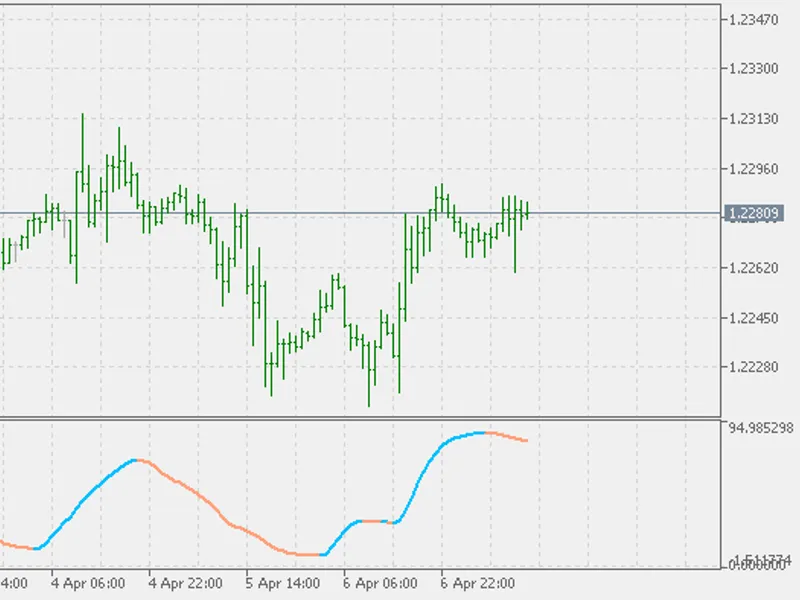
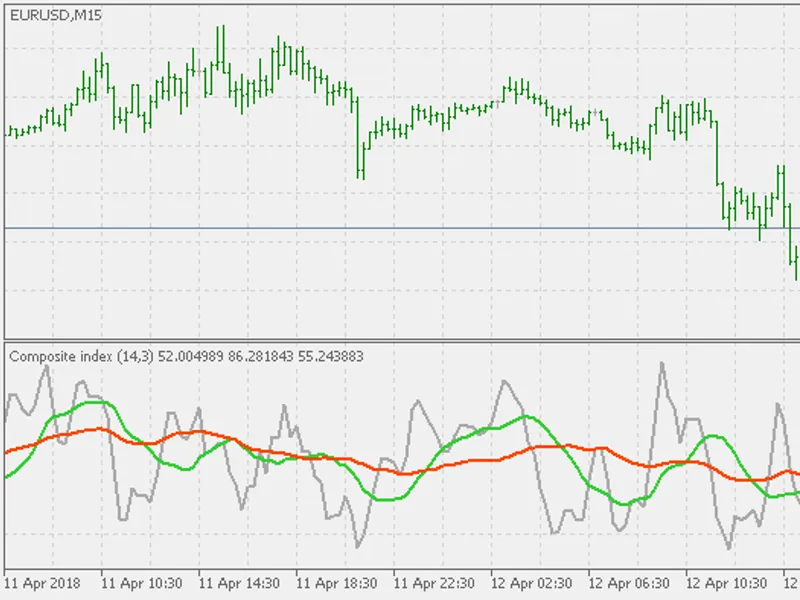
CCI is a very useful indicator. But it lacks one thing: known bounds.Adding Inverse Fisher Transform to CCI makes it oscillate in known bounds, and that way it can help in assessin...
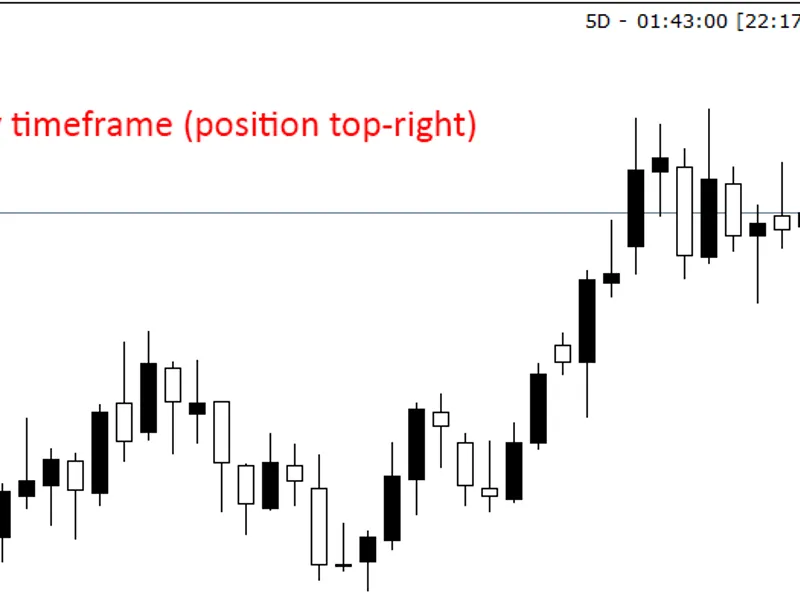
Candle Closing Time Remaining (CCTR) MT5 is an indicator which displays the remaining time for an open candle to be closed.Features Changeable color and size. Changeable location ...
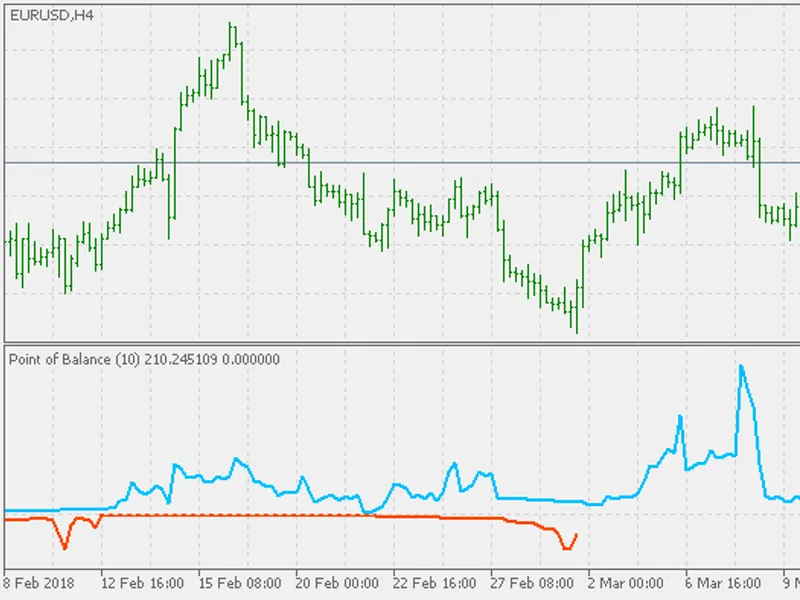
From Walter Downs’ article "From Terms To Technical Tools" he introduces the Point of Balance Oscillator, two conditions to color bars and two system tests.The indicator shows curr...
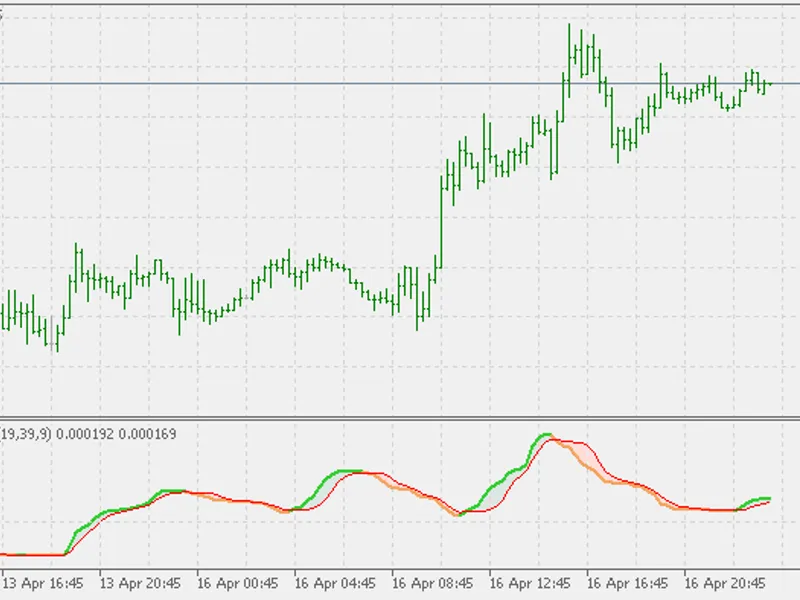
Developed by Gerald Appel in the late seventies, the Moving Average Convergence/Divergence oscillator (MACD) is one of the simplest and most effective momentum indicators available...
The Stochastic Oscillator is a momentum indicator comparing the price to the range of its prices over a certain period of time. The sensitivity of the oscillator to market movement...
There has been a lot of complaints of some people that MetaTrader 5 is so much more complicated than MetaTrader 4 regarding the code. But it seems that people haven't explored the ...
One more in the series of a simple-to-do code examples in MetaTrader 5 (the main loop of this one has 6 lines of code).This is a MACD that can use average for input price instead o...
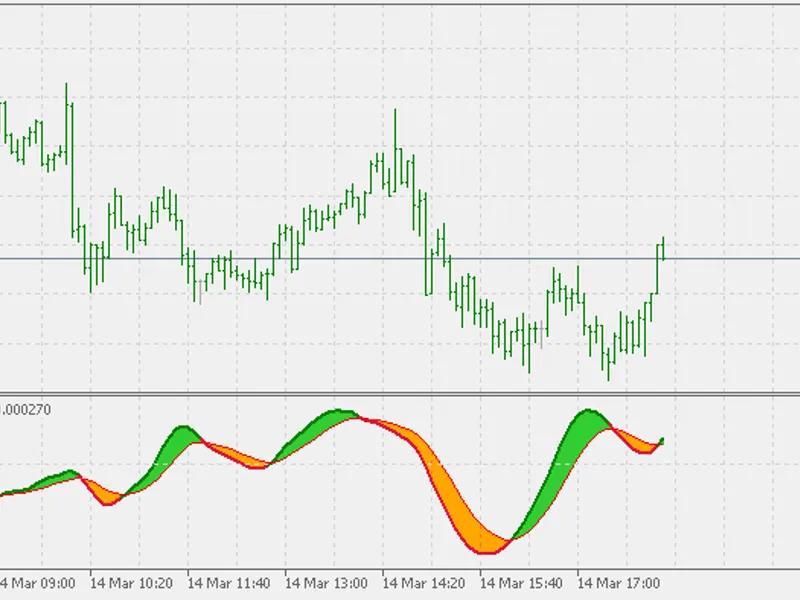
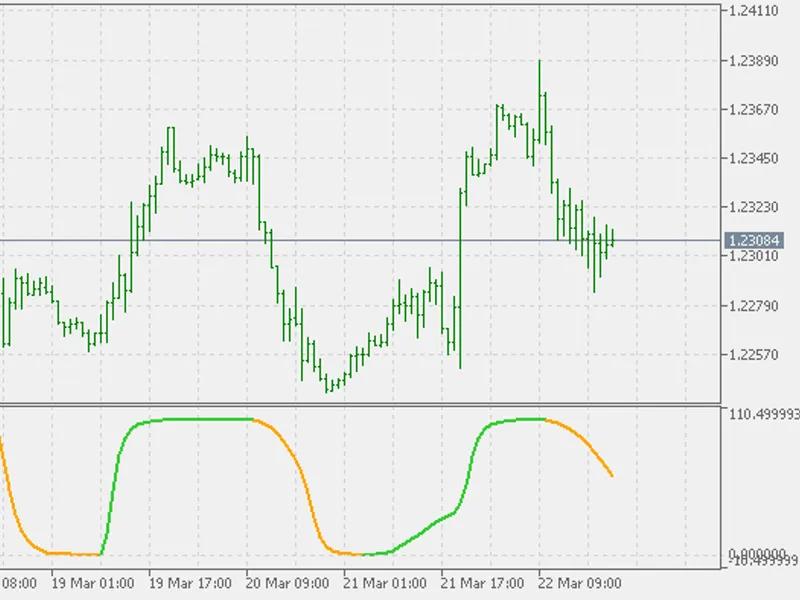
The Schaff Trend Cycle (STC) indicator is the product of combining Slow Stochastics and the Moving Average Convergence/Divergence (MACD). The MACD has a reputation as a trend indic...
The code is based on the library.Library contains ErrorDescription()function with two input parameters error_codeand optional parameter txt_prefix.GetLastError() return codes can b...
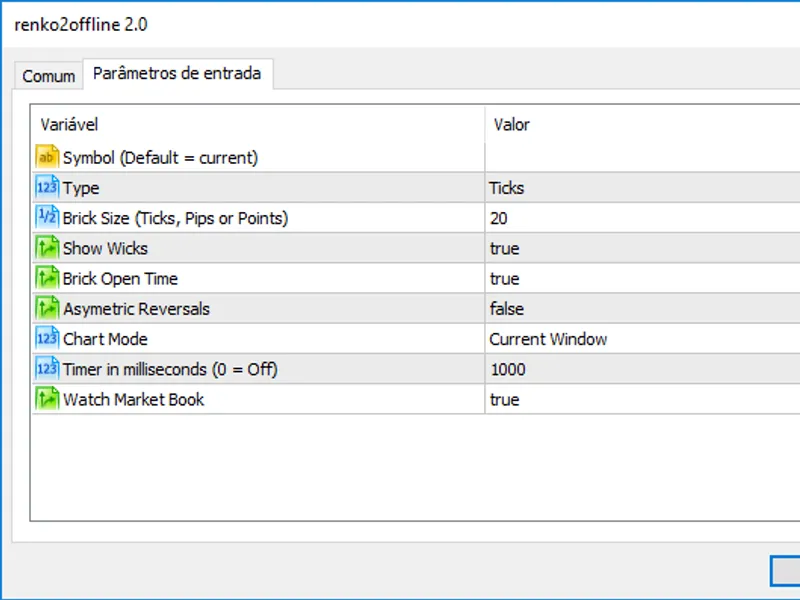
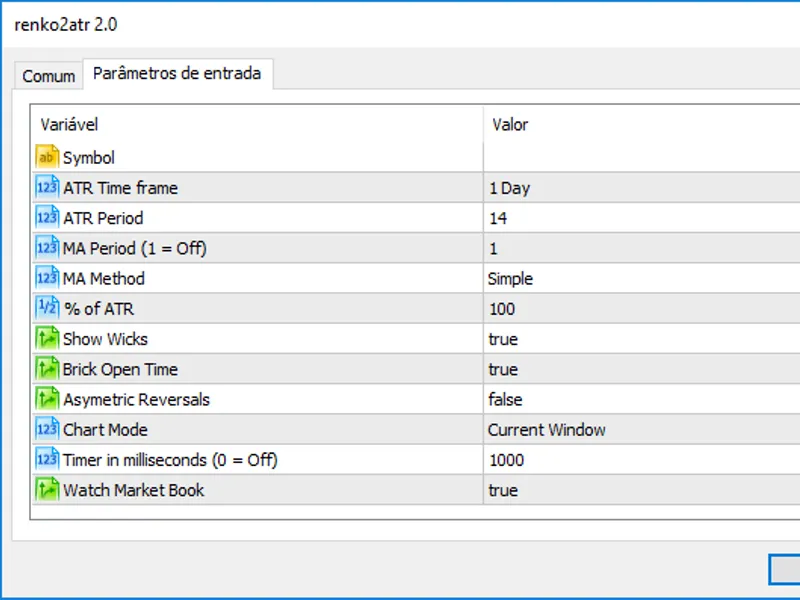
Renko 2.0 Offline non-trading utility generates custom symbol information on 1M chart. Based on indicator. References the library for MetaTrader 5 by fxsaber.This non-trading exper...
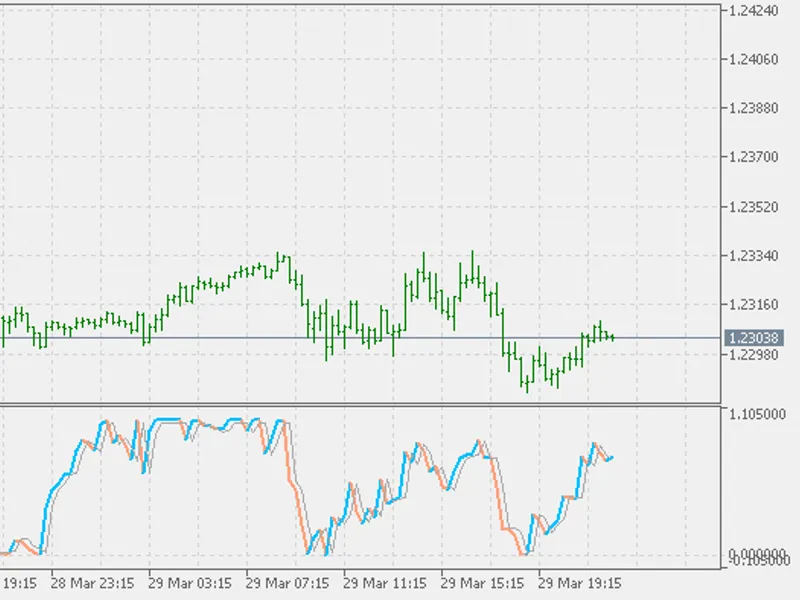
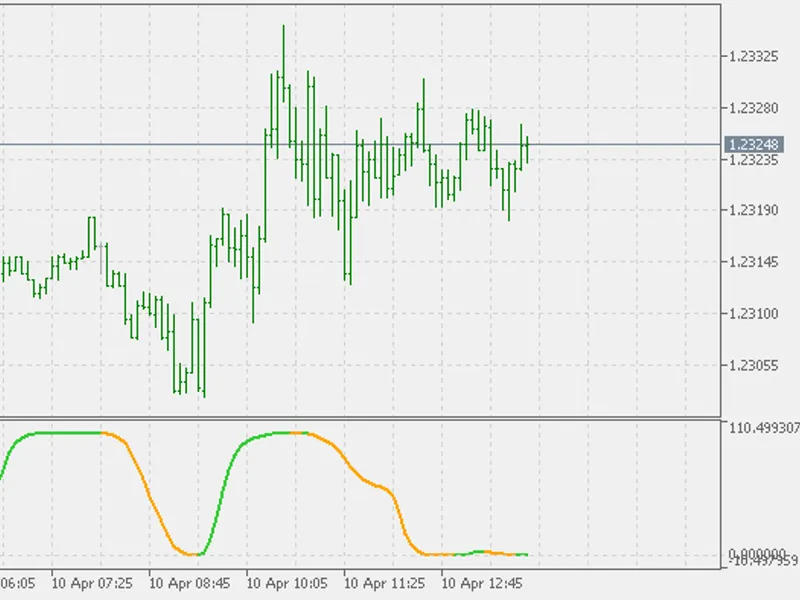
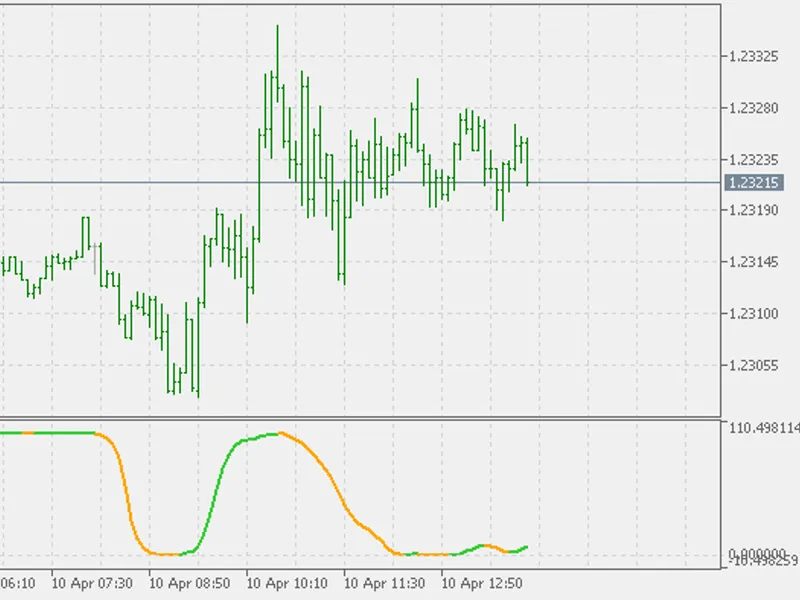
In their 1994 book, "The New Technical Trader", Tushar S. Chande and Stanley Kroll explain that RSI can oscillate between 80 and 20 for extended periods without reaching extreme l...
Renko 2.0 Offline non-trading utility generates custom symbol information on 1M chart. Based on indicator. References the library for MetaTrader 5 by fxsaber.This non-trading exper...
In his TASC April 2008 article, François Bertrand describes a "what-if" RSI indicator: what should be the price so that some target RSI level would be reached.The indicator helps i...
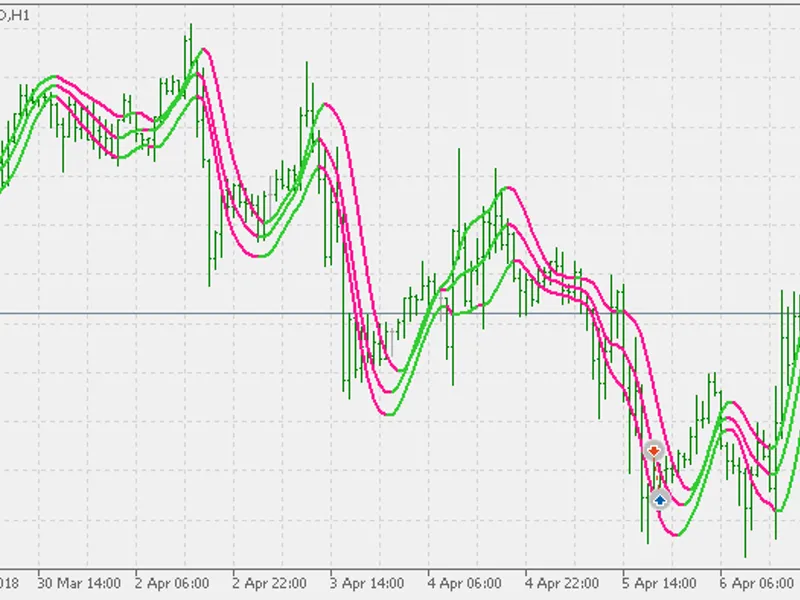
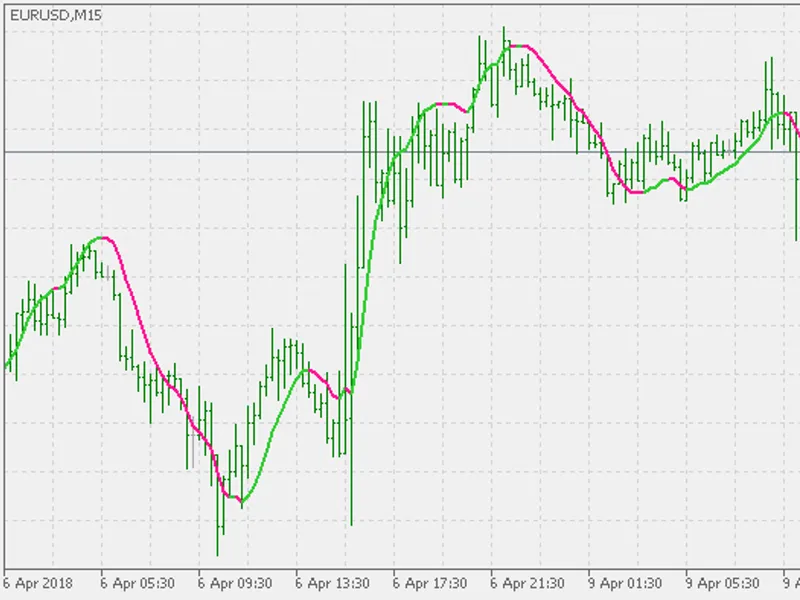
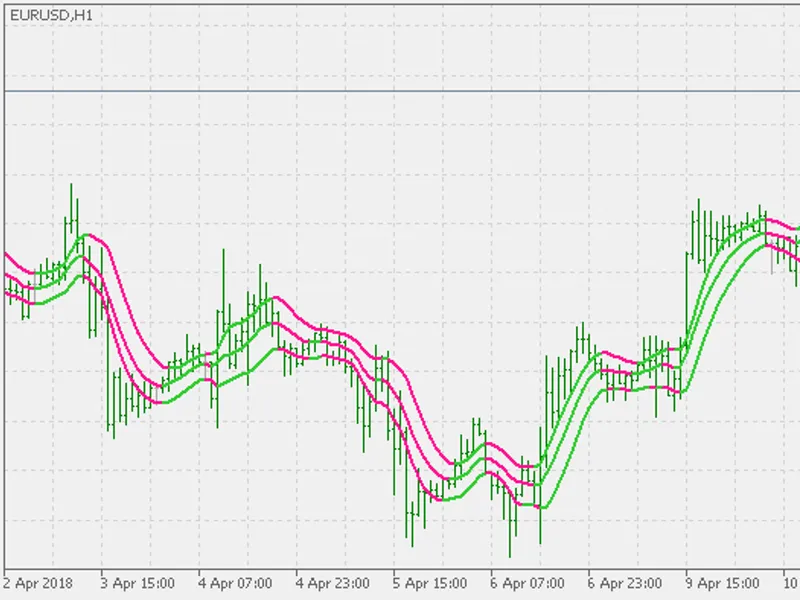
The indicator is using 3 instances of Hull Moving Average. The Hull Moving Average (HMA), developed by Alan Hull, is an extremely fast and smooth moving average. In fact, the HMA a...
The Relative Strength Index (RSI) is a momentum indicator developed by noted technical analyst Welles Wilder, that compares the magnitude of recent gains and losses over a specifie...
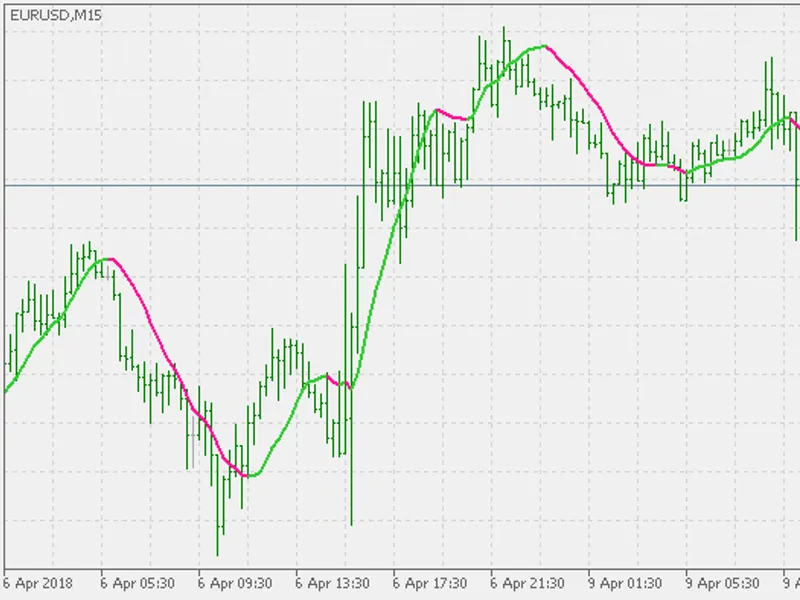
In an eternal search for an average with less lag, there were few attempts that were quite good. The ZeroLAG MA indicator was described in the journal "Technical Analysis of Stocks...
The Indicator ZeroLAG MA was described in journal Technical Analysis of Stocks and Commodities, April, 2000 for the first time and according to creators, the Indicator ZeroLAG MA i...
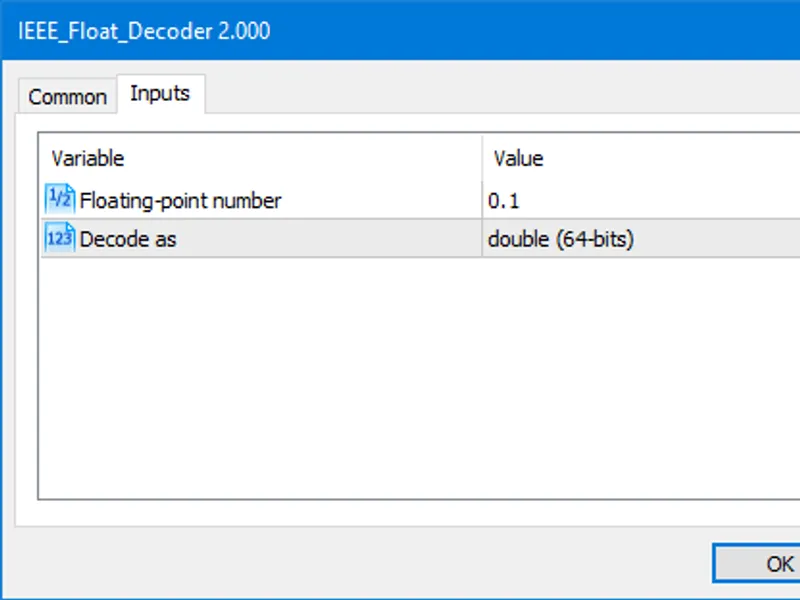
Display the actual stored value of a floating-point number (float or double type), with very high precision up to 55 decimal digits. This helps to debug exact value of floating-poi...
Adding zero lag MA to the RSI calculation as a preferred smoothing method has two things as a result:It is "faster" - zero lag MA is an average with significantly reduced lag. It r...
Adding zero lag DEMA to the RSI calculation as a preferred smoothing method has two things as a result:It is "faster" - zero lag DEMA is an average with significantly reduced lag (...
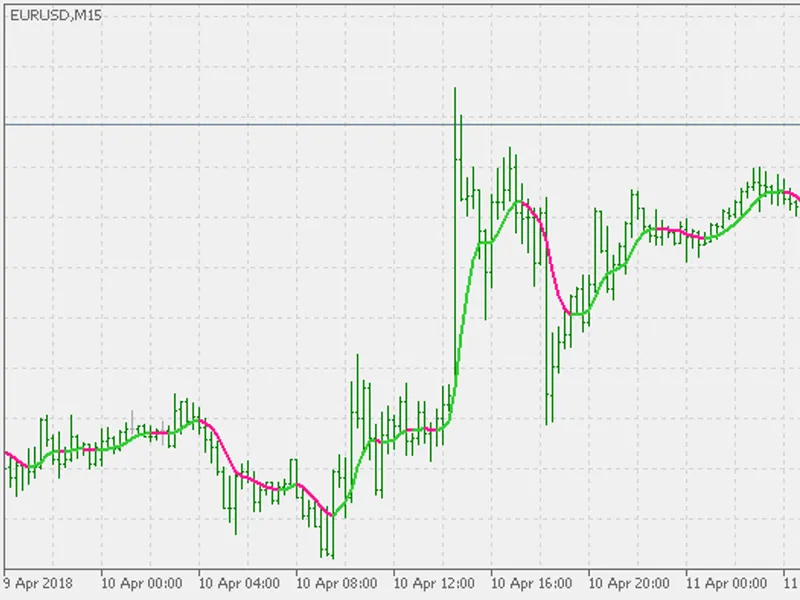
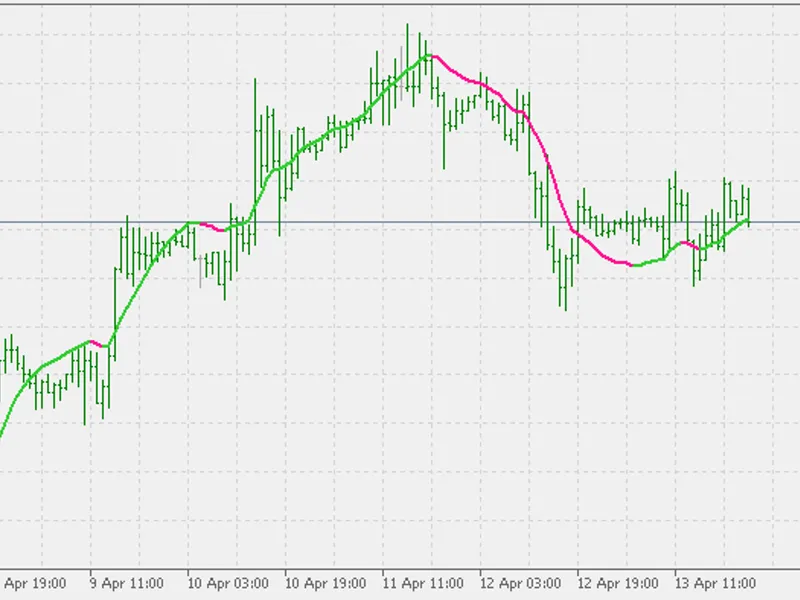
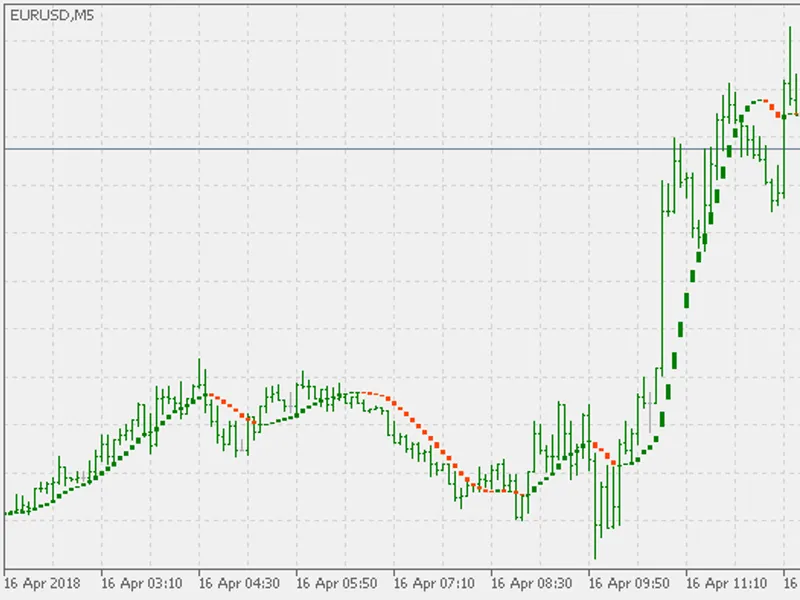
Indicator based on Hull Moving Average.How it works It calculates the Hull Moving Average. Uses the slope of so calculated Hull Moving Average as a criteria for a trend. Depending...
The Schaff Trend Cycle (STC) indicator is the product of combining Slow Stochastics and the Moving Average Convergence/Divergence (MACD). The MACD has a reputation as a trend indic...
The Schaff Trend Cycle (STC) indicator is the product of combining Slow Stochastics and the Moving Average Convergence/Divergence (MACD). The MACD has a reputation as a trend indic...
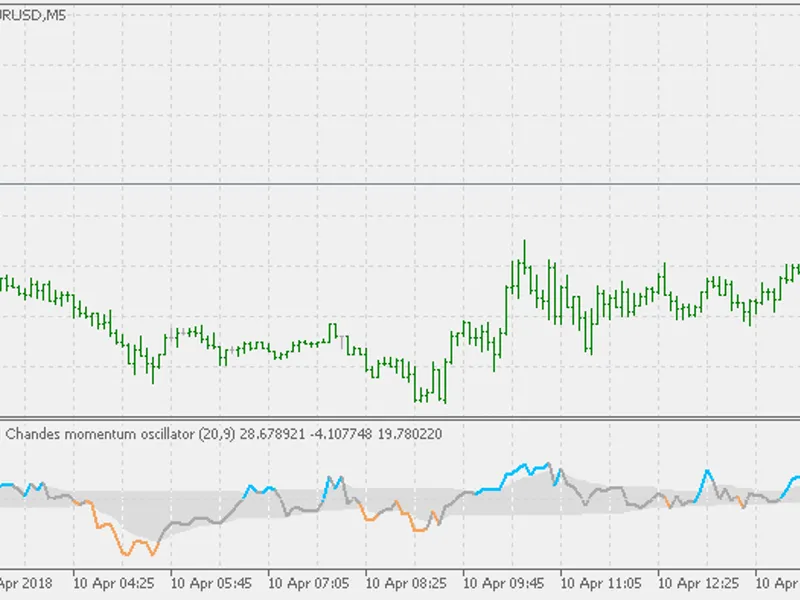
The Chande Momentum Oscillator is a technical momentum indicator invented by Tushar Chande. Chande introduced the indicator in his 1994 book "The New Technical Trader". It is creat...
The Chande Momentum Oscillator is a technical momentum indicator invented by Tushar Chande. Chande introduced the indicator in his 1994 book "The New Technical Trader". It is creat...
Source of this on is February 2004, Active Trader magazine.System concept This system was inspired by the more successful stock systems that have appeared in the Trading System Lab...
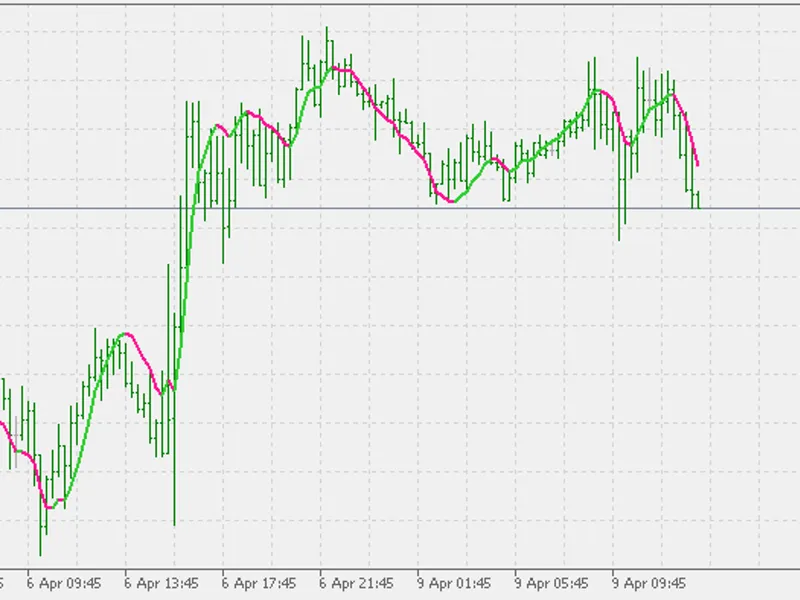
Variation of the "triple" series of indicators.As a reminder: triple indicator is using 3 values - average of high, low and close to determine the overall trend direction and and r...
The Stochastic Oscillator is a momentum indicator comparing the price to the range of its prices over a certain period of time. The sensitivity of the oscillator to market movement...
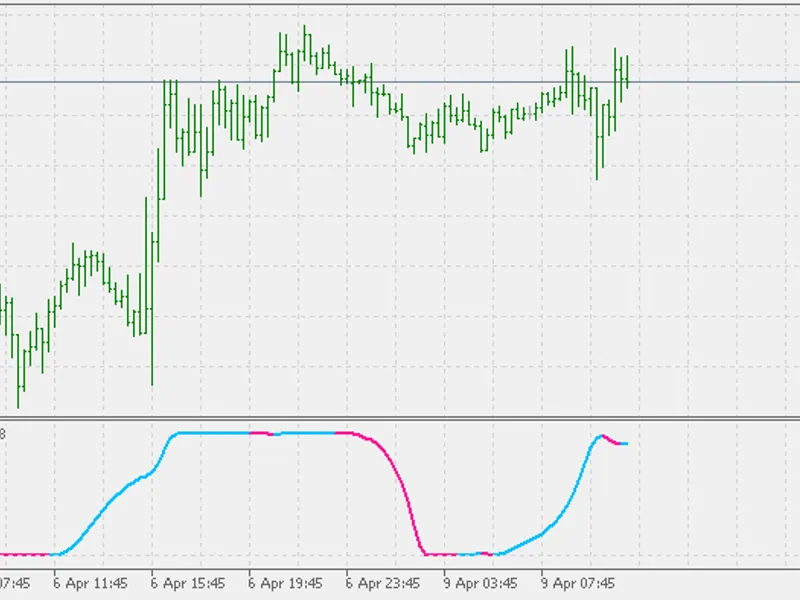
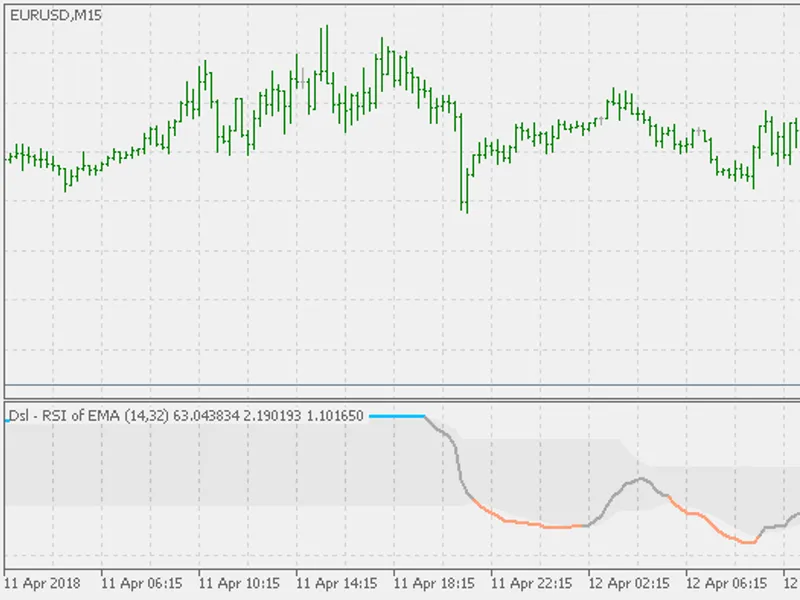
This indicator is using filtered prices for RSI (instead of using "raw" prices) and is using Discontinued Signal Line for trend assessment (instead of using slope or fixed levels)....
The article was published in the January 2010 issue of TASC.We might add that Vortex seems to be working OK an all timeframes and can be used in a fairly reliable mode to determine...
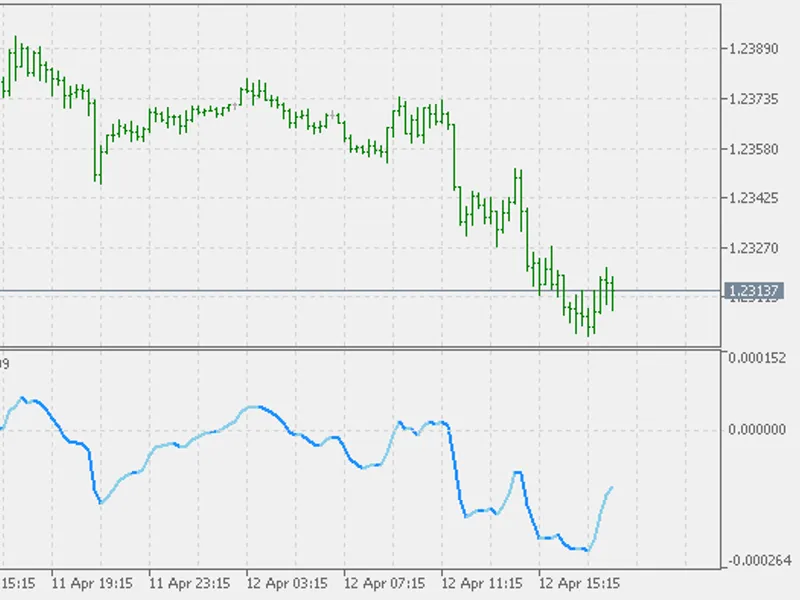
Denis Meyers that invented Polychromatic Momentum, describes it as:The is by all means a useful indicator. But, as many "raw" momentum indicators do, when used without any form of ...
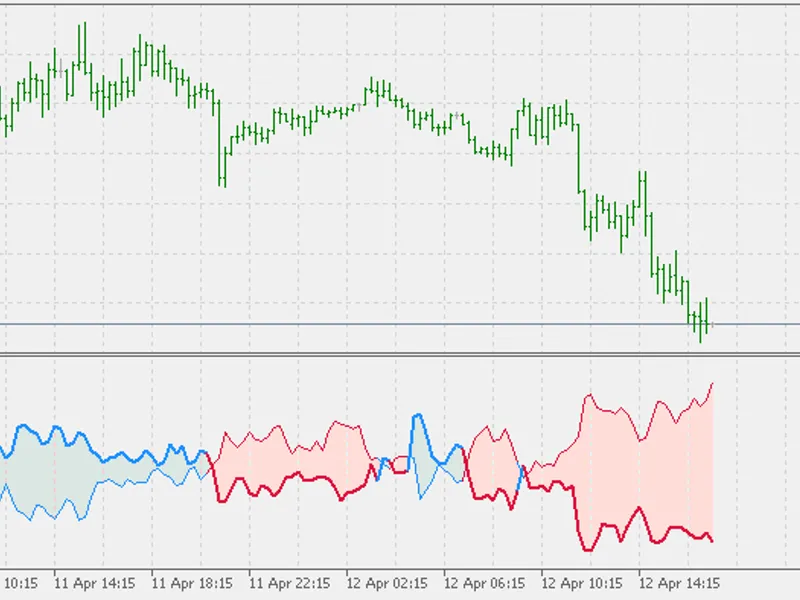
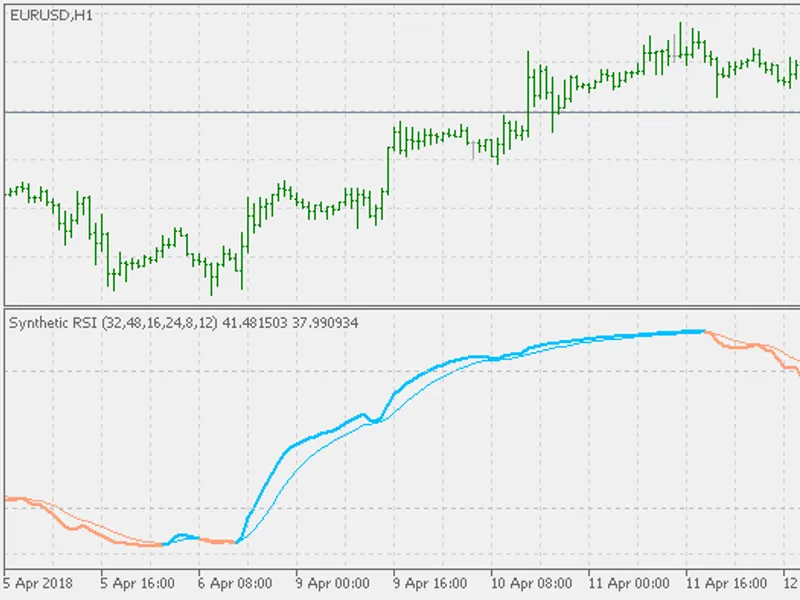
The idea of this indicator is simple:Instead of using one RSI, the indicator is using 3 instances of RSI. Those 3 instances of RSI are then used to calculate the "synthetic" value ...
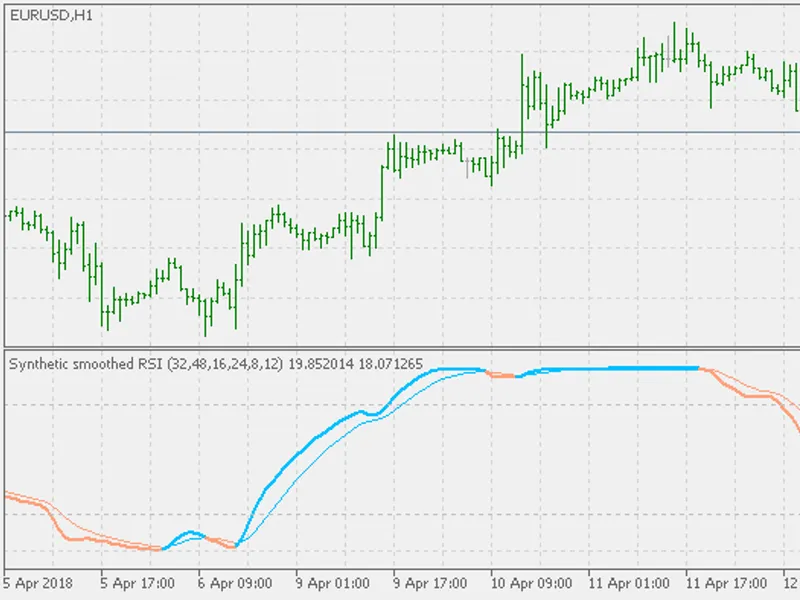
The idea of this indicator is the same as for the synthetic RSI:Instead of using one RSI, the indicator is using 3 instances of RSI. Those 3 instances of RSI are then used to calcu...
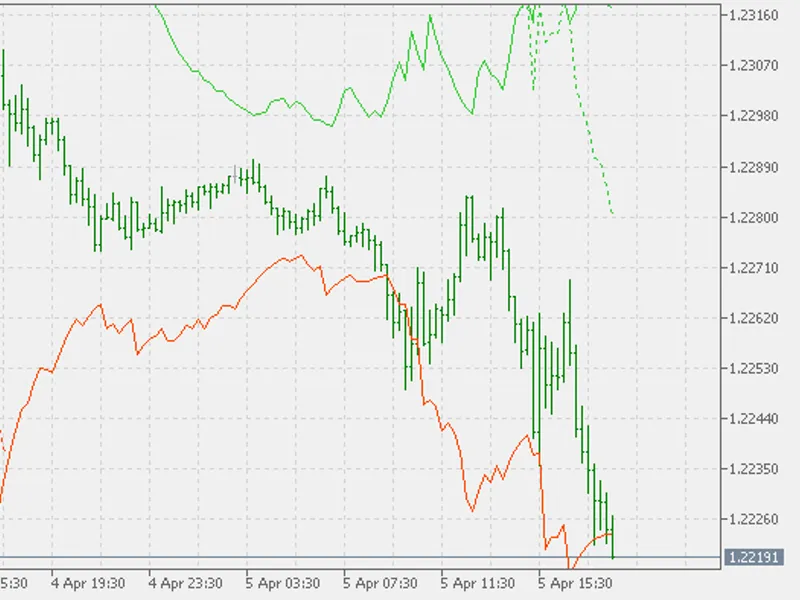
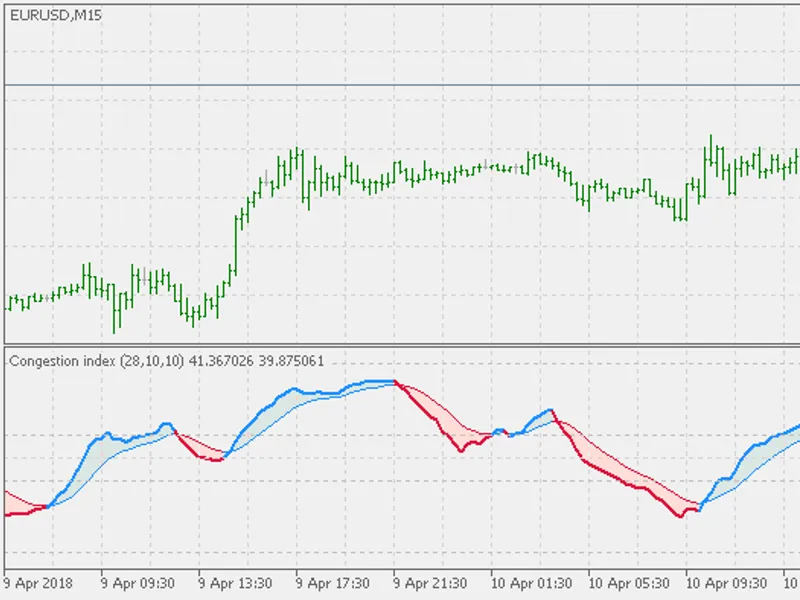
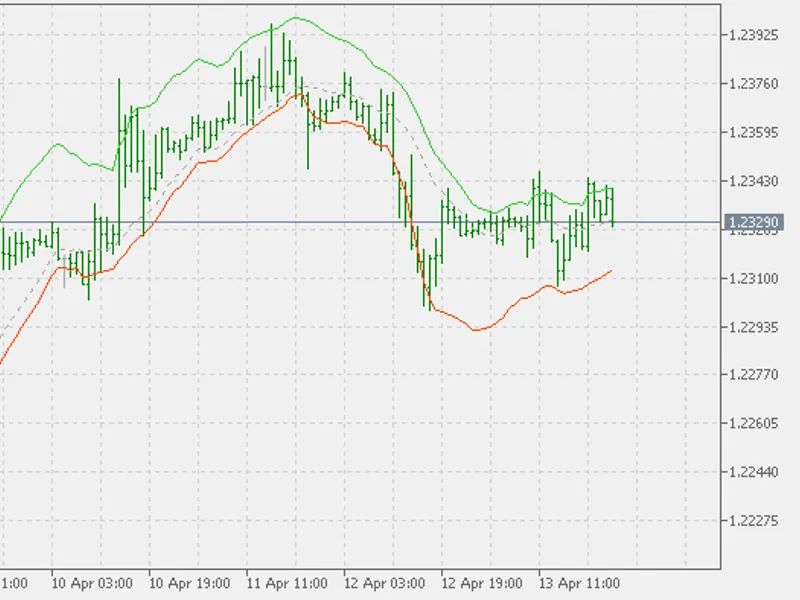
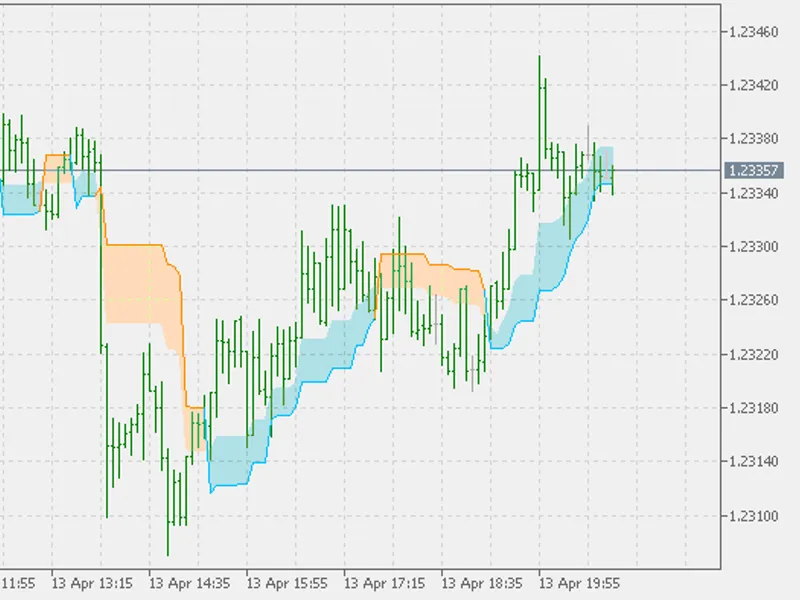
There are a lot of bands type indicators and almost all are working in a very similar way: some basic value is taken to be a central value and the bands are drawn on equal distance...
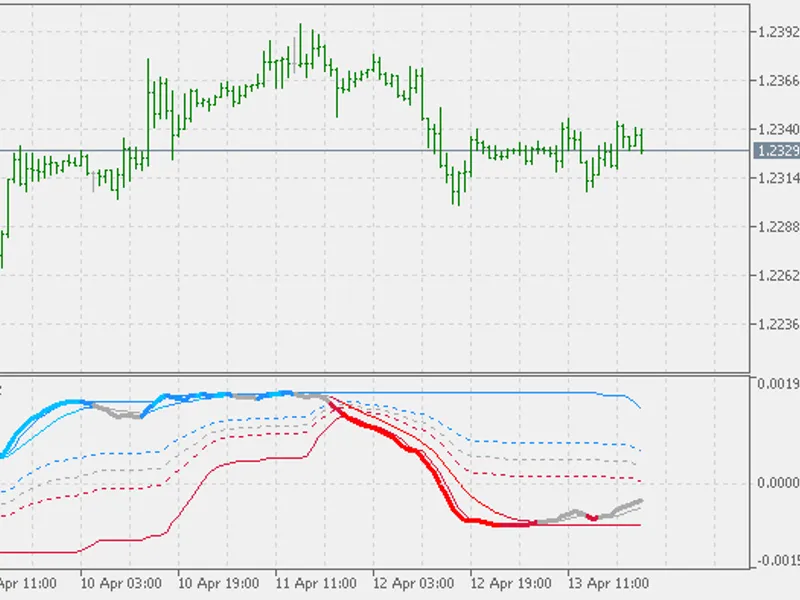
MACD (invented by Gerald Appel back in 1970) is one of the widely used indicators.Usually it is used in combination of a zero line and a signal line.That is a good approach but the...
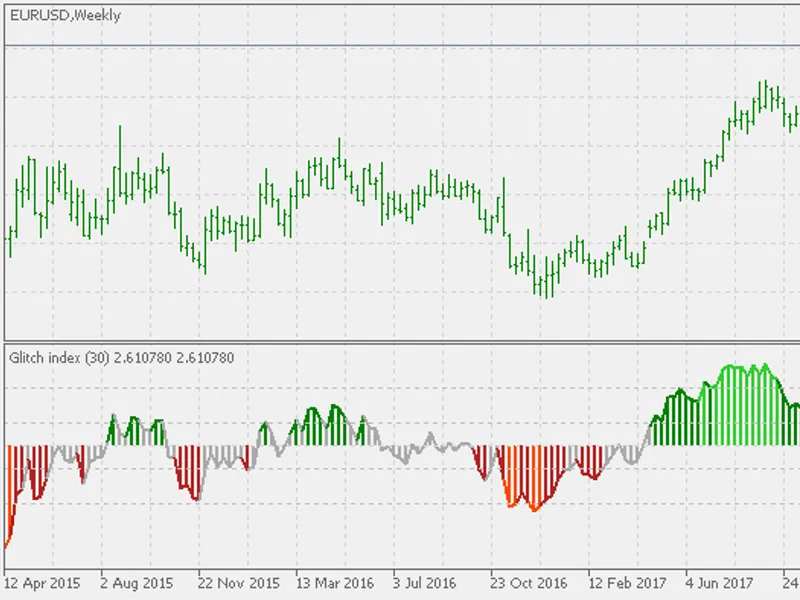
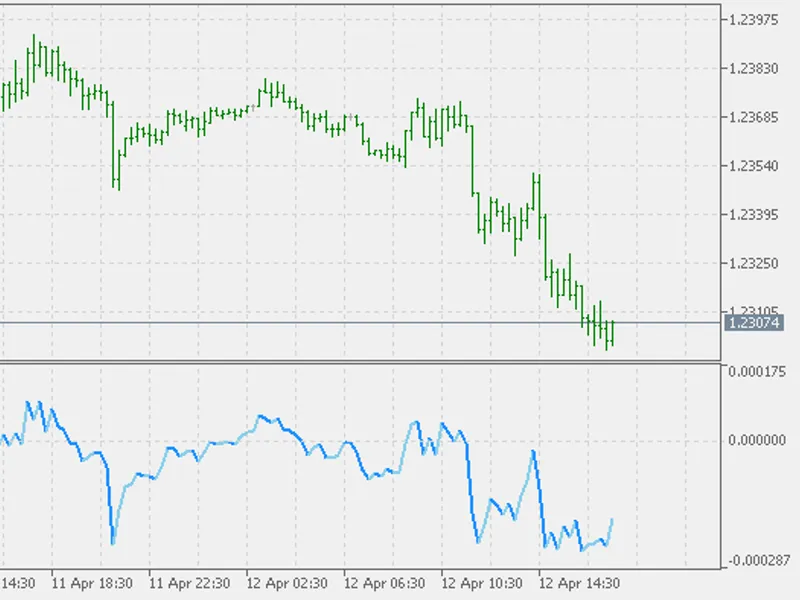
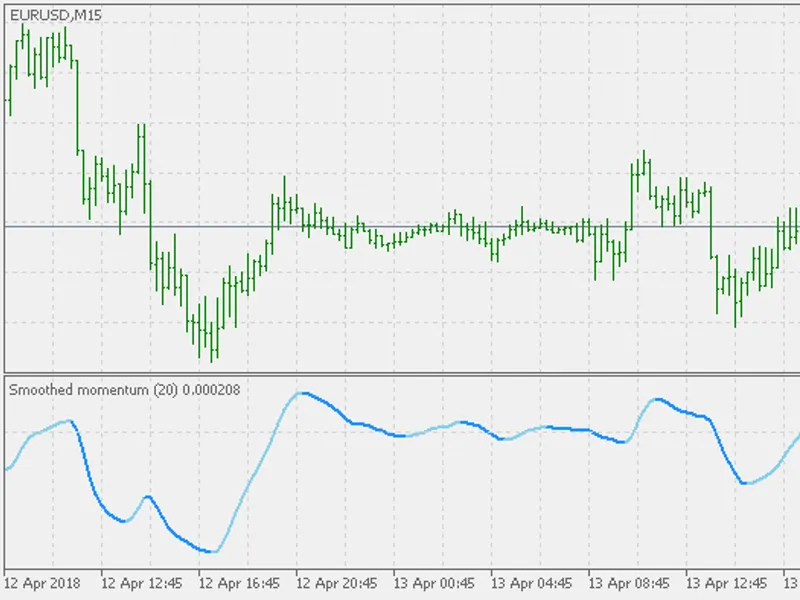
Momentum indicator is one of the frequently used indicators in Technical Analysis. But it has one "issue": it is a very "nervous" indicator - the values it displays are far from be...
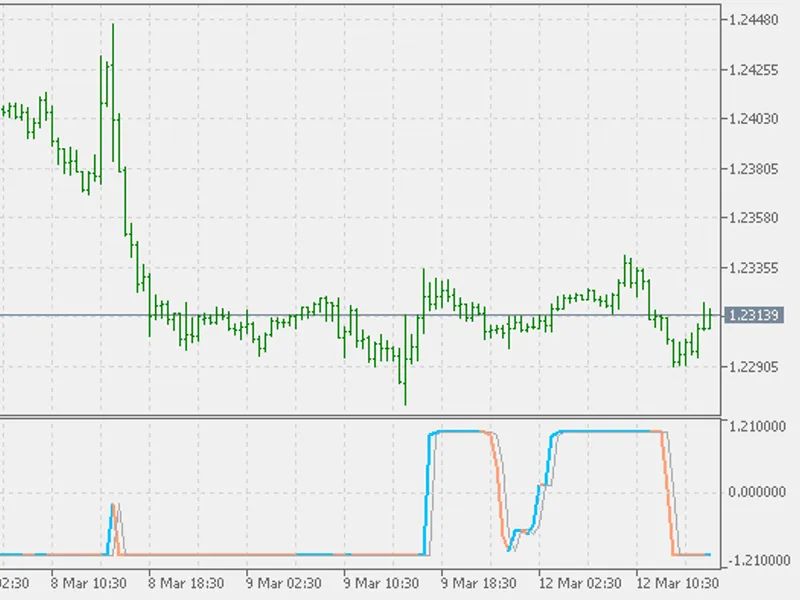
"Sadukey" indicator is an indicator combining two digital filters on a chart to give us an assessment of current trend.Unfortunately the exact nature of the digital filter is unkno...
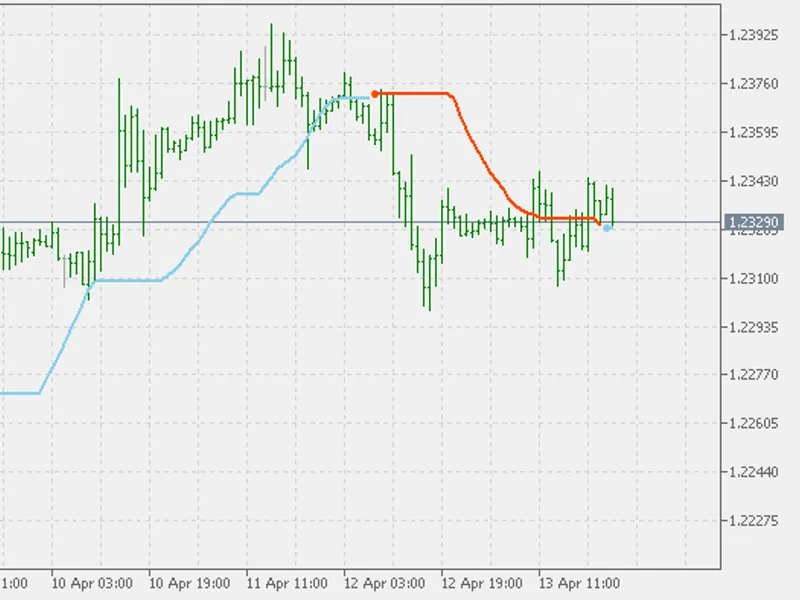
Momentum is usually used for trend or price change direction assessment.This indicator changes that in some way. The stops are calculated using the smoother momentum and the direct...
A new variation of a well known price channel indicator.The indicator shows the current estimated trend based on channel period and desired risk. It also shows two levels of values...
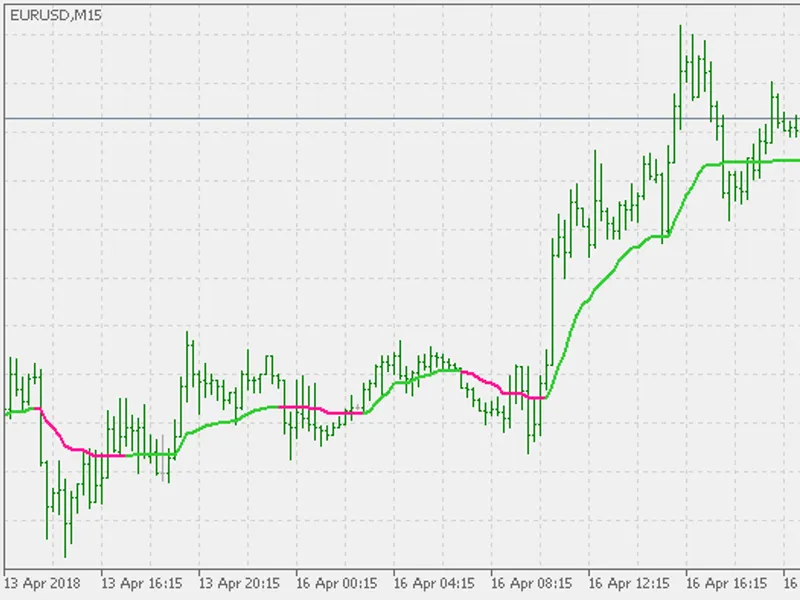
Adaptive Moving Average (AMA) technical indicator is used for constructing a Moving Average with low sensitivity to price series' noises and is characterized by the minimal lag for...
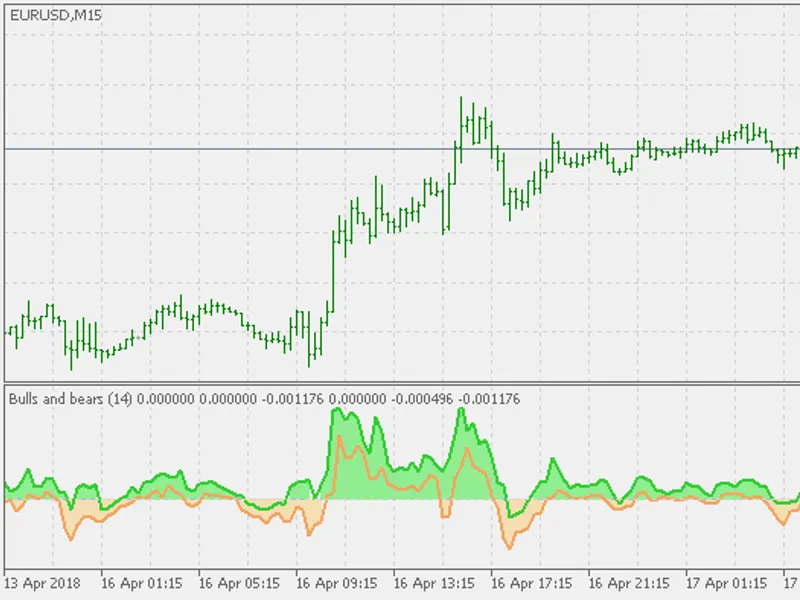
Usually we have one indicator showing bulls power and one showing bears power.Since they are not having the same ranges of values, they can not be just placed in the same window so...
Adaptive Moving Average (AMA) technical indicator is used for constructing a Moving Average with low sensitivity to price series noises and is characterized by the minimal lag for ...