Two identical trading systems based on the change in the color of for long and short trades, which can be configured in different ways in one Expert Advisor. For this purpose, all ...
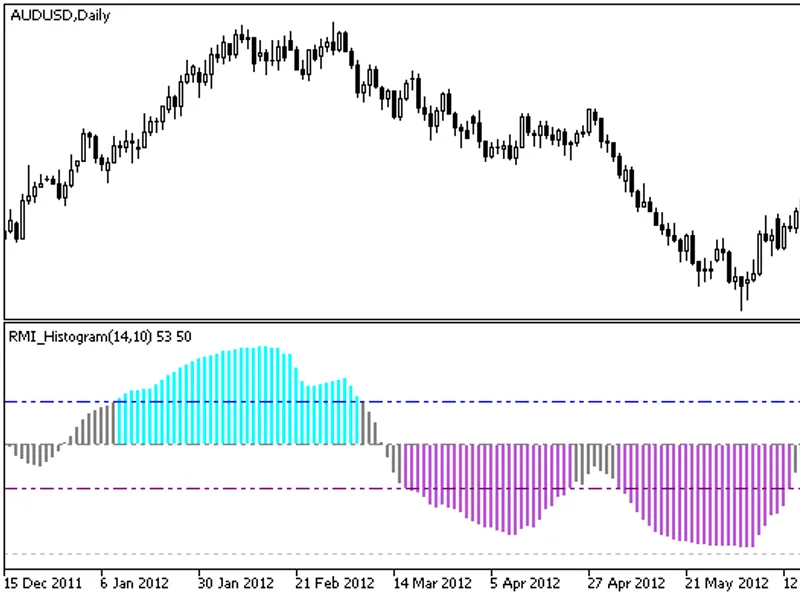
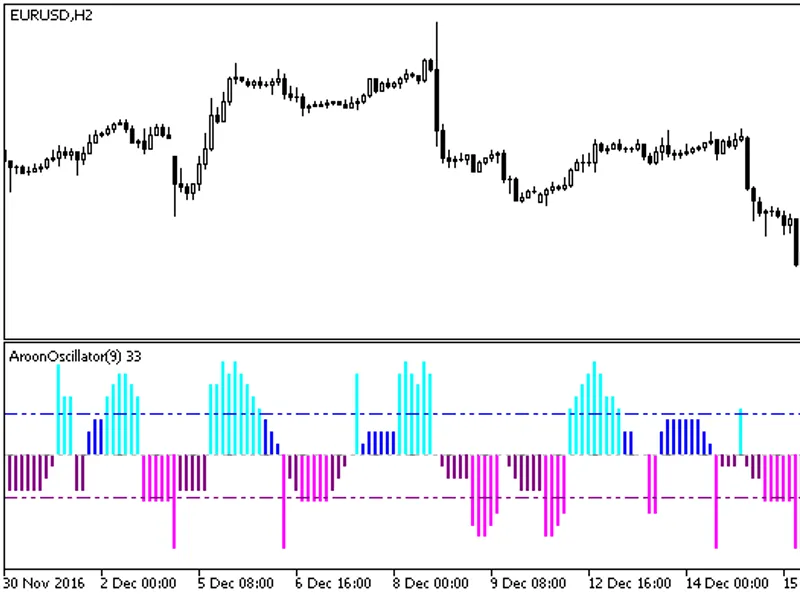
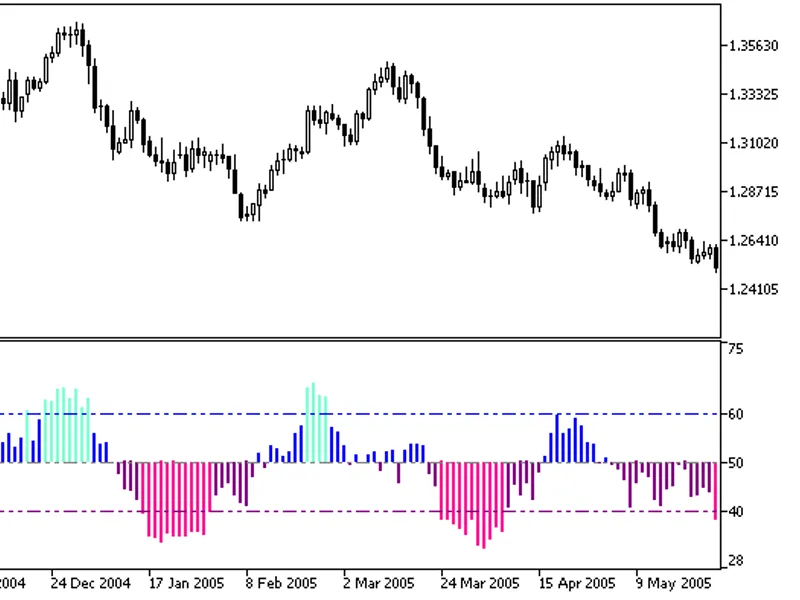
Relative Momentum Index implemented as a color histogram with an indication of overbought and oversold zones.RMI (Relative Momentum Index) was developed by Roger Altman and was fir...
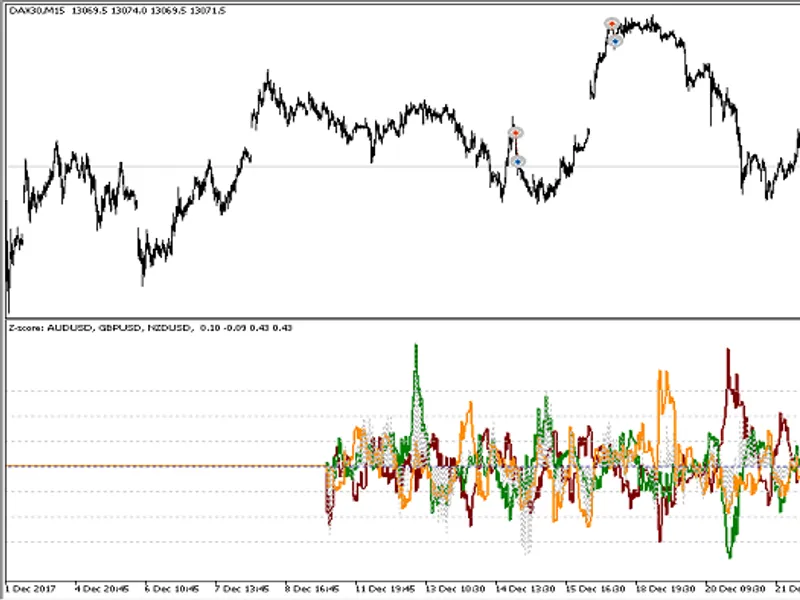
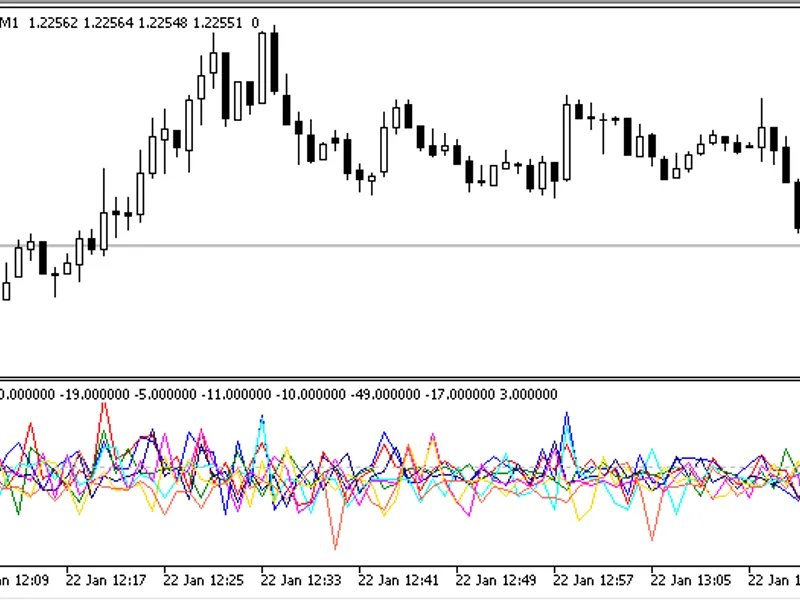
The indicator finds linear regression coefficients between each of the selected symbols and all other symbols, and displays them in the form of standard deviations. The sum of all ...
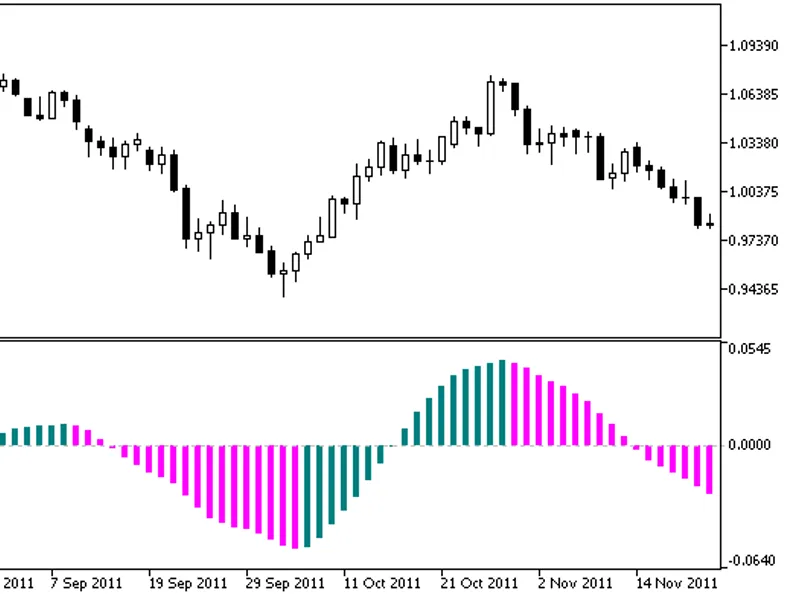
The smoothed S-RoC indicator of the relative price increment by Fred Shutsman.The indicator is calculated using the next formula:S-ROC= (EMA [bar] – EMA[bar - Roc]) / EMA[bar - Roc...
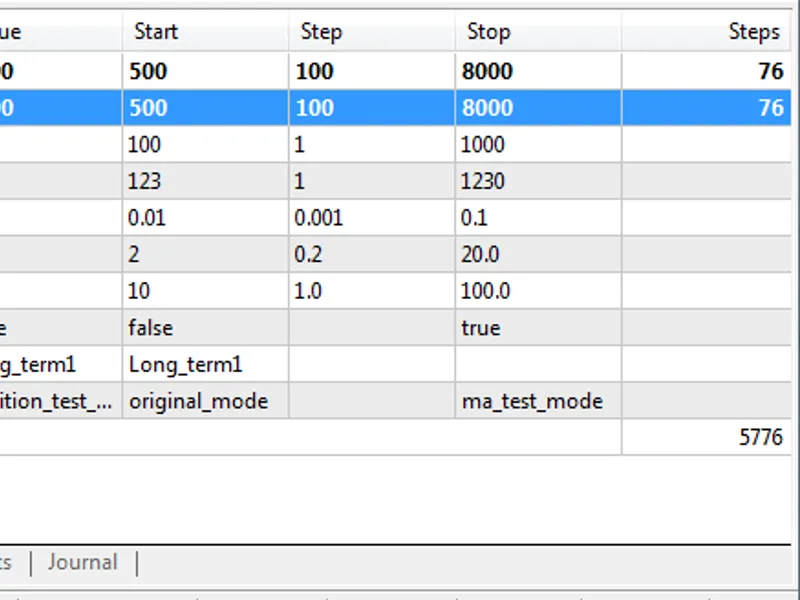
The Expert Advisor uses three iMAs (Moving Average, MA), one iOsMA (Moving Average of Oscillator and one iRVI (Relative Vigor Index, RVI). The EA can use either a fixed lot or a lo...
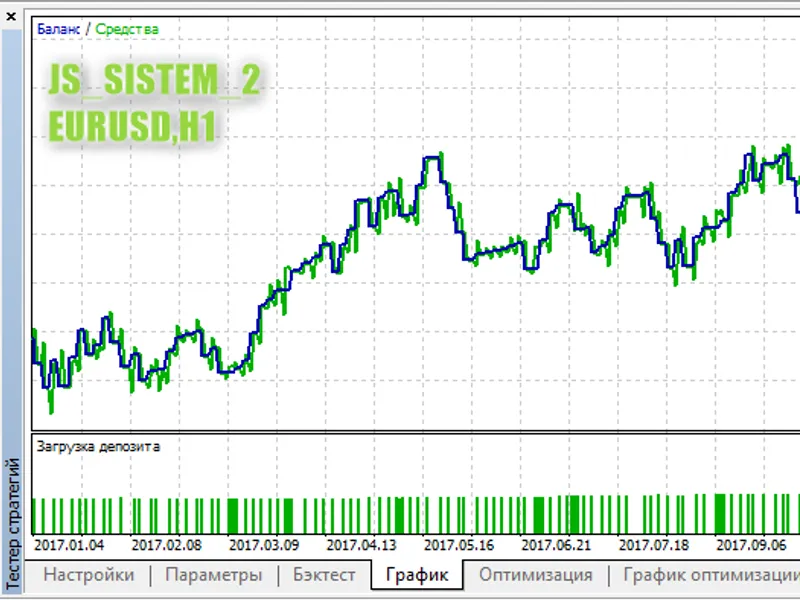
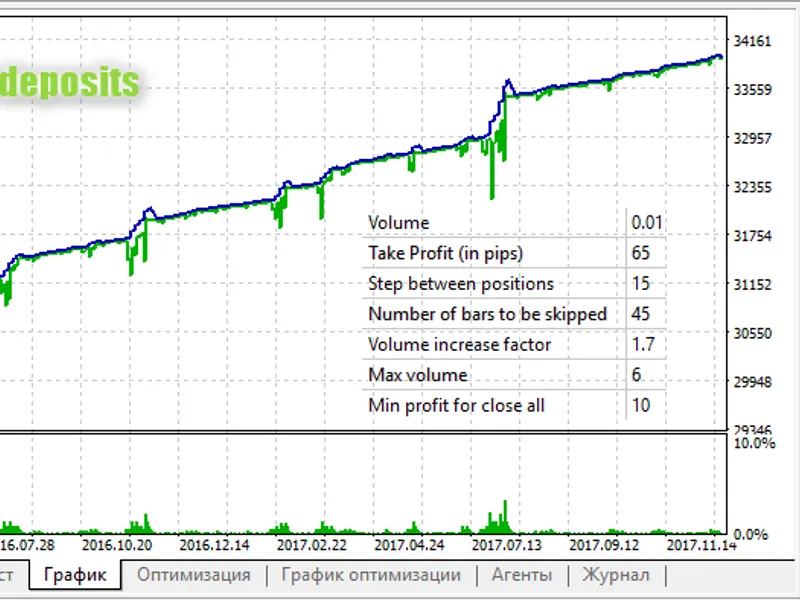
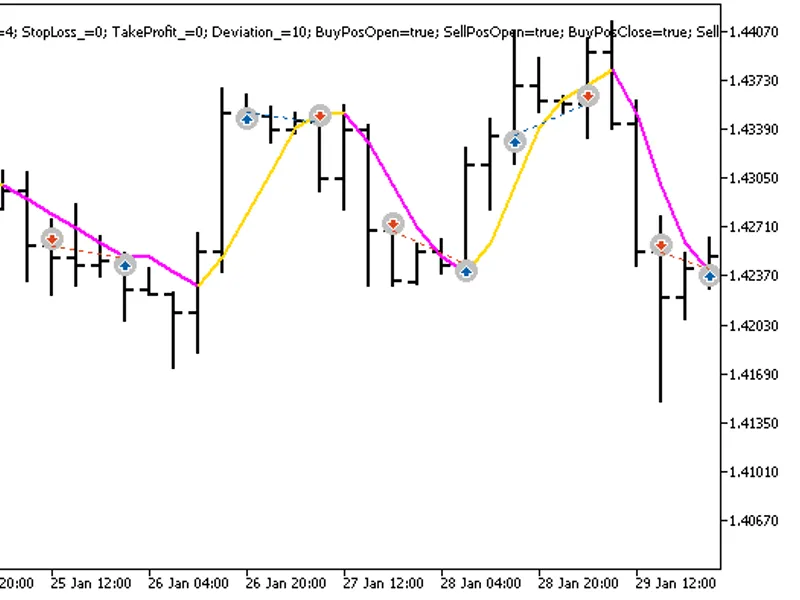
Martingale based Expert Advisor specially designed for small deposits. This feature is enabled through the configurable parameter "Number of bars to be skipped", which means skippi...
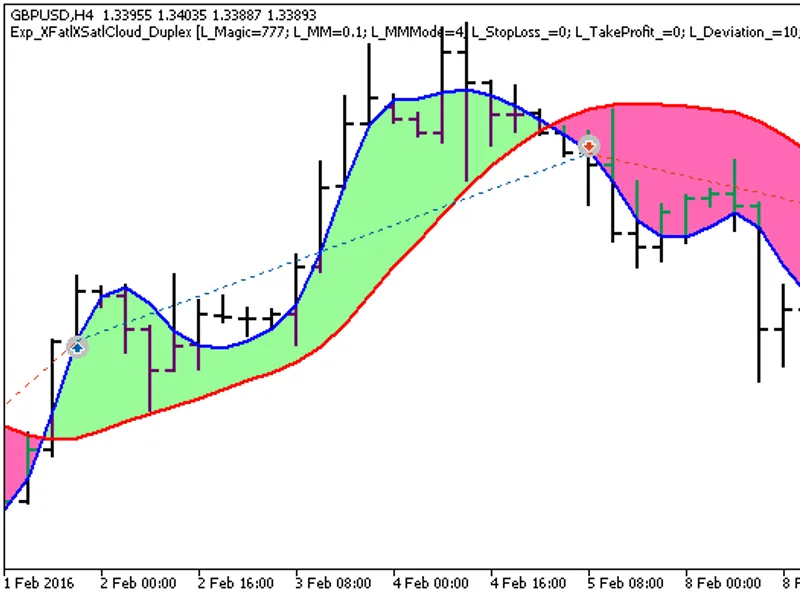
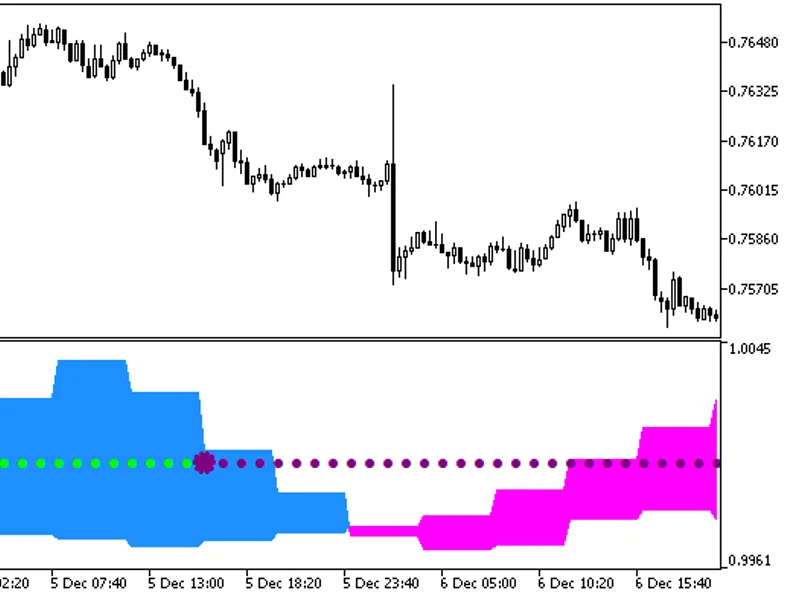
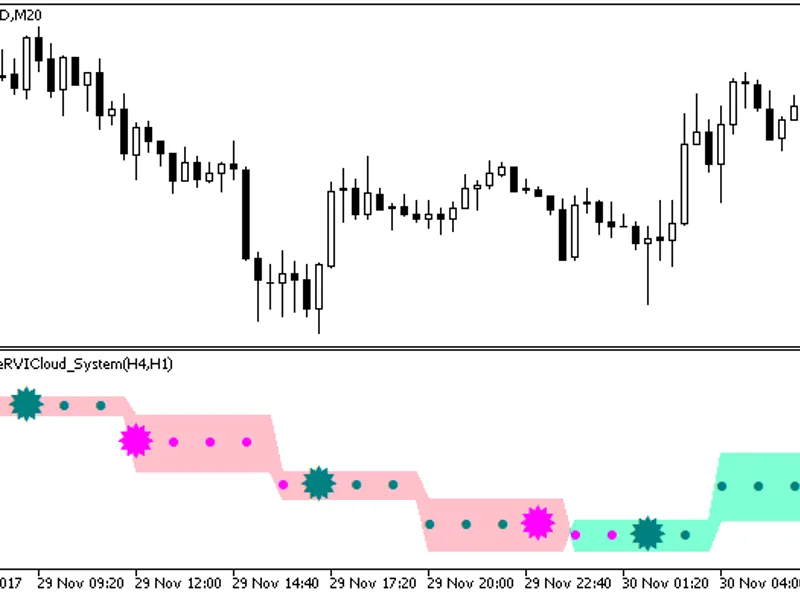
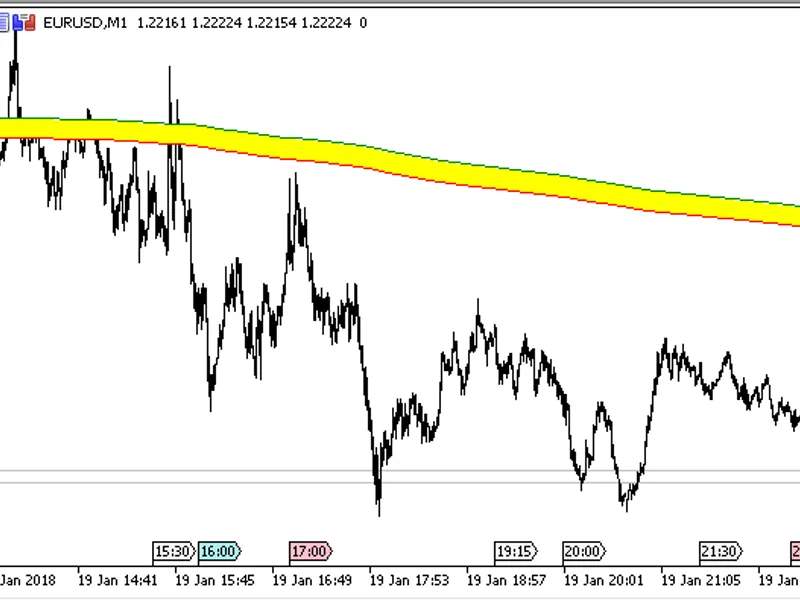
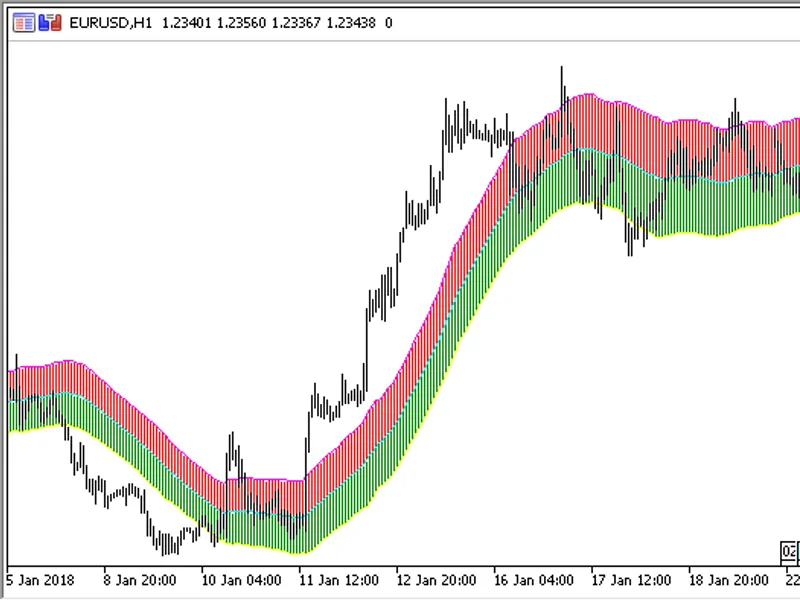
Two indicators from different timeframes on one chart. The indicator of a larger timeframe is displayed as a color trend cloud, which determines trend. The second indicator of a sm...
Two indicators from different timeframes on one chart. The indicator of a larger timeframe is displayed as a color trend cloud, which determines trend. The second indicator of a sm...
The Expert Advisor trades based on signals generated by the indicator:Position volume management: either fixed volume (the 'Lots' parameter should be greater than zero) or risk as ...
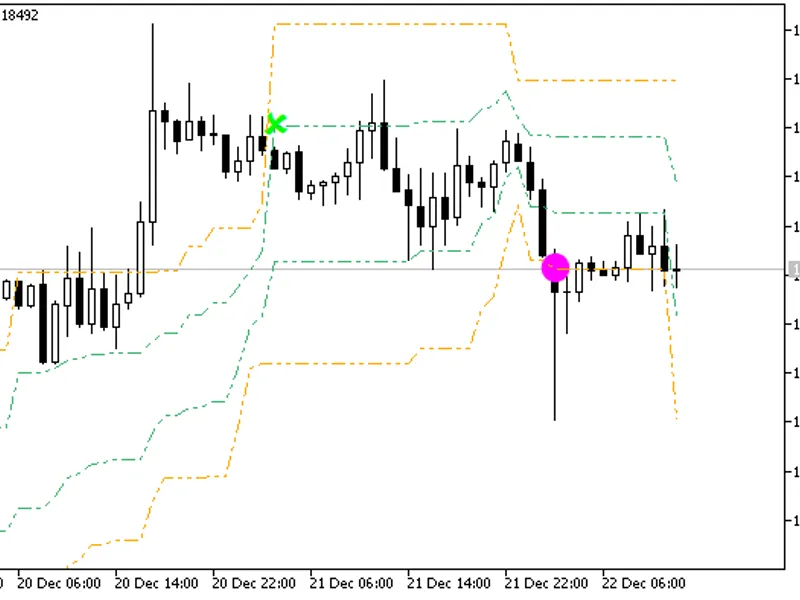
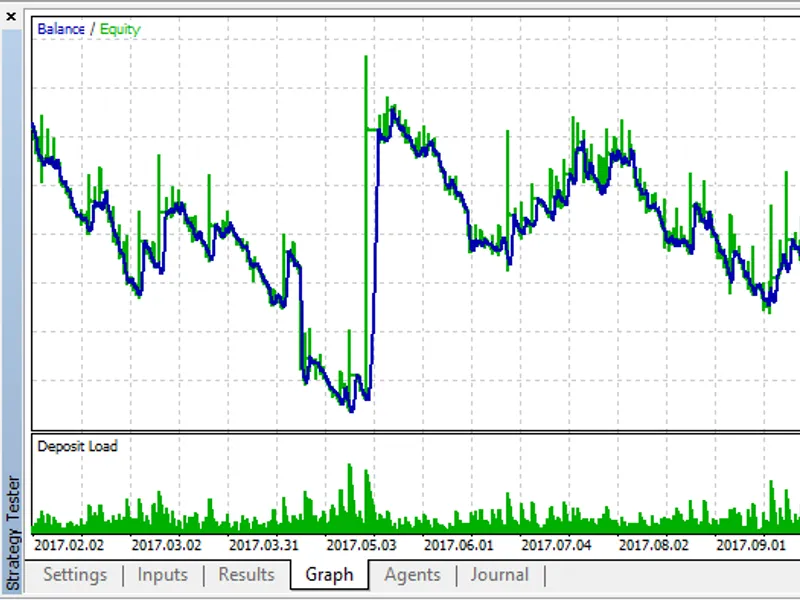
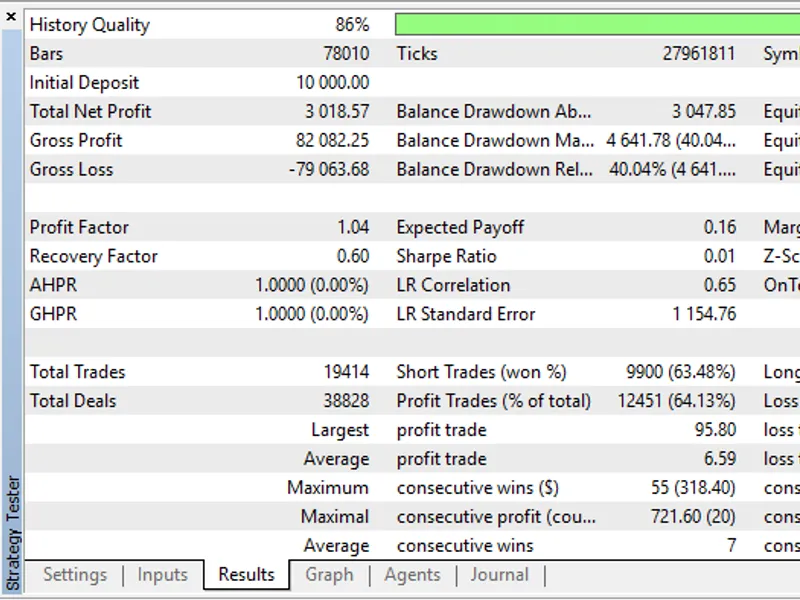
Installation Instructions Testing The purpose of this publication is to demonstrate the potential profitability of the ZigZagLW Addition indicator, which can be briefly described a...
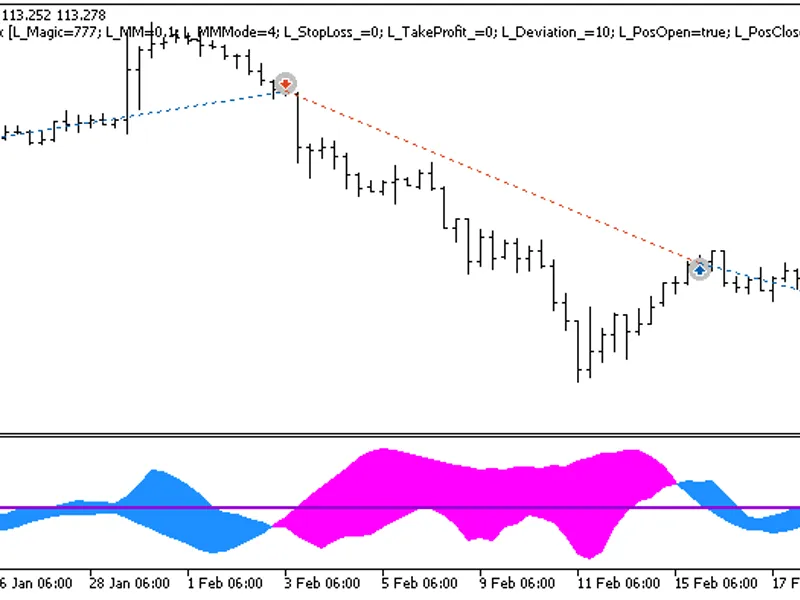
Two identical trading systems based on the change in the color of the indicator cloud for long and short trades, which can be configured in different ways in one Expert Advisor. Fo...
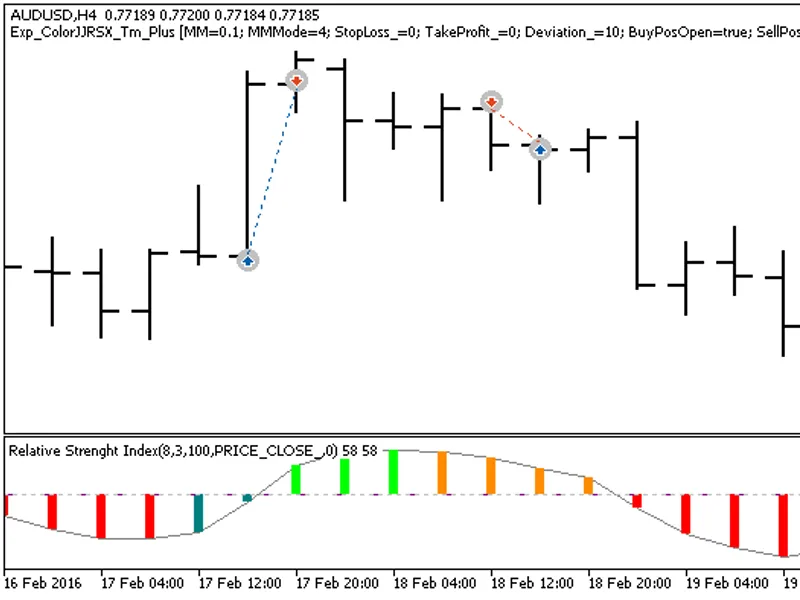
A trading system based on indicator signals with the possibility to set a fixed position holding time. A signal is formed at a bar closing moment, if the indicator color has change...
The Expert Advisor was inspired by the forum topic Requests & Ideas (MQL5 only!), comment .Description of the System The Expert Advisor only performs actions on a new bar (calc...
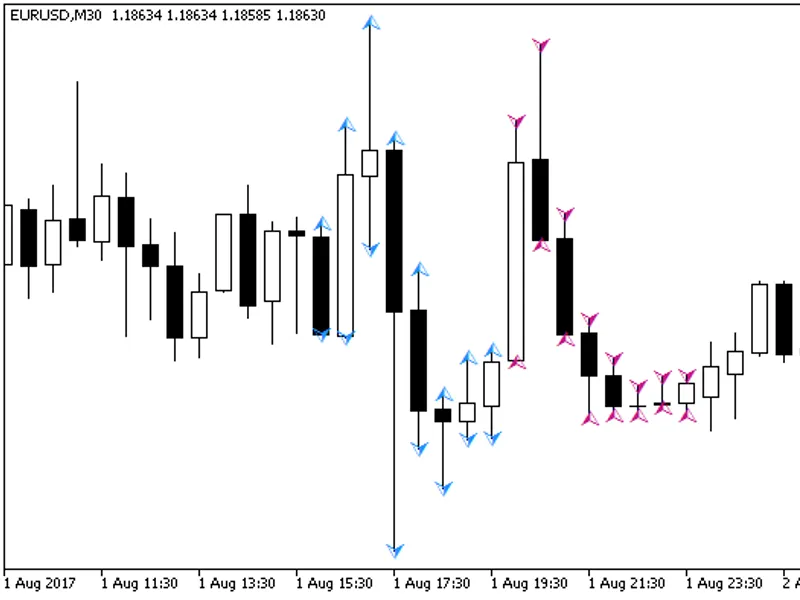
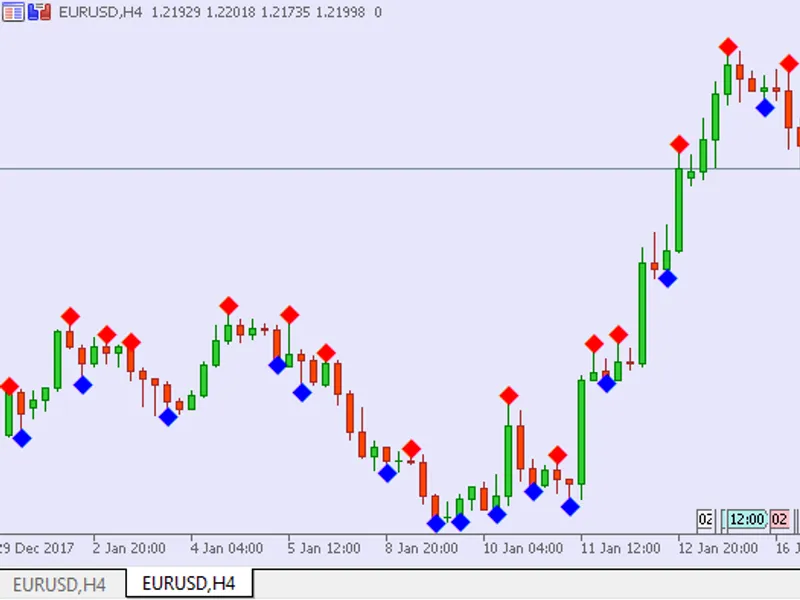
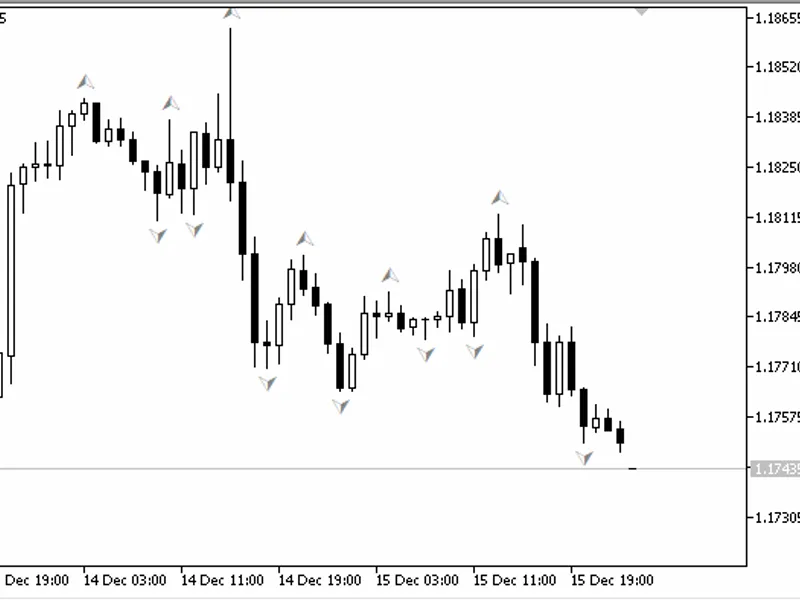
The indicator marks candlesticks with colored arrows if candlesticks of a higher timeframe selected in input parameters are higher or lower than previous candlesticks. It should be...
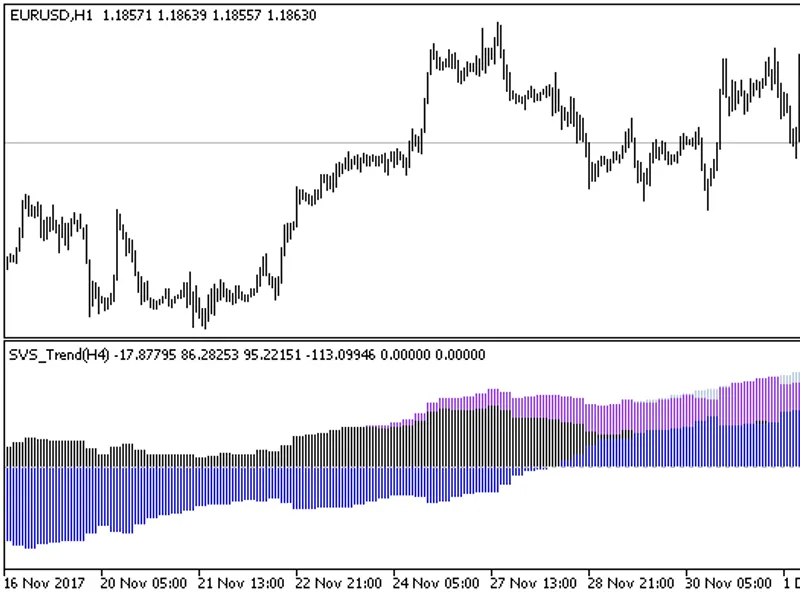
The indicator with the possibility to change the indicator timeframe in its input parameters:The indicator requires the compiled SVS_Trend.ex5indicator file. Add it to <terminal...
The indicator implemented in the form of a colored histogram.The indicator uses SmoothAlgorithms.mqhlibrary classes (copy it to <terminal_data_folder>\MQL5\Include). The deta...
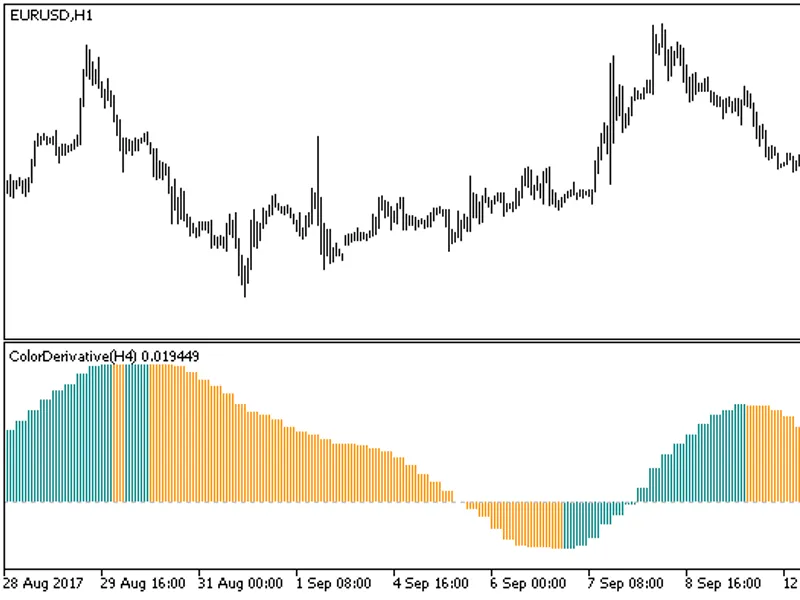
The indicator with the possibility to change the indicator timeframe in its input parameters:The indicator requires the compiled ColorDerivative.ex5indicator file. Add it to <te...
A trading system based on indicator signals with the possibility to set a fixed position holding time. A signal is formed at the close of a bar, if the direction of the indicator m...
This universal script can run both on hedging and netting accounts.The script divides the report into two stages:The first stage includes existing current positions and deals, whic...
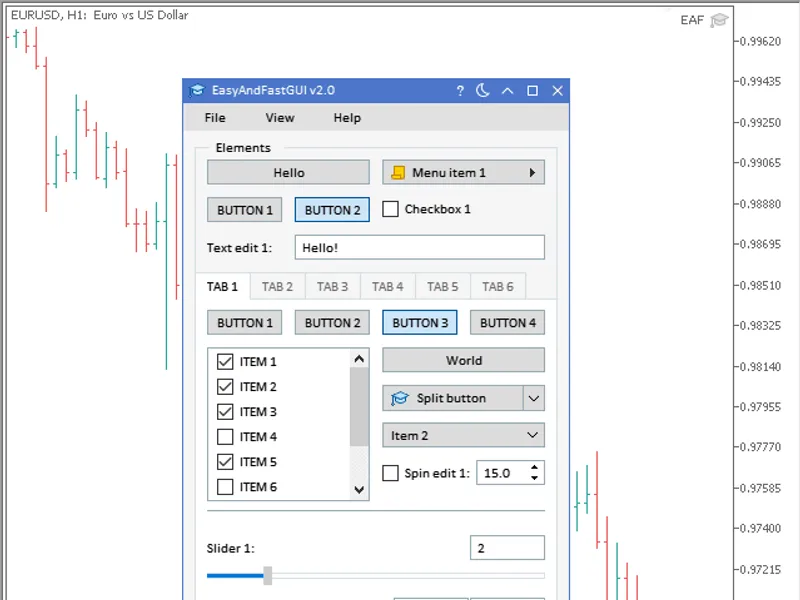
EasyAndFastGUI v2.0 This library contains the necessary set of elements that can be used when developing MQL-applications with a graphical interface.What's new? Integrated a new e...
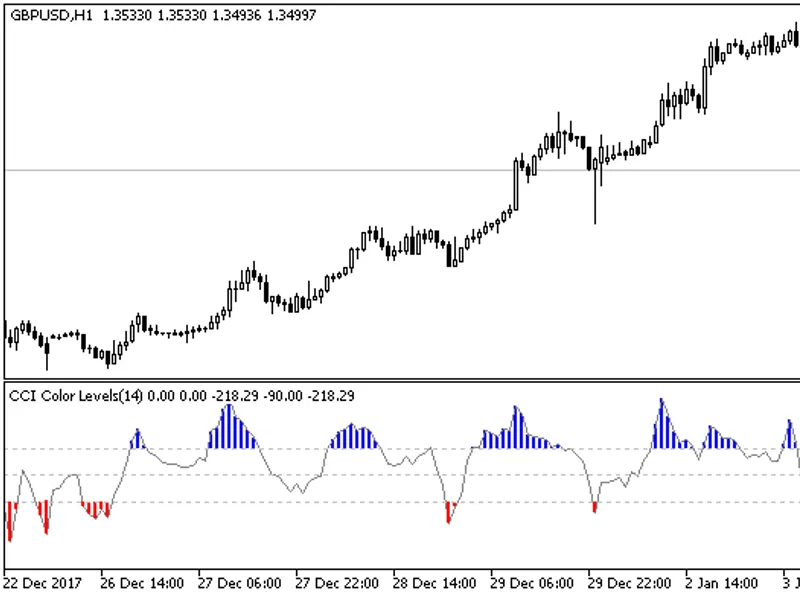
The indicator looks like this:Three types of graphical constructions were used for this visual effect:("Level UP"); ("CCI"); ("Level DOWN"). Indicator Input Averaging period- ind...
Works on a new bar. The nearest vertex of the ZigZag indicator is found:Vertex at the bar High means a signal to open BUY and to close all existing SELL positions. Vertex at the ba...
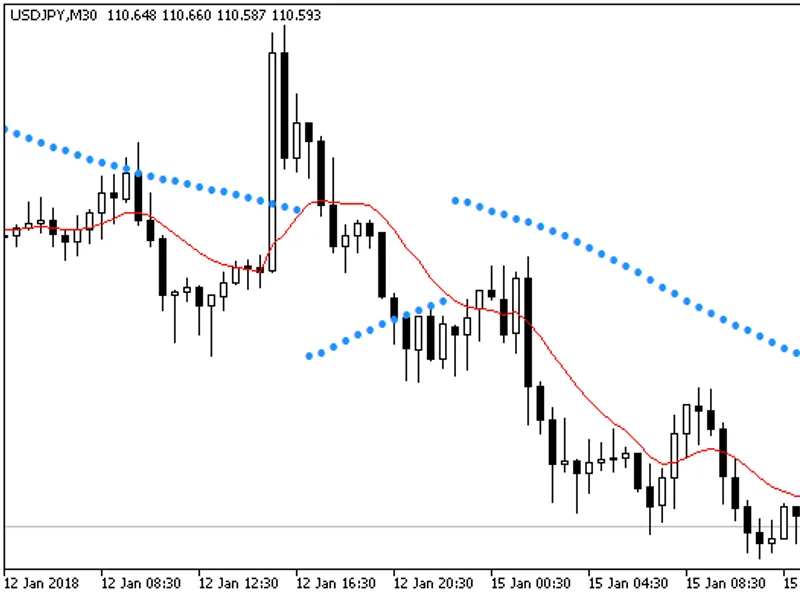
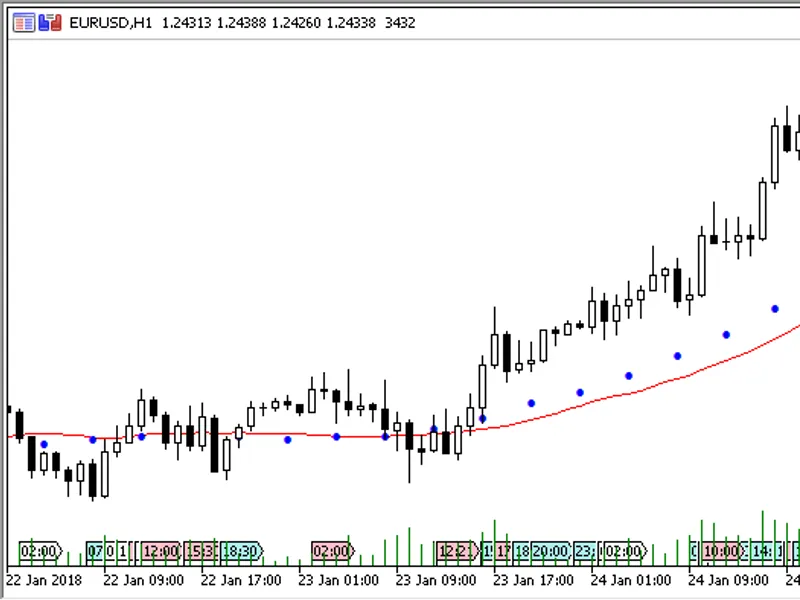
The idea of this indicator is to replace the High and Low prices with the Moving Average indicator values when calculating the SAR indicator.The result is shown below:That is, di...
The Expert Advisor is only designed for manual trading. The EA sets stop loss and take profit for positions and pending orders on the current symbol. It also has trailing stop and ...
The indicator searches for fractals with arbitrary dimensions: 1x1, 2x2, 3x3, ... NxNIt has only one input parameter:Frames- the number of bars to the right and left of the central...
The indicator searches for candlesticks, which are larger than the specified size, and marks such candlesticks on the chart. It can also show an Alert message, once the current can...
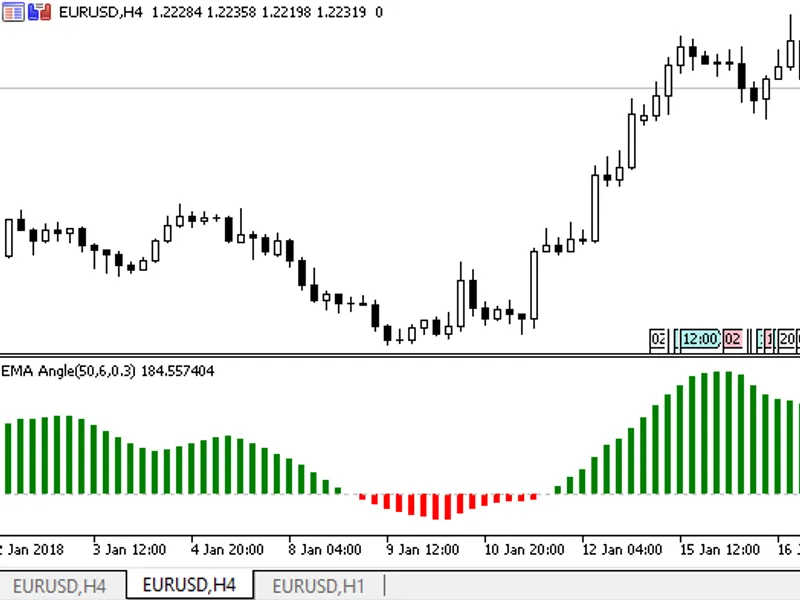
A simple oscillator. Shows the difference between two exponential Moving Averages in the form of a colored histogram drawn in a separate window.There are three adjustable parameter...
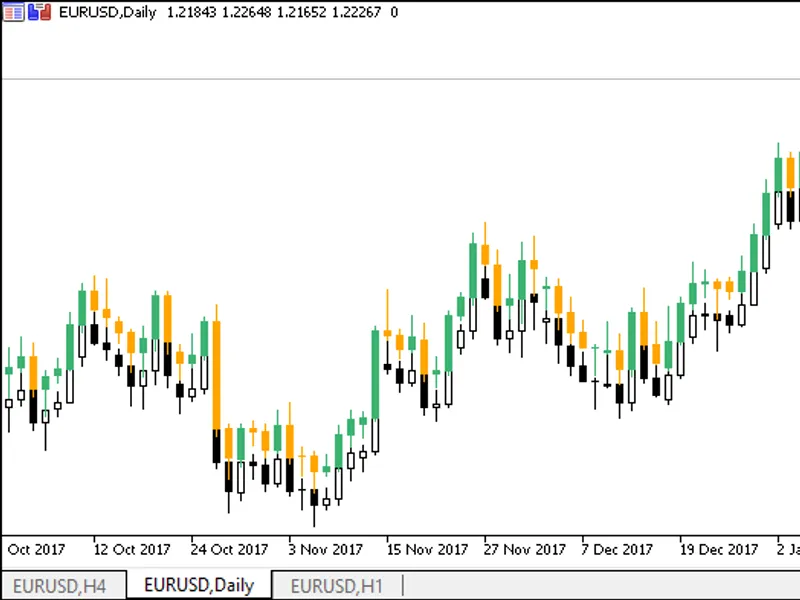
The indicator allows customizing the day beginning hour, the vertical shift of candlesticks, as well as colors of bullish, bearish and doji candlesticks.It has five input parameter...
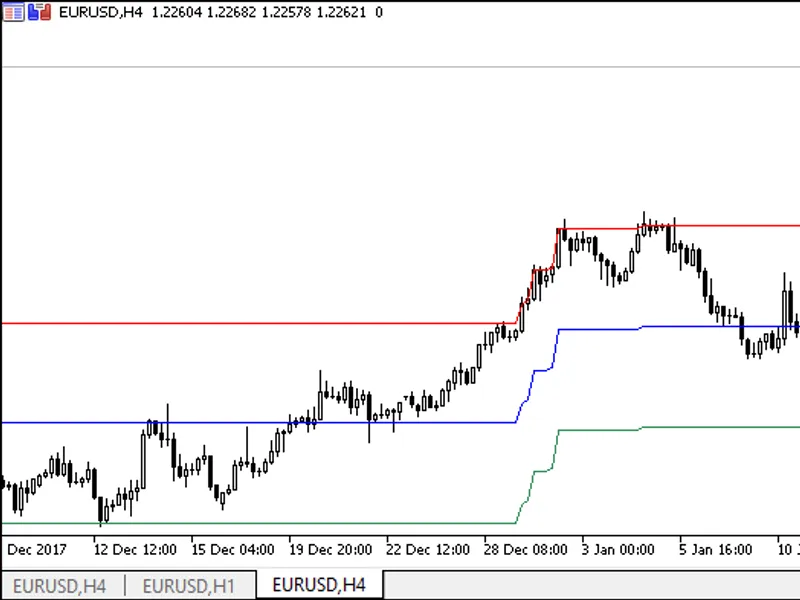
The indicator has only one adjustable parameter, which indicates how long the previous channel high and low borders should be shown.Length of levels- the length of channel borders....
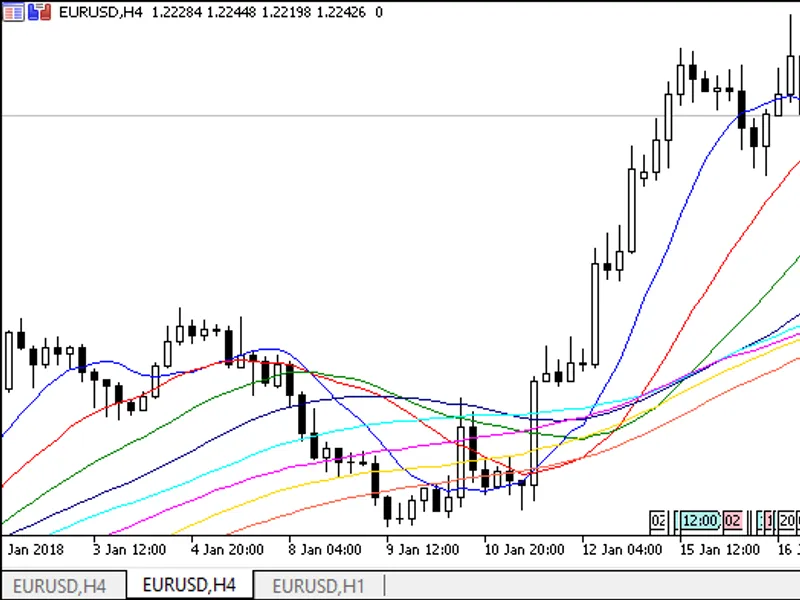
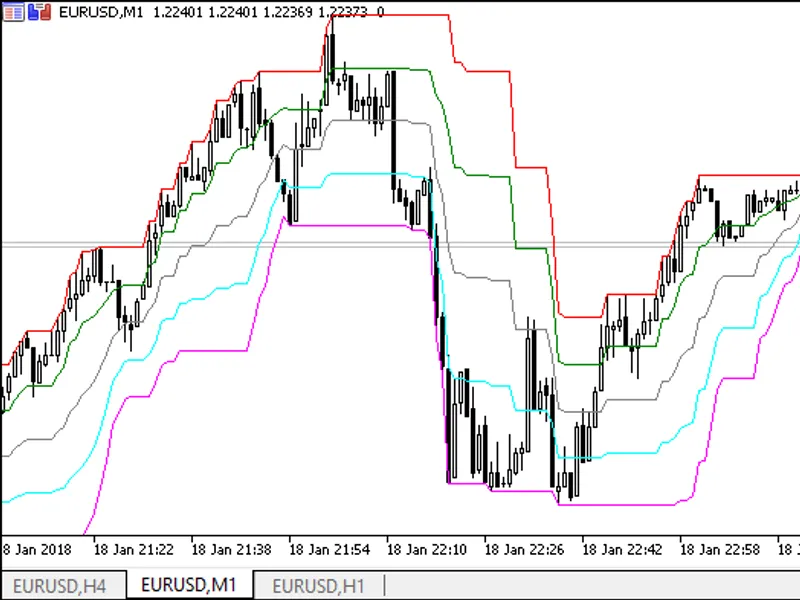
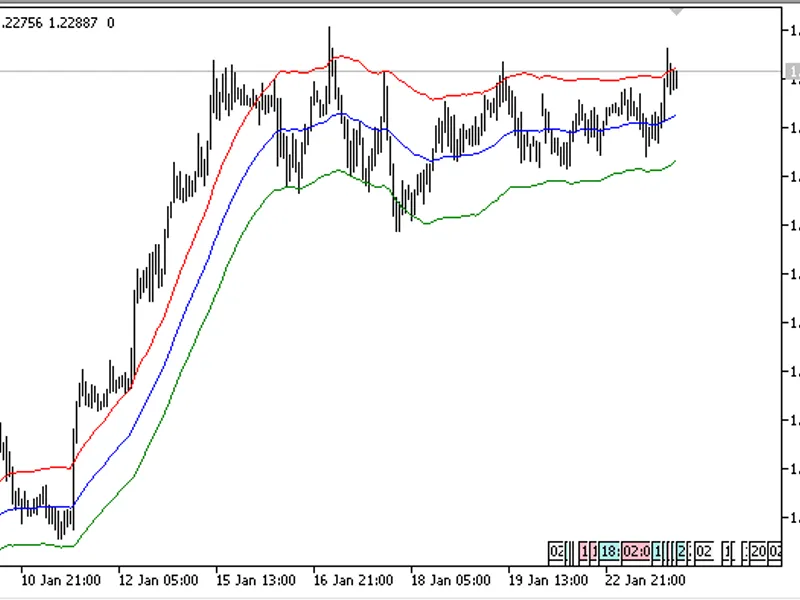
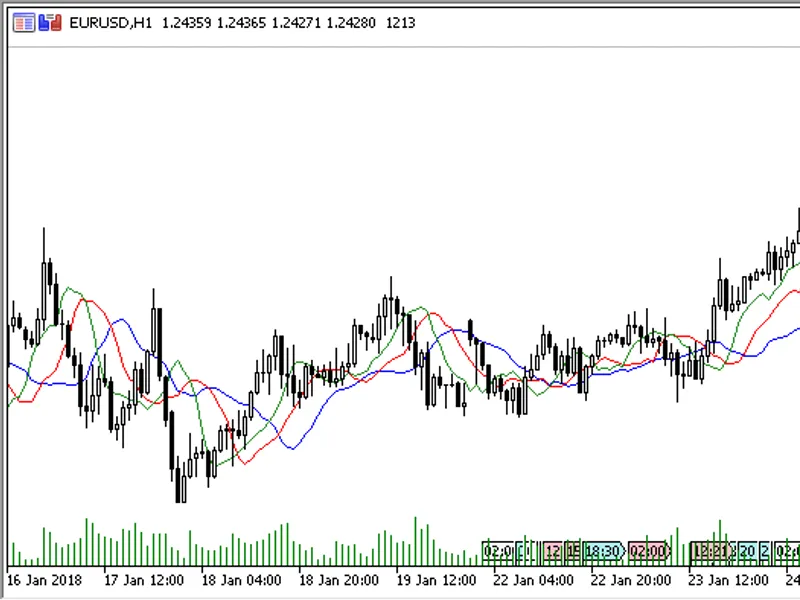
The indicator displays a set of eight Moving Averages. It allows setting methods and calculation prices for all MAs at a time. An individual calculation period is set for each movi...
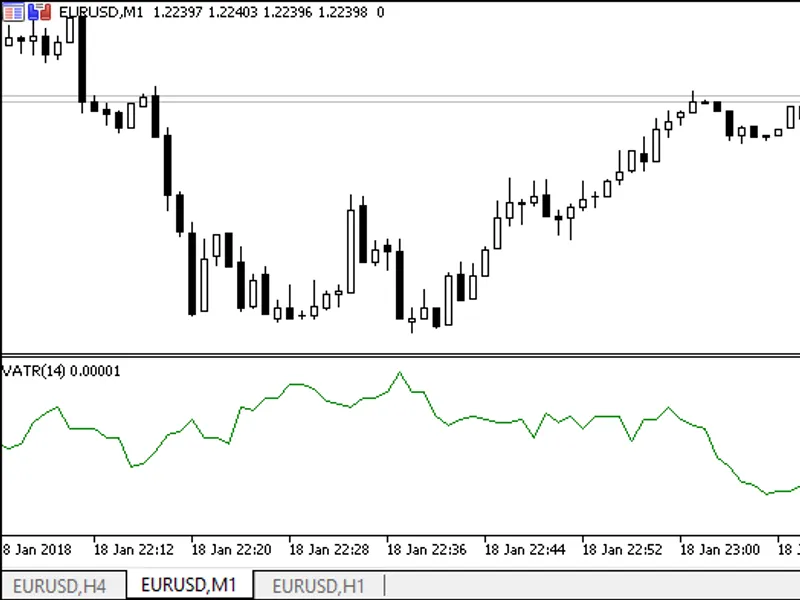
Custom ATR. The indicator values are calculated based on the current day's High-Low and current day's High - previous day's Close or current day's Low - previous day's Close.There ...
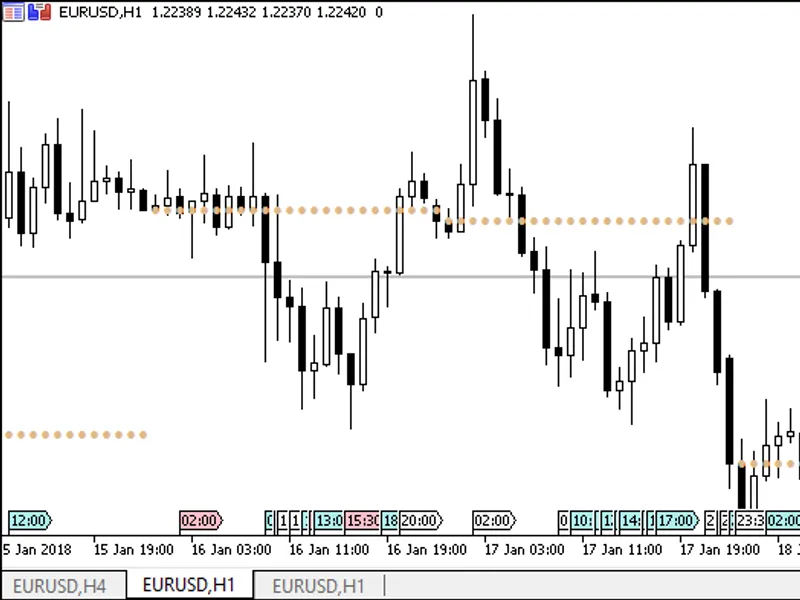
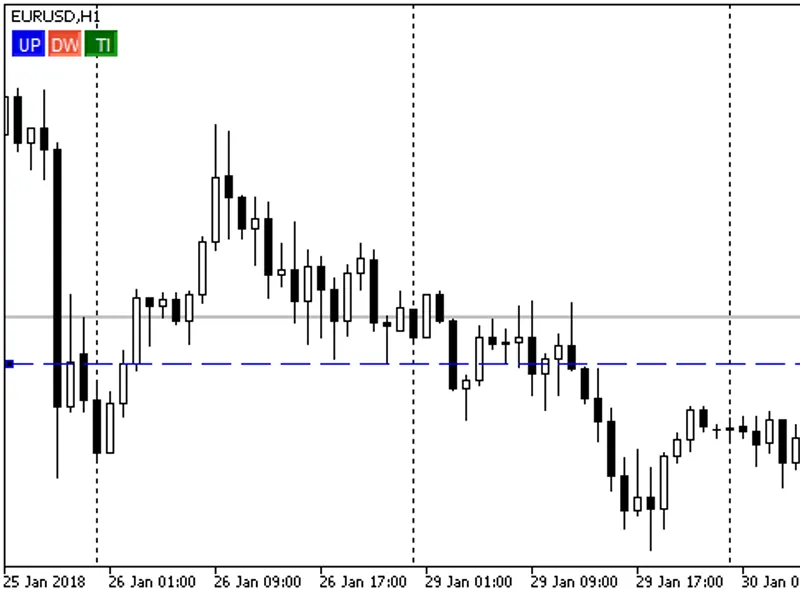
Daily Open Line. The indicator draws a line from the beginning of the day on charts with the timeframe of H1 or below. The day beginning hour can be set in input parameters.It has ...
The channel is based on one of seven price types that can be selected in input parameters. If the price has moved from the previous day's value at a distance greater than the speci...
VolMA draws a moving average, the period of which is calculated by RSI, which is based on tick volume data.The indicator has four input parameters:RSI Vol Period- the period of RSI...
The channel is calculated dynamically on each bar within a day. You can enter the hour and minute for the trading day beginning.The indicator has two input parameters:Hour of the b...
It is calculated as follows:The calculation is based on a moving average with a preset period, method and calculation price.The indicator has four main input parameters:Period of M...
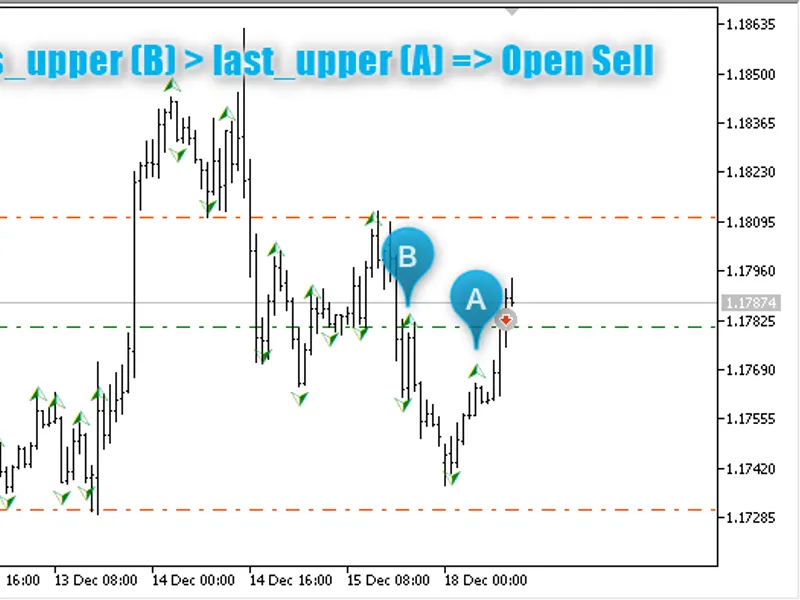
The Expert Advisor is based on the channel indicator .The strategy is simple:If the close price of the candlestick specified in settings (1 by default) is above the upper channel b...
The "Fractals at Close prices" indicator only uses Close prices in calculations. The indicator was used in the creation of the .Comparison with standard fractals:Gray icons show st...
The VR Alert NT5 indicator warns the trader about the price reaching a specified level.The indicator has been developed as an assistant when you wait for a breakout of an important...
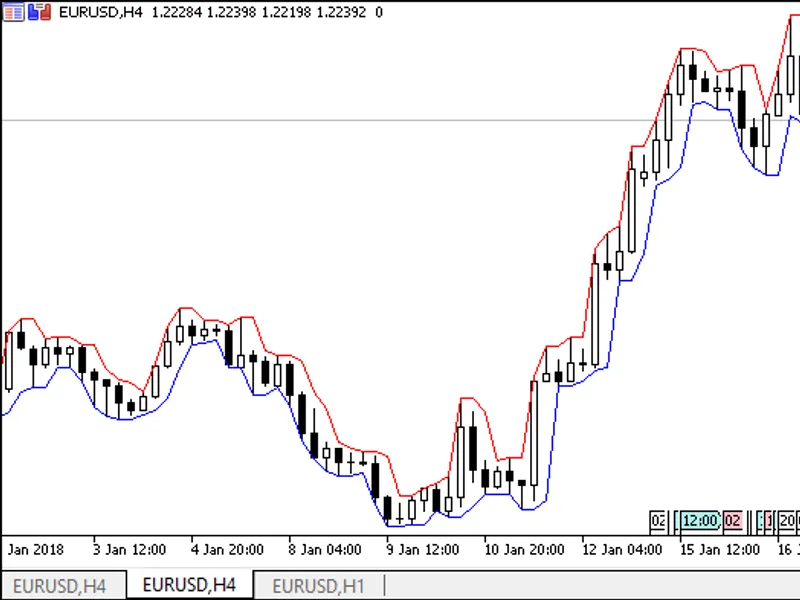
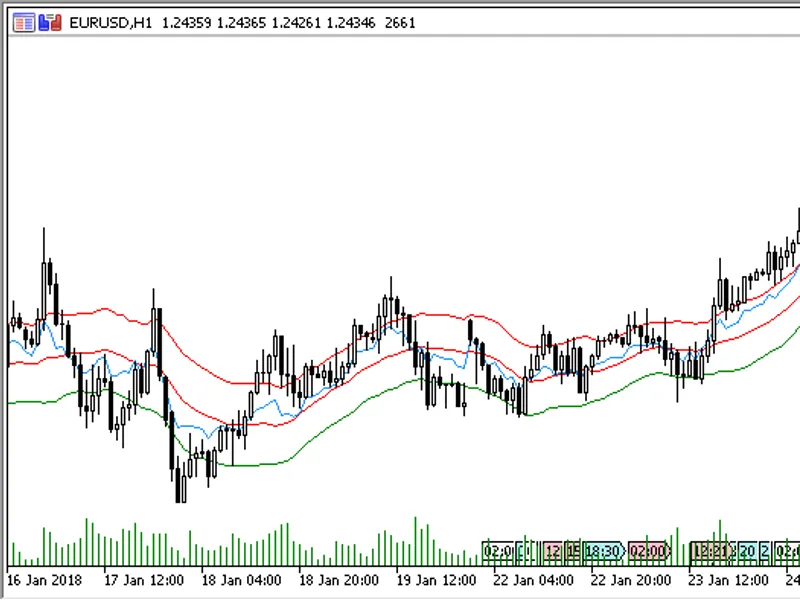
The indicator draws the Keltner Channel, which can be calculated using SMMA, EMA and LWMA. Channel borders are calculated based on High-Low or ATR.Smoothing periods for the central...
The Expert Advisor trades based on the indicator . Compile the indicator and add it to [data folder]\MQL5\Indicators\.Configuring time interval for trading:Intraday trading (Start ...
It allows setting any price and calculation method for the central line. The channel lines are calculated based on ATR.It has five input parameters:Number of the periods to smooth ...
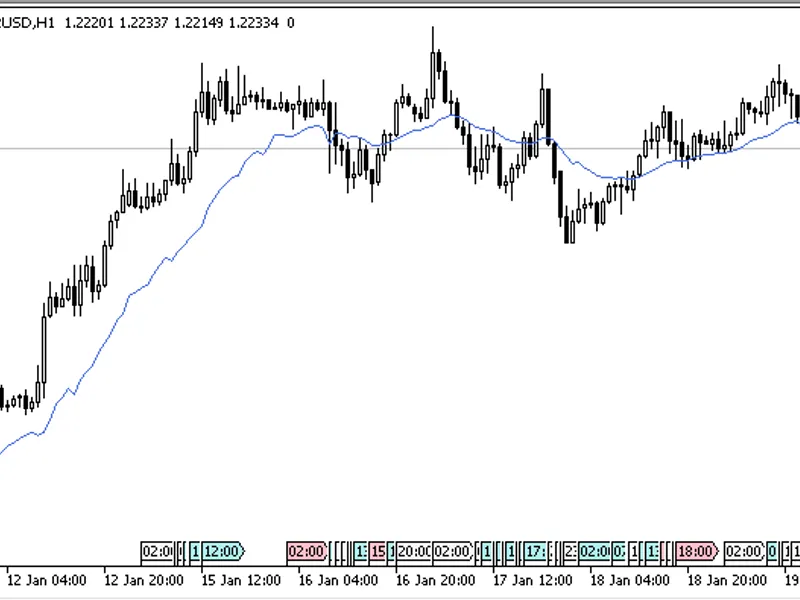
The indicator shows on one chart two simple moving averages from two timeframes: from the current one and the one specified in input parameters.It has two parameters:Period MA- Mov...
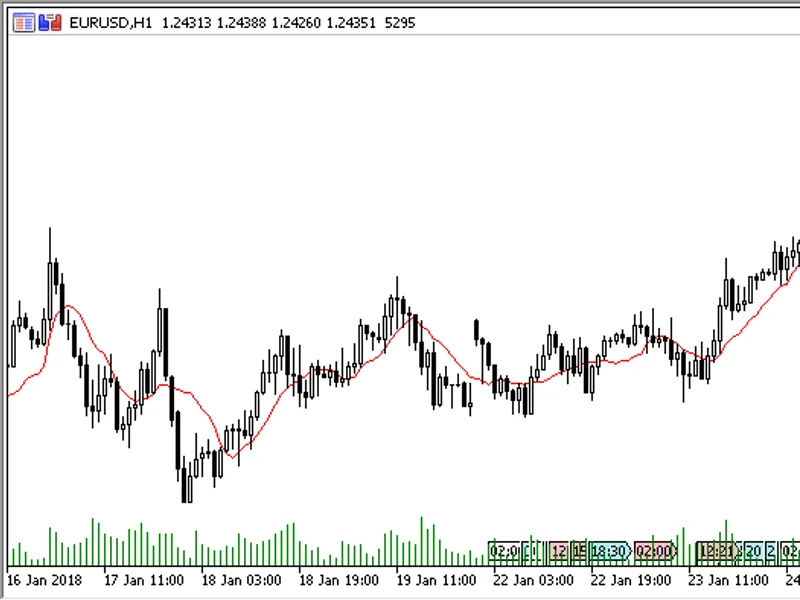
The indicator draws a Simple Moving Average, which is constructed taking into account tick volumes of each bar.It has two parameters:Period VAMA- SMA calculation period;Applied pri...
The Alligator indicator based on the indicator.It has seven adjustable parameters:Period of Jaws line- period of Alligator's Jaws line;Shift of Jaws line- shift of Alligator's Jaws...
The indicator shows on a price chart the standard RSI, its overbought/oversold levels and the Moving Average indicator line, relative to which overbought/oversold levels are drawn....
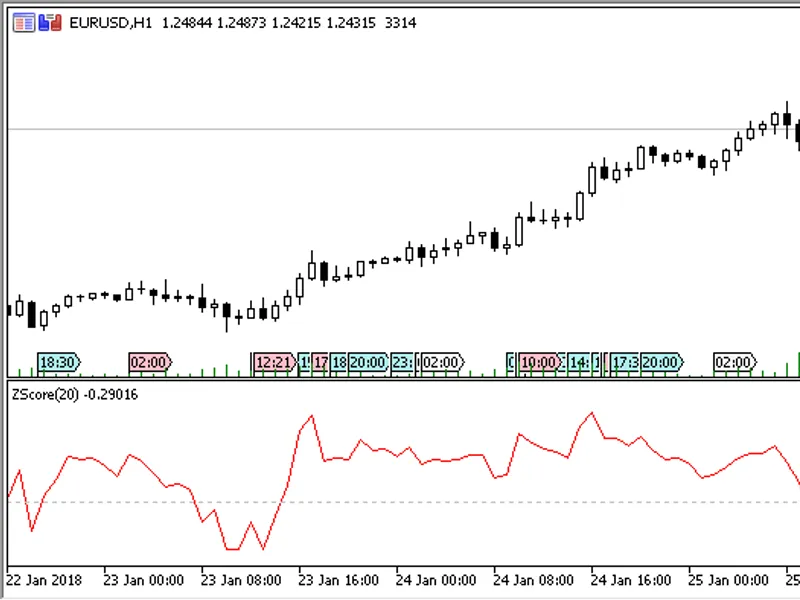
Standard score(z-score) is the number of standard deviations by which the observed or measured value differs from its mean value. Thus, the indicator displays the value of price de...