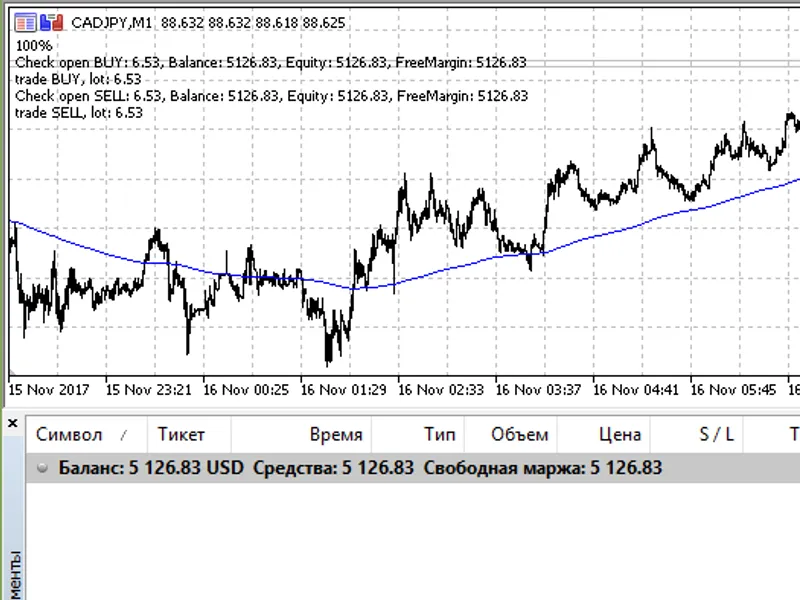
The Expert Advisor shows the calculated lot depending on risk settings.Input Parameter Risk in percent for a deal from a free margin. Example (for 100% risk):...
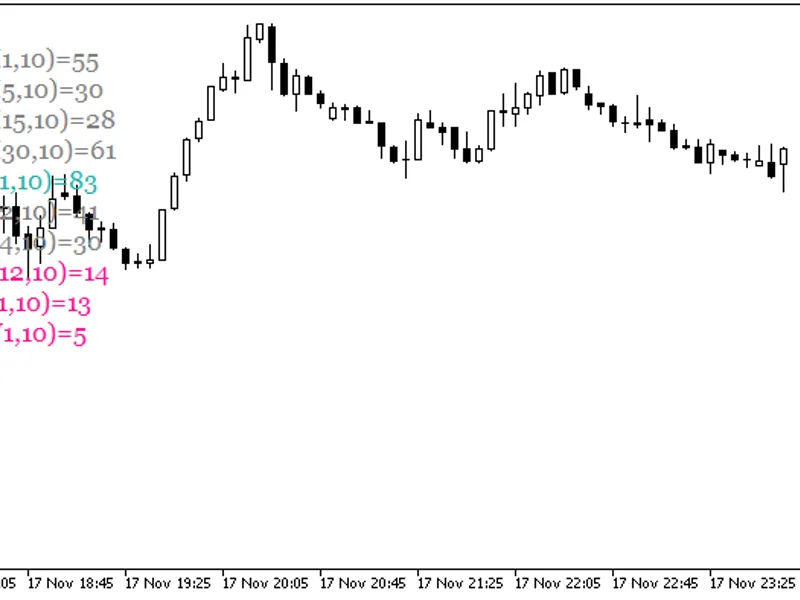
The indicator shows a text block with the values of the user defined period for each timeframe. The size of the text block is customizable. You can also change the text font and ...
Many Expert Advisor have been created based on the idea of the martingale.This Expert Advisor allows testing classical martingale operating principles, as well as the anti-martinga...
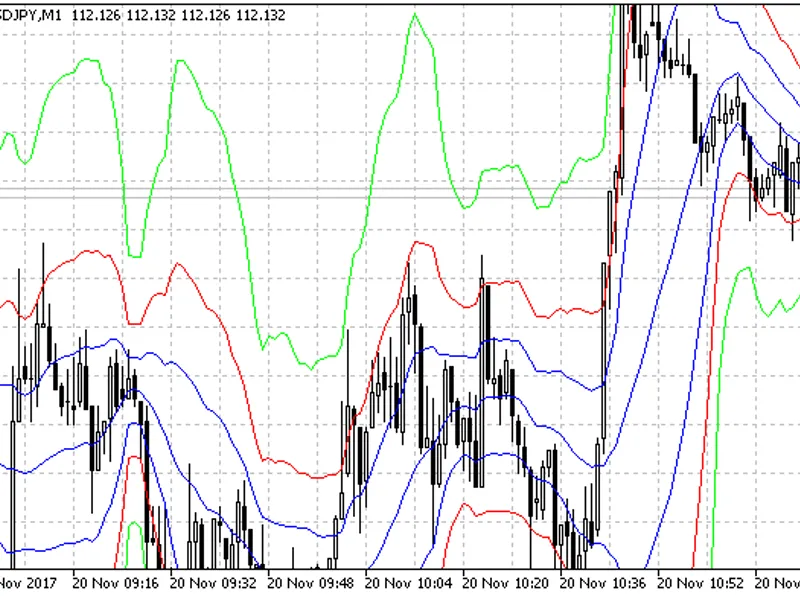
The strategy uses three main Bollinger Bands indicators: red for "Bollinger Bands: number of standard deviations" specified in parameters, yellow for "Bollinger Bands: number of st...
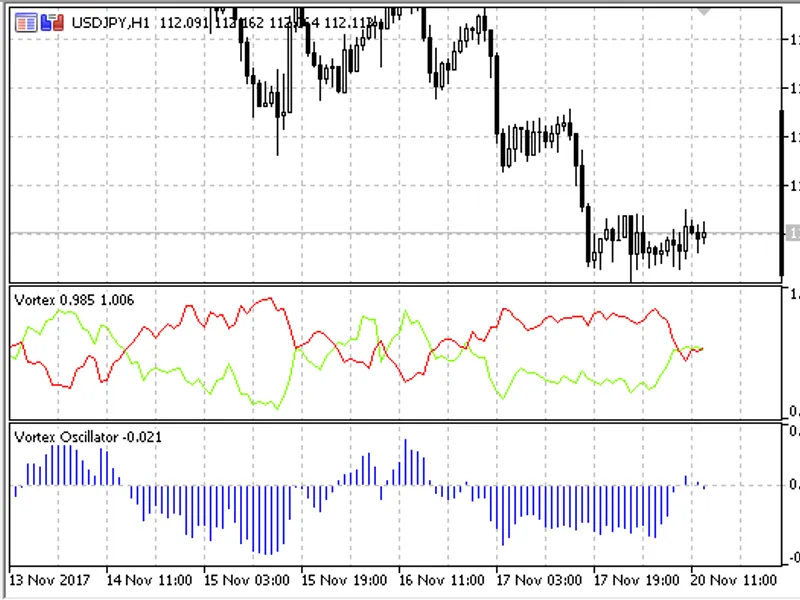
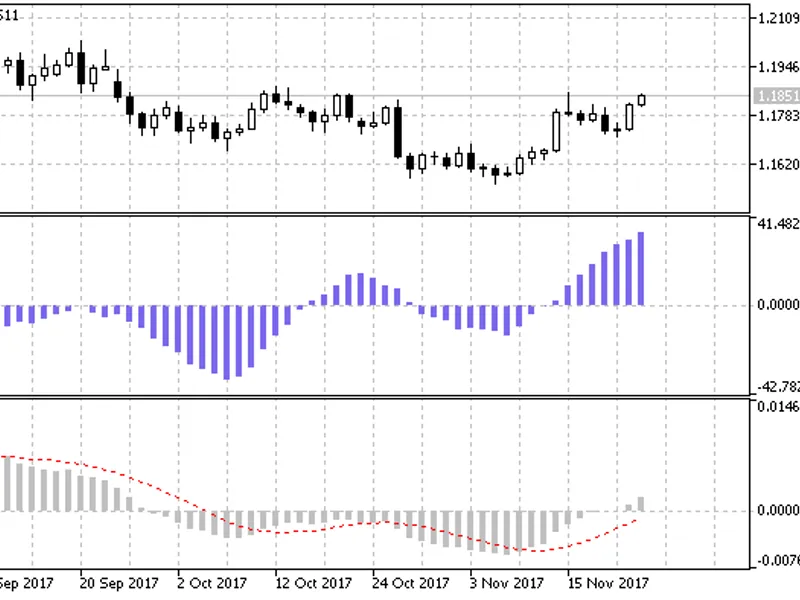
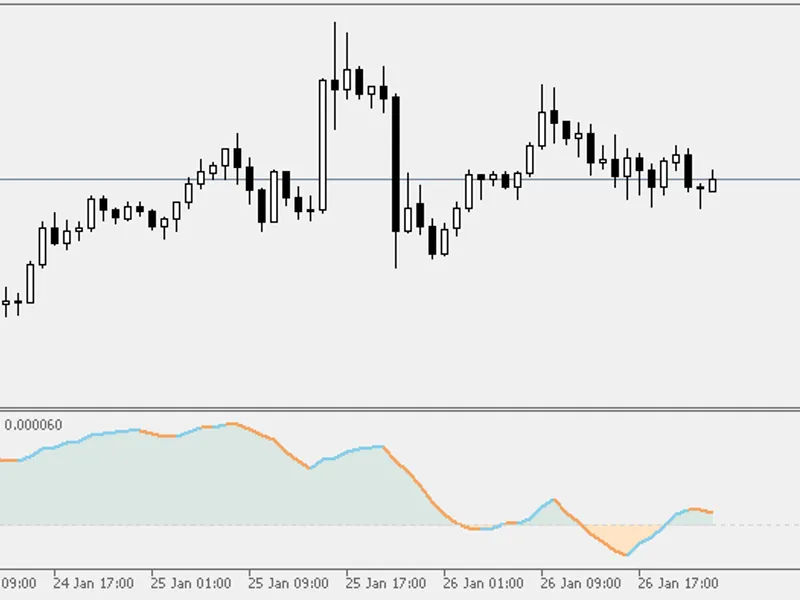
This oscillator based on the indicator shows the difference between the VI+ and VI- lines as a histogram. The figure below shows two indicators - the original Vortex and Vortex Osc...
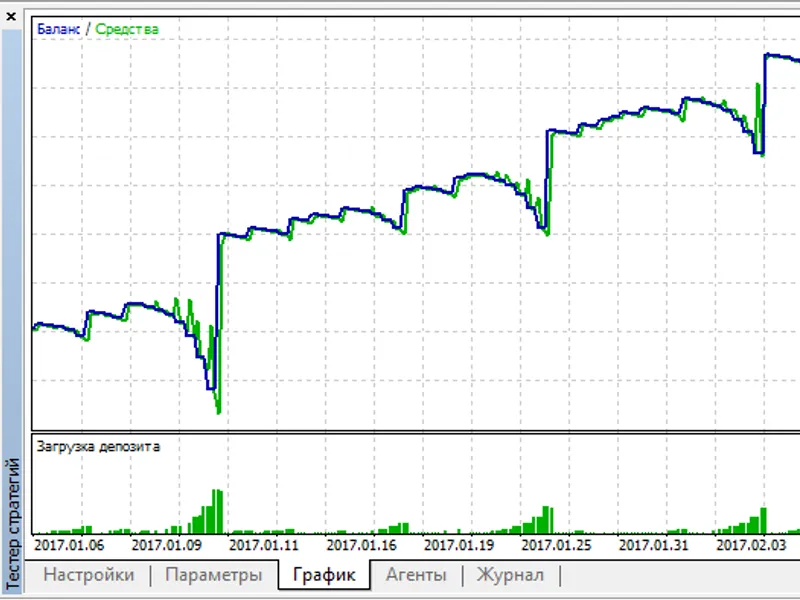
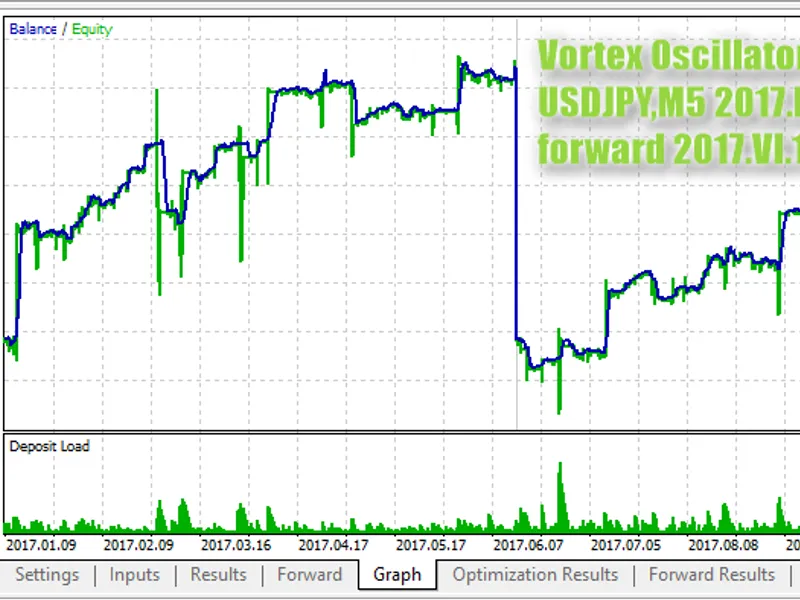
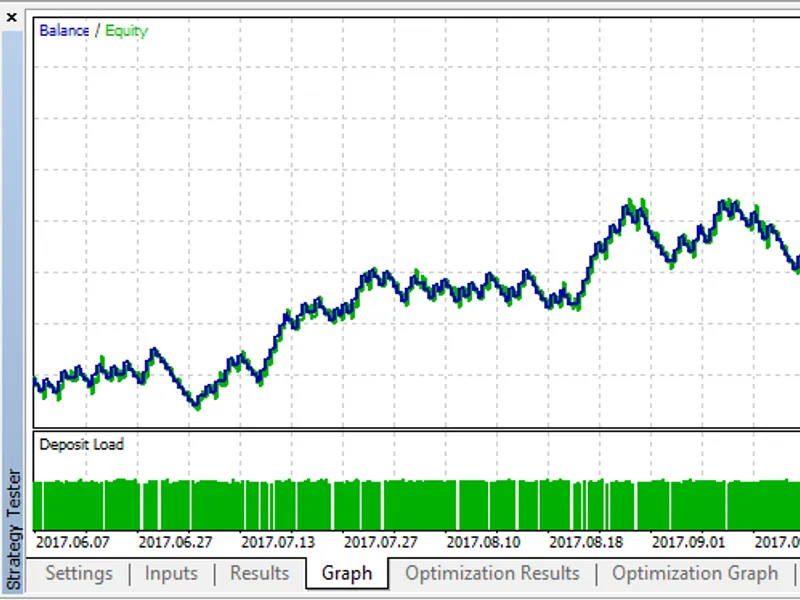
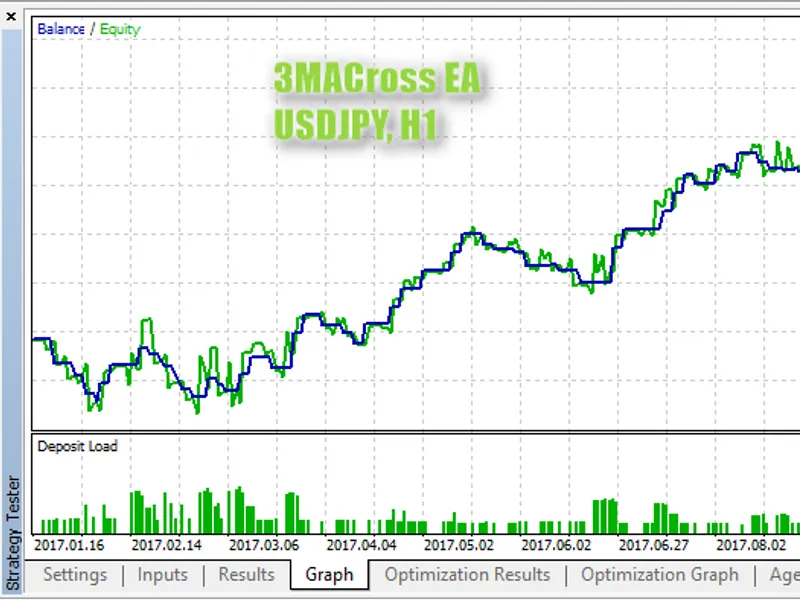
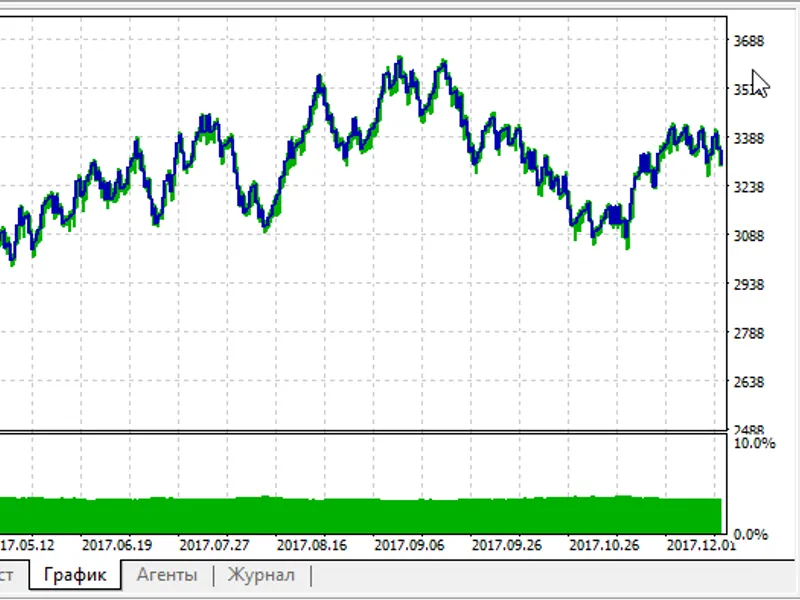
A trading system based on the signals.Attention! In order to provide conditions for the EA operation, you should add the compiled file to [data folder]\MQL5\Indicators Backtest res...
Warning! High risks!A trading system based on the Martingale technique. Opening of new positions can be limited in time, but the EA always controls position closing based on the to...
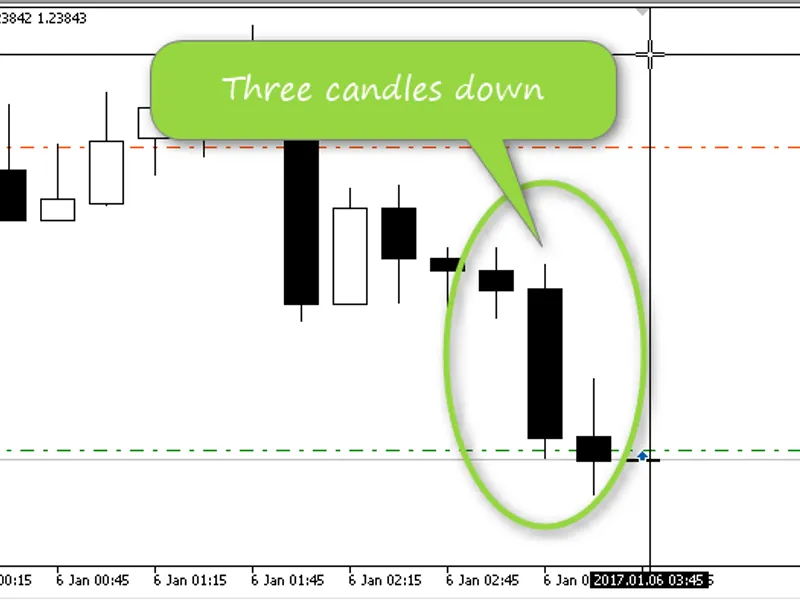
The main idea of the trading strategy is as follows: when there are three down bars on the current timeframe:and the main Stochastic line is above the signal line on the other tw...
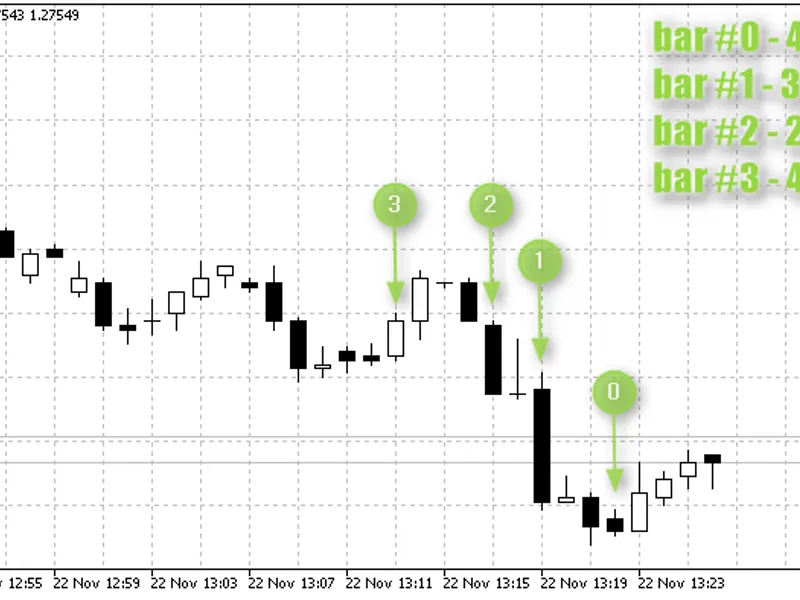
The Expert Advisor trades based on and signals. Values of iMA on four bars are compared. Indices of these bars can be optimized. The bar index is specified as a shift from the prev...
Calculation principle MaxHigh (the highest high) and MinLow (the lowest Low) are determined in the specified KdjPeriodinterval. Thus, MaxHigh minus MinLow will be equal to the heig...
Warning! In order to provide conditions for the EA operation, you should add the compiled file to [data folder]\MQL5\Indicators Input Parameters KDJ: M1- the M1 parameter of the KD...
Breakout of the daily bar at the distance of "Daily Break" points.Input Parameters Lots manual- enable/disable manual setting of lot value;Lots- position volume (manual input);Risk...
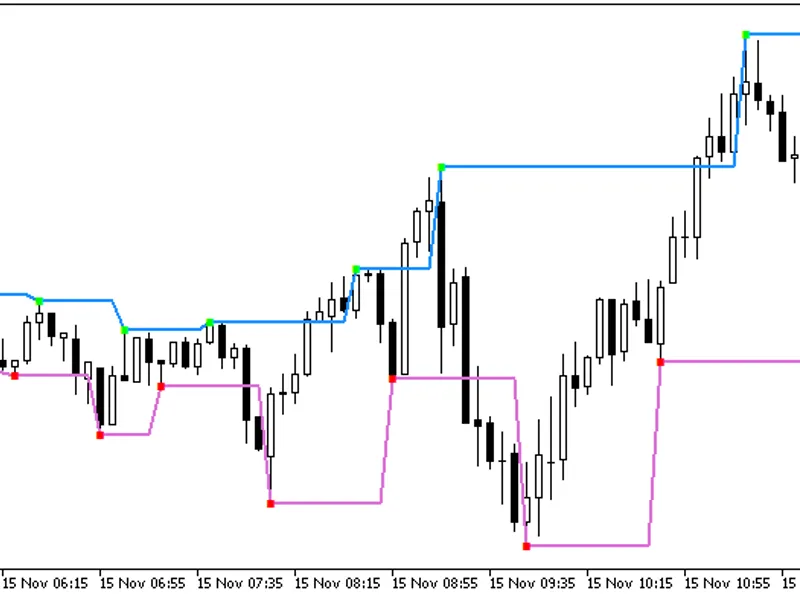
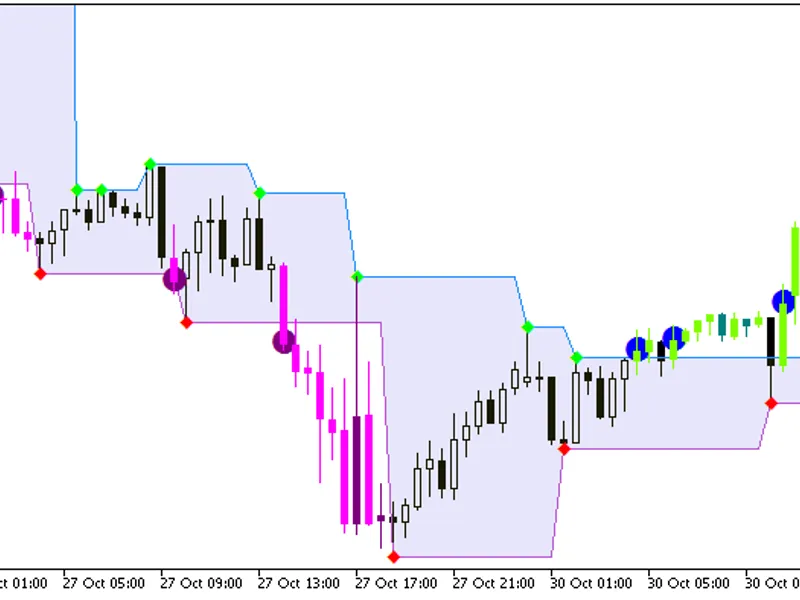
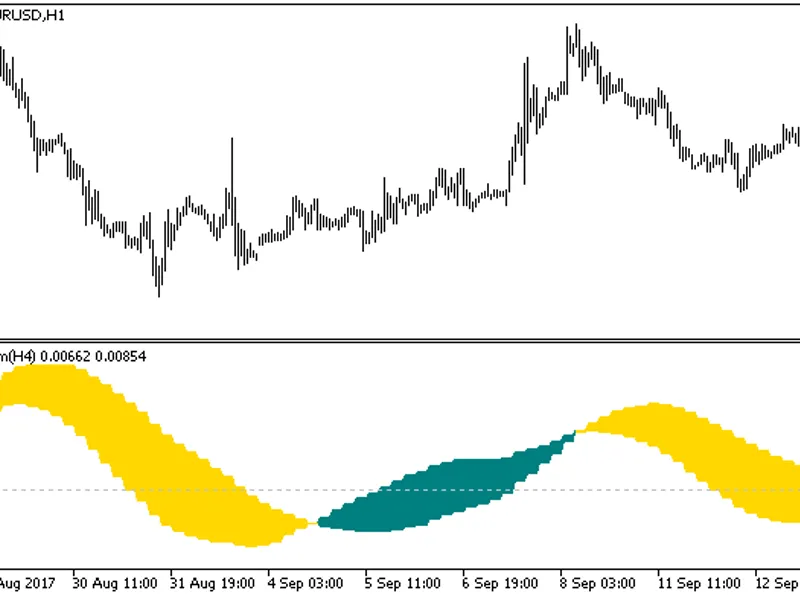
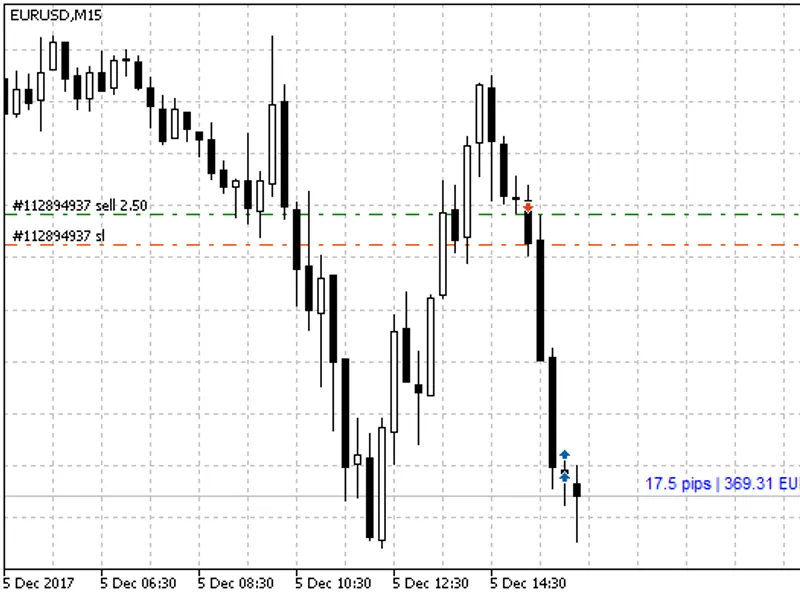
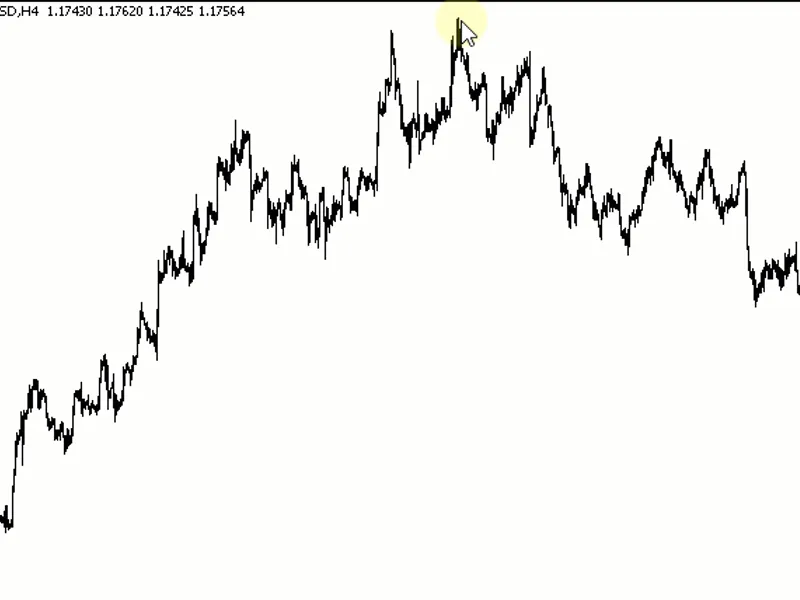
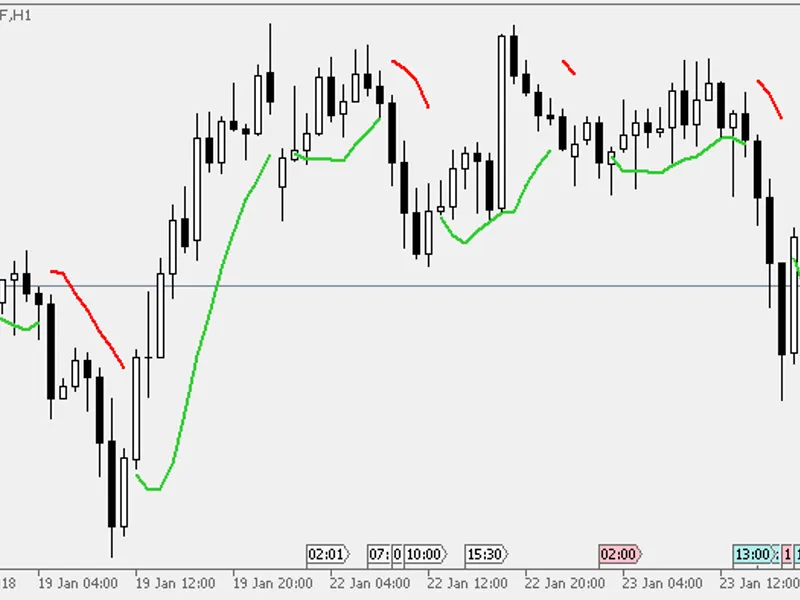
When price exits the gray channel, the candlestick color changes to the color corresponding to trend direction. Green for the growth of a financial asset, pink color for its fall. ...
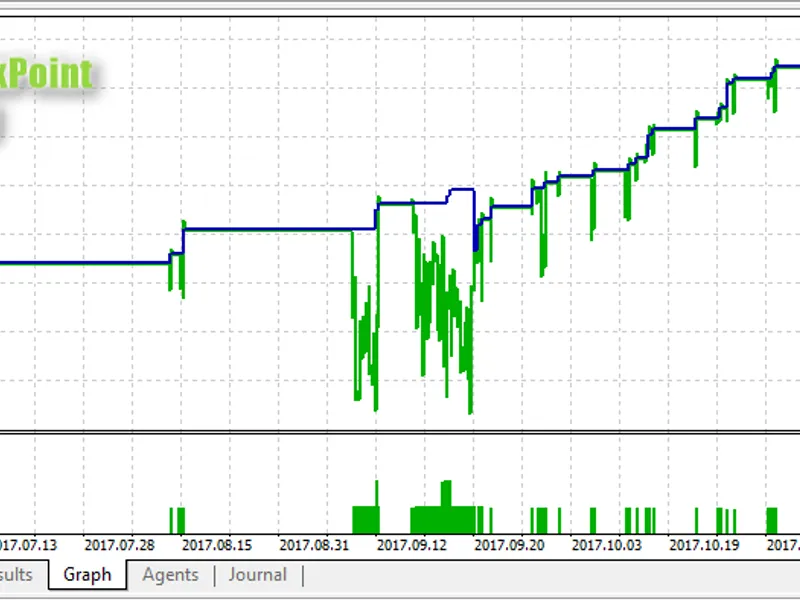
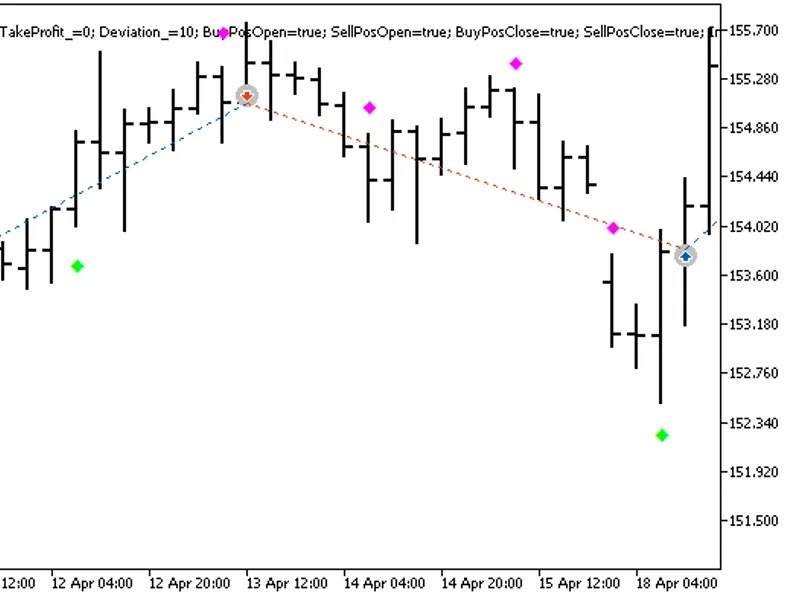
Trading against the trend direction as of N hours ago. Only one position a day can be opened at a certain hour.Input Parameters Max positions- the maximum number of positions (valu...
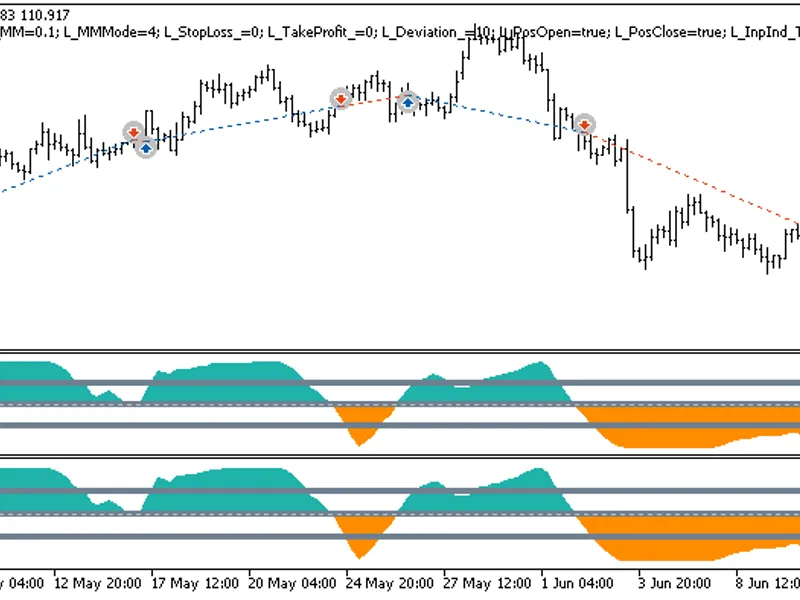
Trading system based on indicator signals. A signal is generated at the close of a bar if a colored indicator arrow has appeared.The Expert Advisor uses the compiled indicator file...
Two identical trading systems based on the crossover of the indicator and the zero line, for long and short trades, which can be configured in different ways in one Expert Advisor....
The indicator with the possibility to change the indicator timeframe from input parameters:The indicator requires the compiled Dtm.ex5 indicator file. Add it to <terminal_data_f...
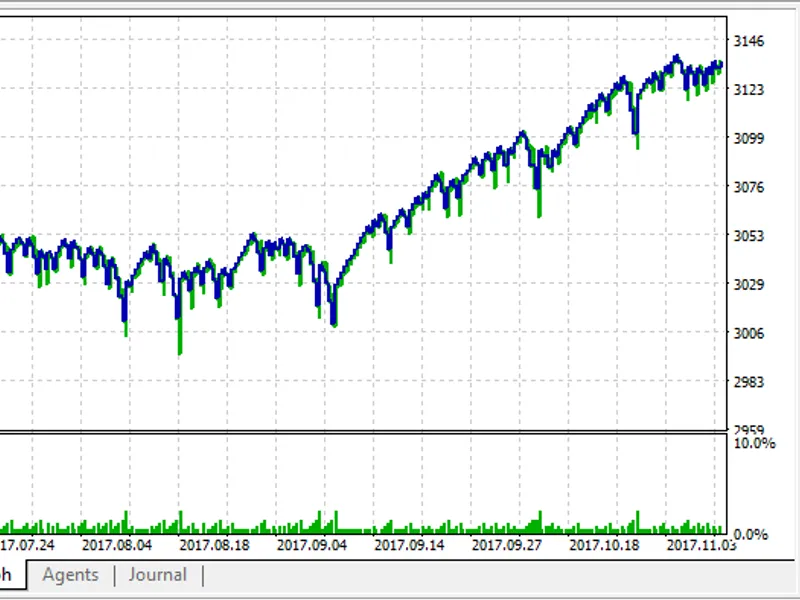
The Expert Advisor searches for N identical candlesticks in a row. It buys on bullish candlesticks and sells on bearish ones. The account type is taken into account, i.e. whether i...
The Expert Advisor generates a signal to open a position if the price has crossed iMA (Moving Average, MA) and (what's more important) the specified number of minutes has passed si...
Martingale is used. The EA trades either only BUY or only SELL direction.The best results are obtained during separate trading (either Buy or Sell). Only Buy trades are allowed in ...
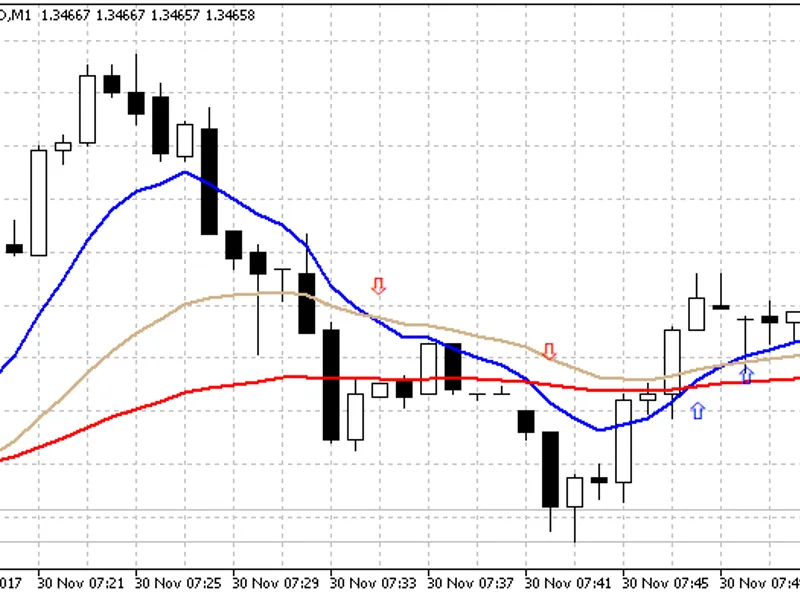
The indicator draws arrows at the intersection of three iMAs (Moving Average, MA). The first MA is the fastest one, the second MA is slower, and the third MA is the slowest one.MA ...
The EA uses two indicators: and .The following three options are available for setting stop loss and take profit:Trailing Stopis greater than zero. In this case a usual trailing st...
The EA trades using signals of the iMACD (Moving Average Convergence/Divergence, MACD) indicator. Lot is increased when the number of position grows (Martingale).The EA is recommen...
This information indicator allows you to always be aware of the current account status.The indicator displays the following data: profit in points, percentage and currency, spread ...
The EA uses three iMAs (Moving Average, MA), one iStochastic (Stochastic Oscillator) and one iRSI (RSI, Relative Strength Index). Positions are opened by market, as well as Buy Sto...
x1 lot from low to high.mq5- a position is initially opened with a minimum lot, further positions are opened with an increased lot.Input Parameters:Max Lots (x Lots maximum)- ratio...
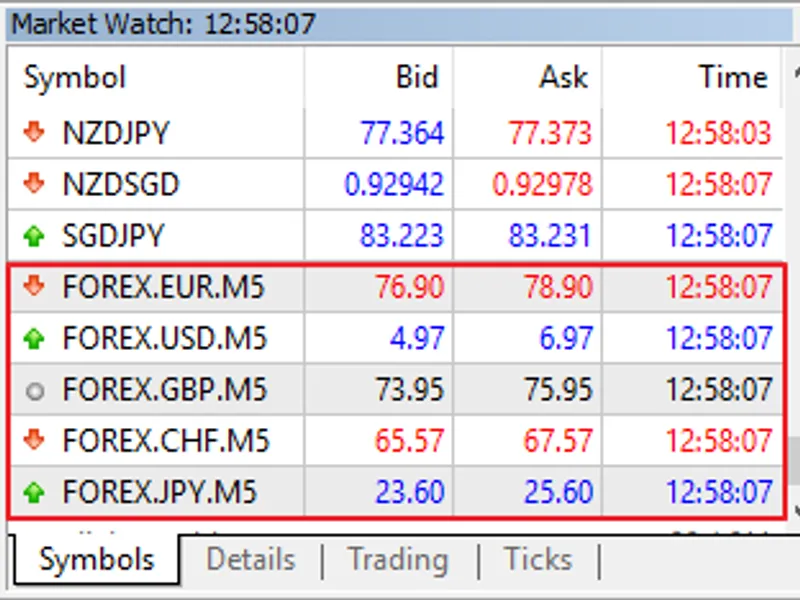
Description: MetaTrader 5 allows creating synthetic instruments. The price of such instruments can depend on the current values of a number of financial instruments.An example of s...
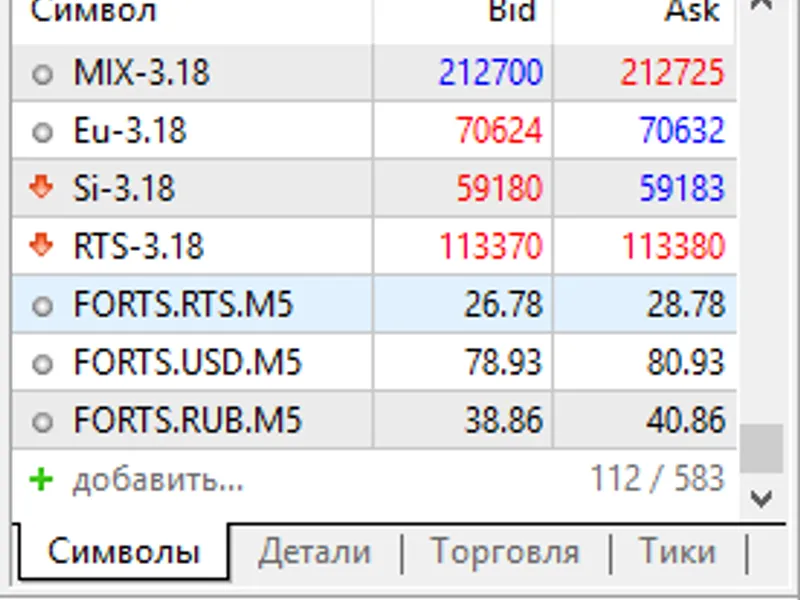
Description:provides an example of calculation of Forex currency strengths using synthetic financial instruments.Similarly, we can calculate the strengths of RTS, USD and RUB of th...
The Expert Advisor uses the signals of "crossover of two iMAs (Moving Average, MA)". The EA uses Trailing Stop and Take Profit. Sell positions are closed when a Buy signal appears,...
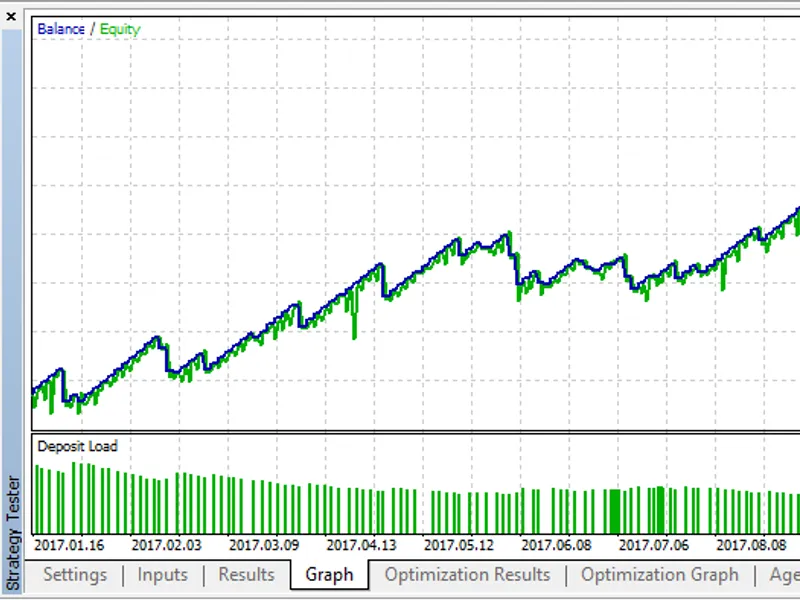
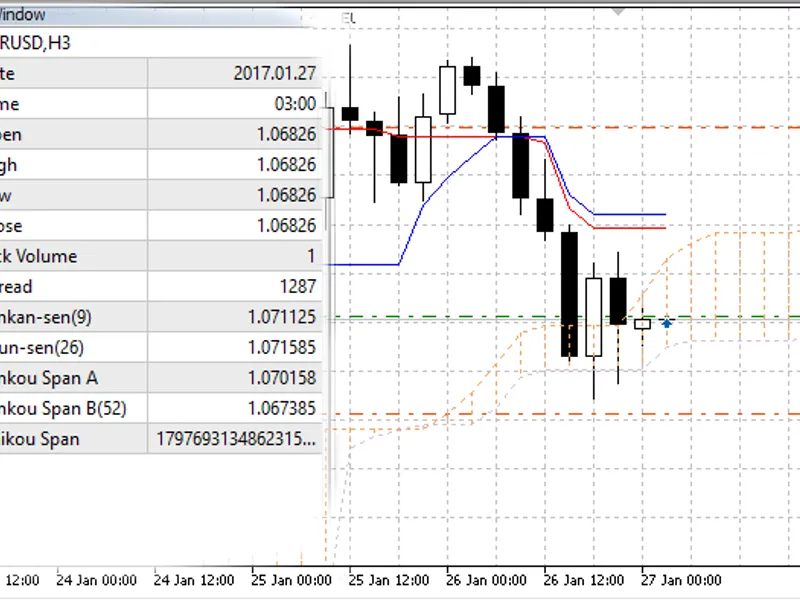
The EA trades based on the signals of (Ichimoku Kinko Hyo) using a fixed lot. When a signal emerges, opposite positions are closed.The Buy signal:Example:The Sell signal:Input Para...
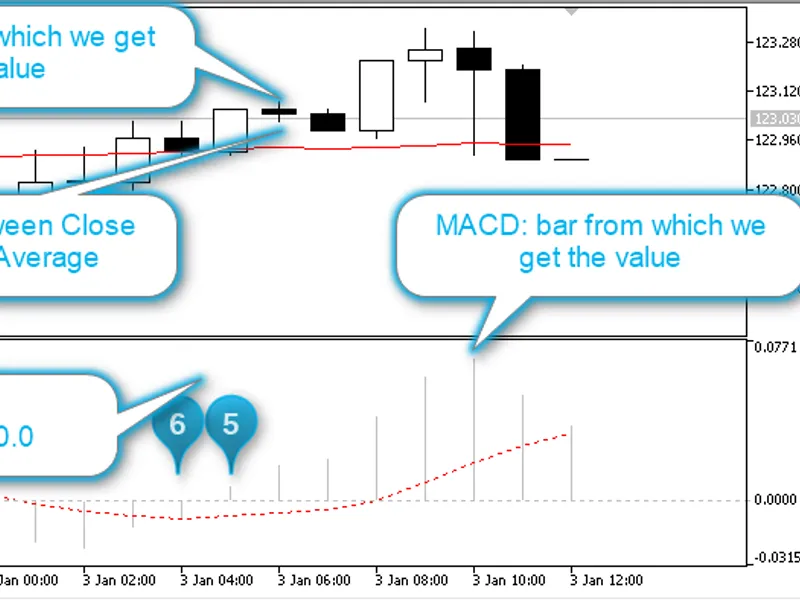
The trading idea: the iMACD (Moving Average Convergence/Divergence, MACD) Oscillator and the trend indicator iMA (Moving Average, MA). The initial signal to open a Buy position is ...
The Expert Advisor is based on Puria method with a few changes.The EA does not use the signal of intersection of fast and slow MAs, but uses their movement in one direction instead...
This tool is what the standard MetaTrader 5 objects miss. To edit a formed line, click on it (at the edges or in the center of the line) until a dotted line appears. Then move the ...
A further development of "".Uses the instead of the standard iMACD (Moving Average Convergence/Divergence, MACD).When the number of positions increases, the following is also incre...
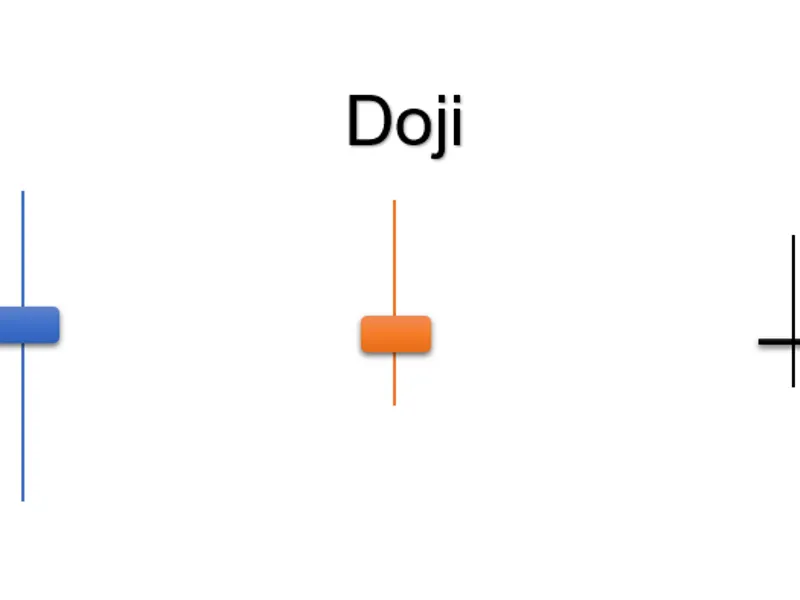
The Expert Advisor trades using the Japanese Candlestick pattern.The Doji candlestick has practically no body, it only has shadows. But this code provides the "Maximum Doji height"...
Trading signals are generated based on a comparison of two trend indicators: iMA (Moving Average, MA) and iSAR (Parabolic SAR). The EA works on the zero bar, only one position can ...
Modification was made at that time to allow users to use the indicator in scalping but as well in trending mode.Usage is simple :It signals a buy/sell opportunity when the indicato...
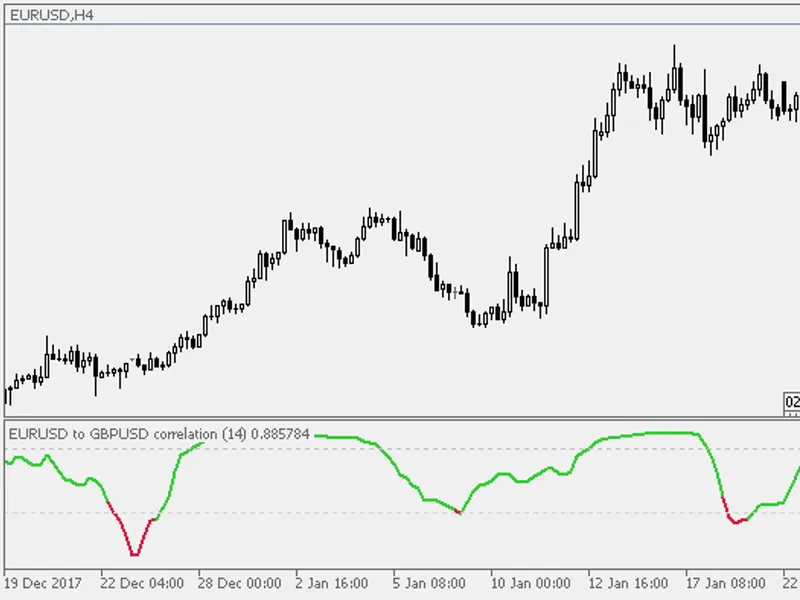
Correlation of two symbols. Values are oscillating between +1 (complete positive correlation) and -1 (complete negative correlation). Correlation value 0 is denoting absence of cor...
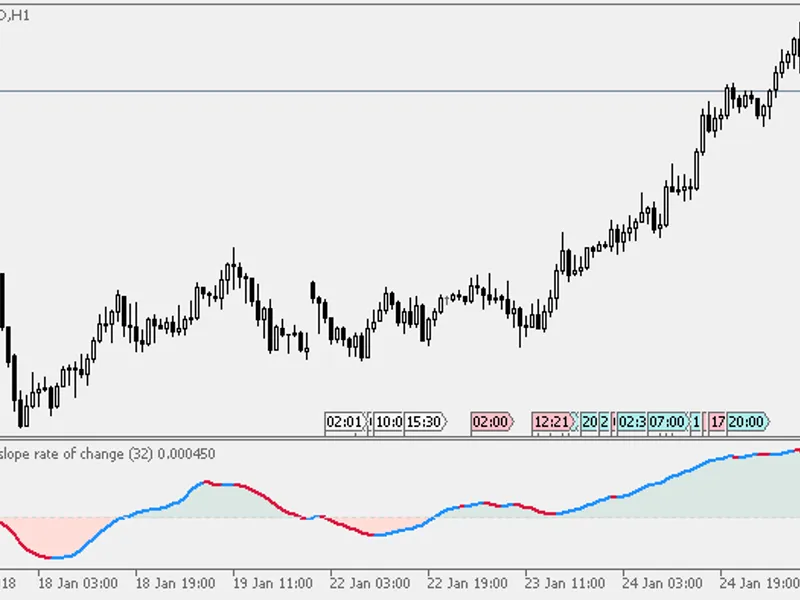
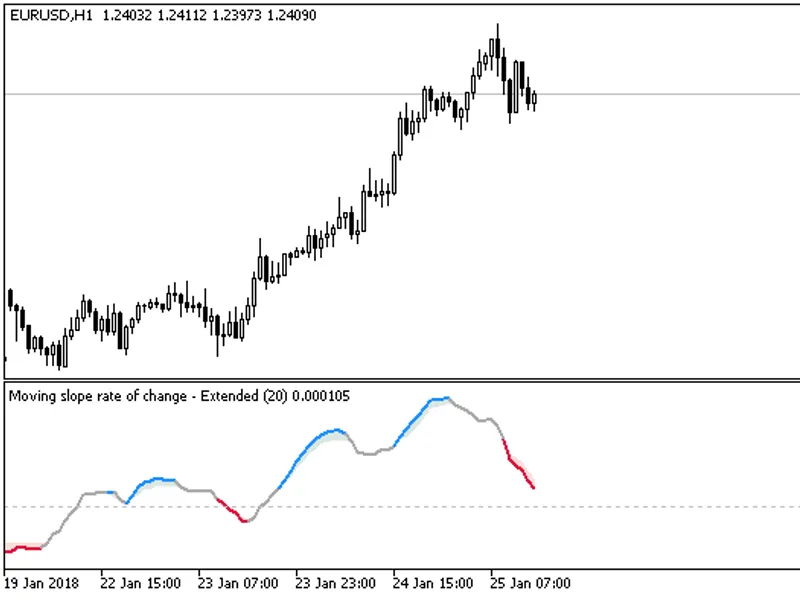
In his article "The Hunt for Superior Signals – Two Moving Function Hybrids" (September 2005), William Rafter described the Moving Slope Rate Of Change. This is the MSROC as origin...
In his article "The Hunt for Superior Signals – Two Moving Function Hybrids" (September 2005), William Rafter described the Moving Slope Rate Of Change. This is the MSROC as origin...
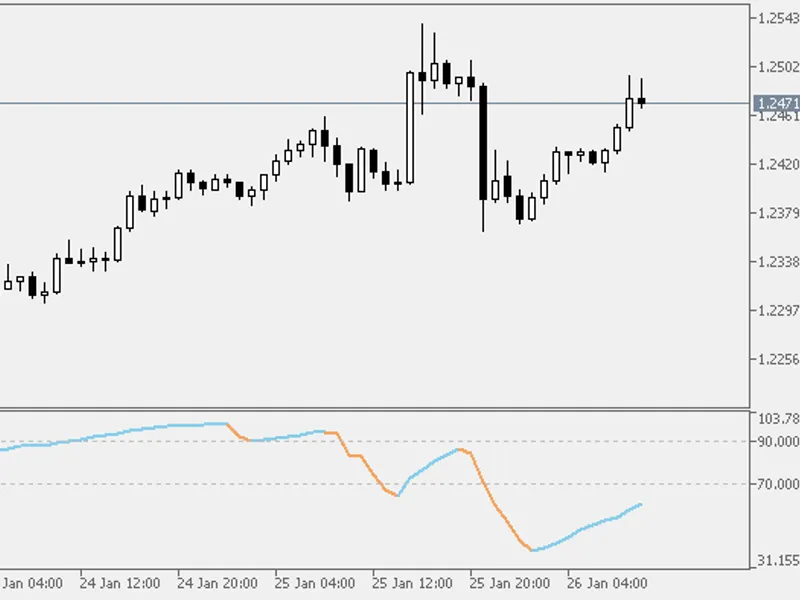
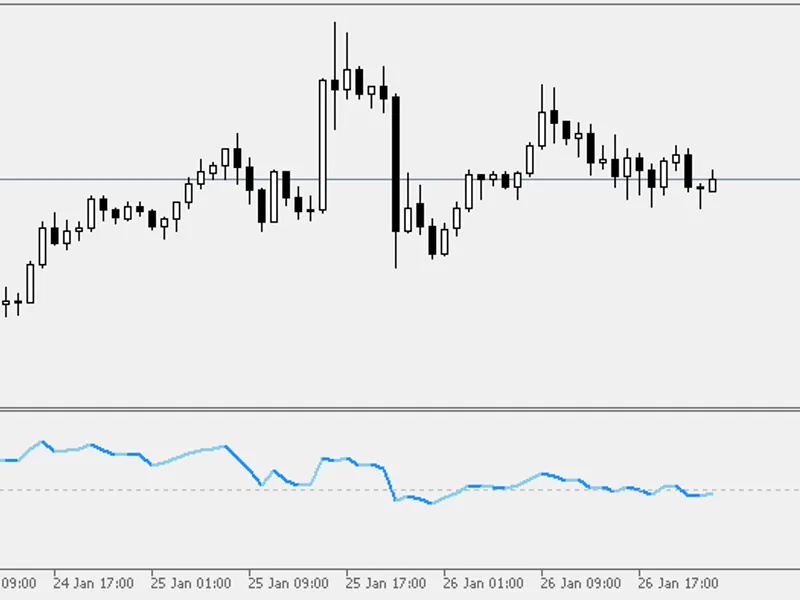
The Relative Momentum Index (RMI) was developed by Roger Altman. It was first introduced in the February 1993 issue of Technical Analysis of Stocks & Commodities magazine.The R...
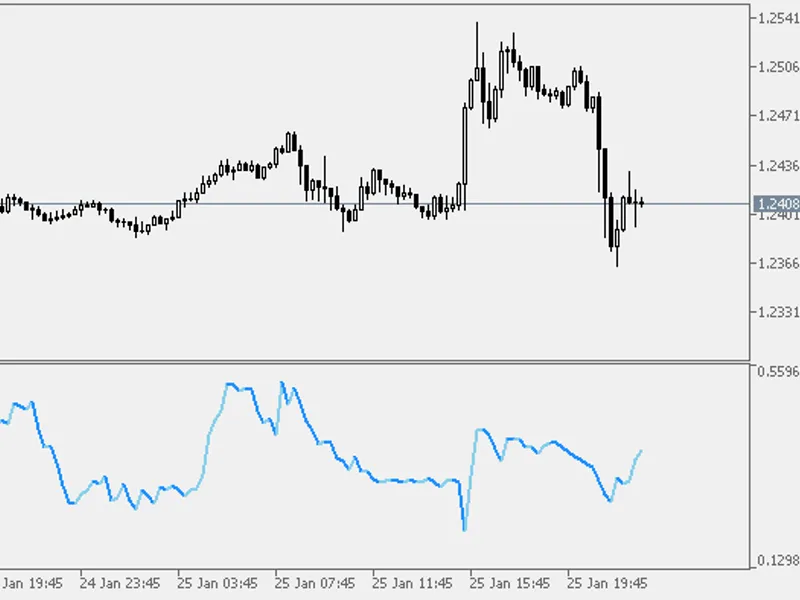
The Vertical Horizontal Filter ("VHF") determines whether prices are in a trending phase or a congestion phase. The VHF was first presented by Adam White in an article published in...
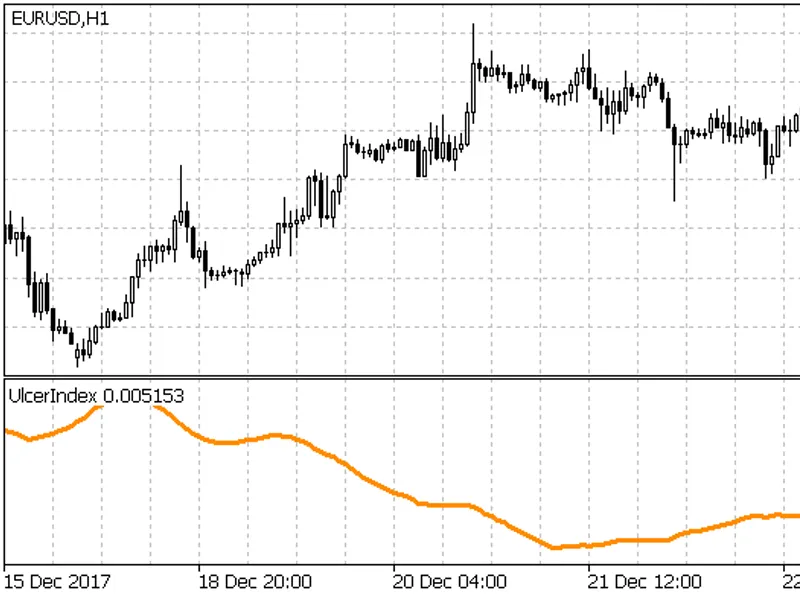
This Ulcer Index (UI) indicator is a technical indicator devised by Peter Martin in his 1987 book "The Investors Guide to Fidelity Funds".Typically used in measuring downside risk ...
In case the Qstick indicator shows a reading below zero, this is indicative that the majority of candlesticks during the examined period are bearish, thus, the bias for the trading...
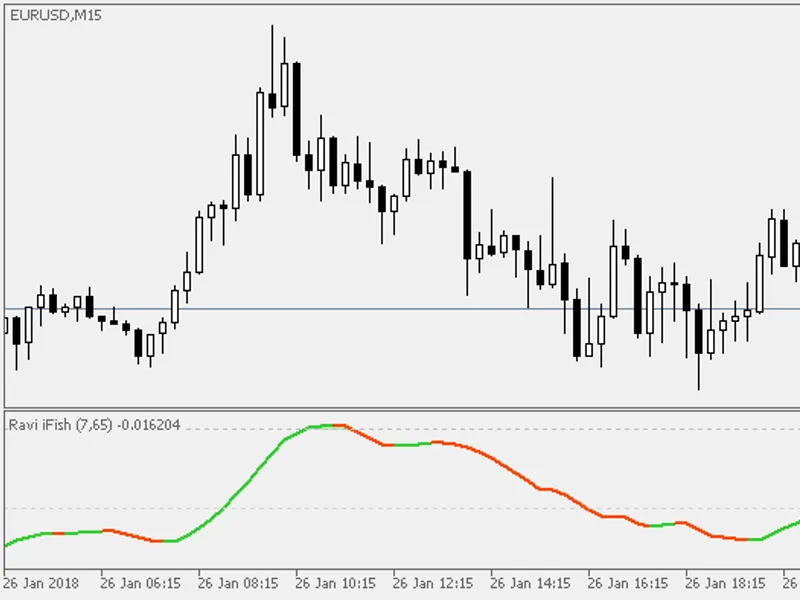
Developed by Tushar Chande, the Range Action Verification Index (RAVI) is used in order to help identify if the market is in a trend. The indicator shows the difference (in percent...
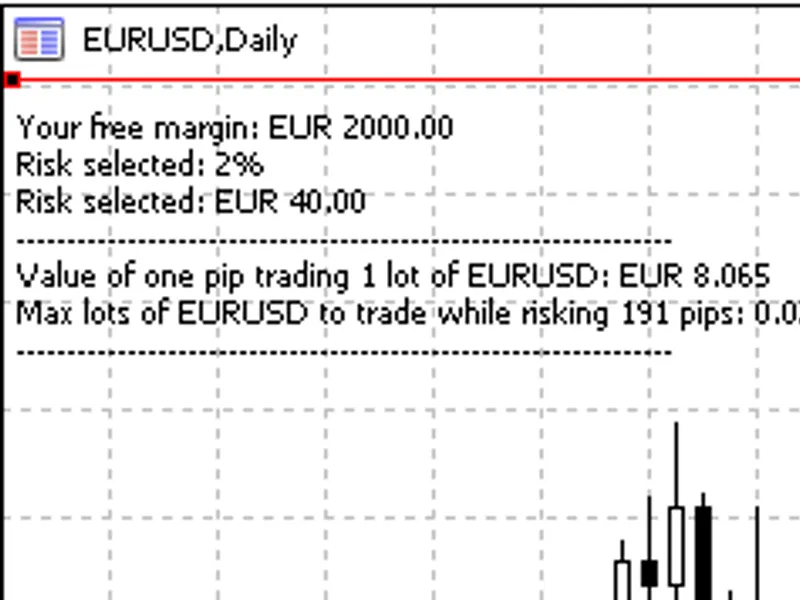
Most of professional traders state that their success is based on strict risk management.This simple tool is designed to show the correct lot size to trade with respect to the foll...
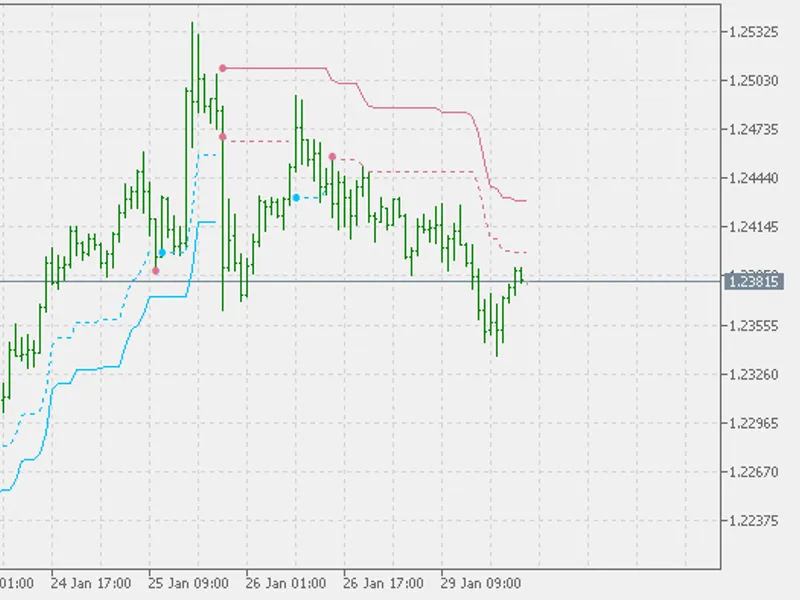
Developed by Charles Le Beau and featured in Alexander Elder's books, the Chandelier Exit sets a trailing stop-loss based on the Average True Range (ATR). The indicator is designed...
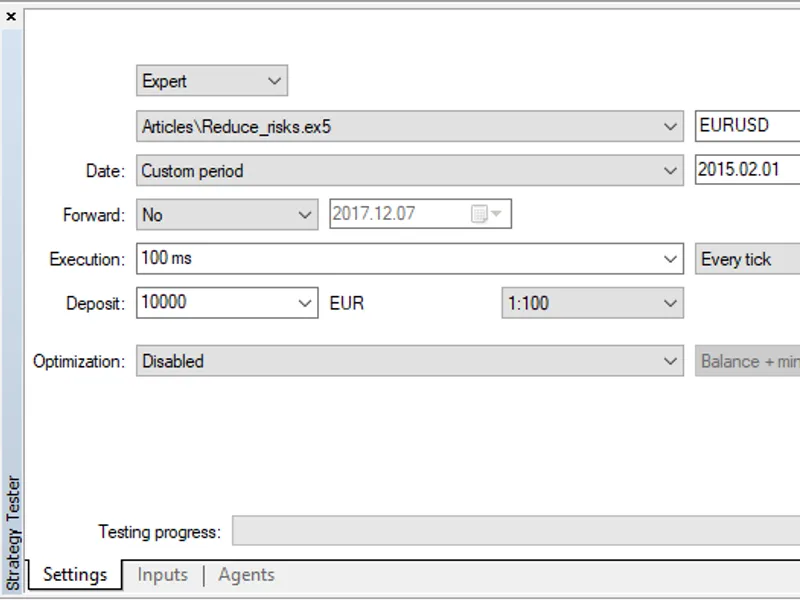
The EA works on each tick and can be optimized:Get some data (on indicators and time series) only if a new bar appears Sample tester runs with the appropriate settings (the termina...