The MetaTrader 4/5 is based on the system timer call and can therefore work inaccurately. We can check this by running the following simple Expert Advisor:In the chart comment (the...
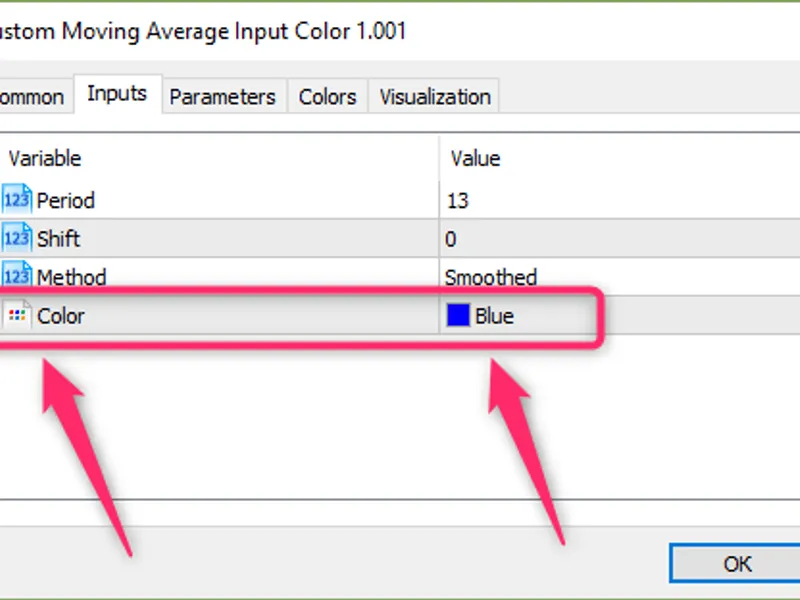
New input parameter "line color" has been added.You probably noticed that if an Expert Advisor uses the Moving Average indicator data, then this indicator is displayed ONLY in red ...
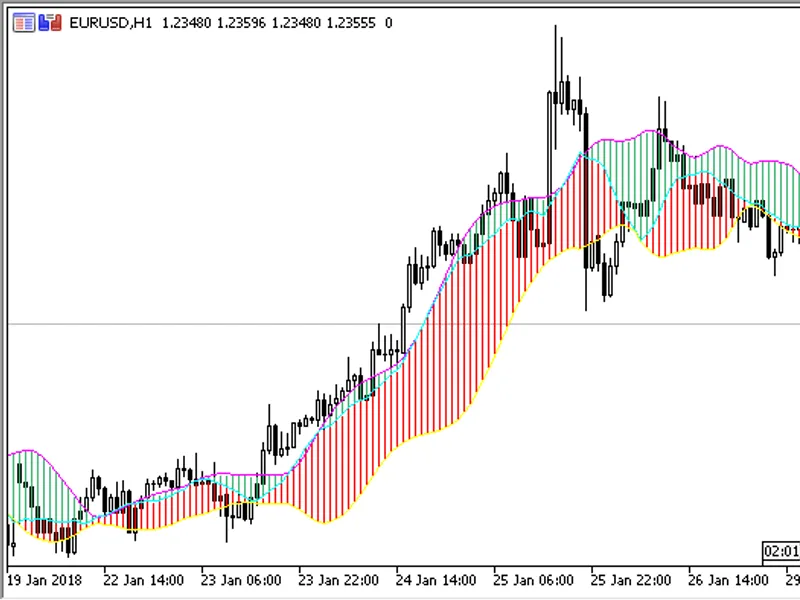
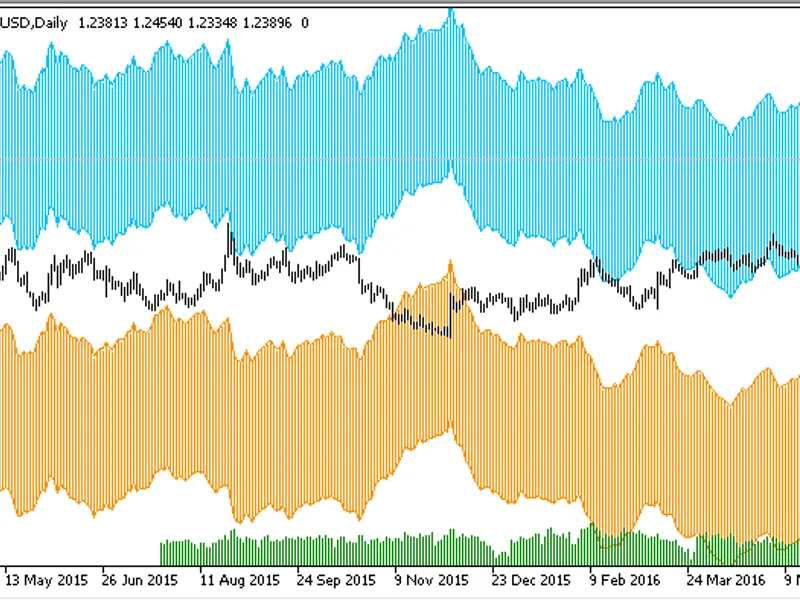
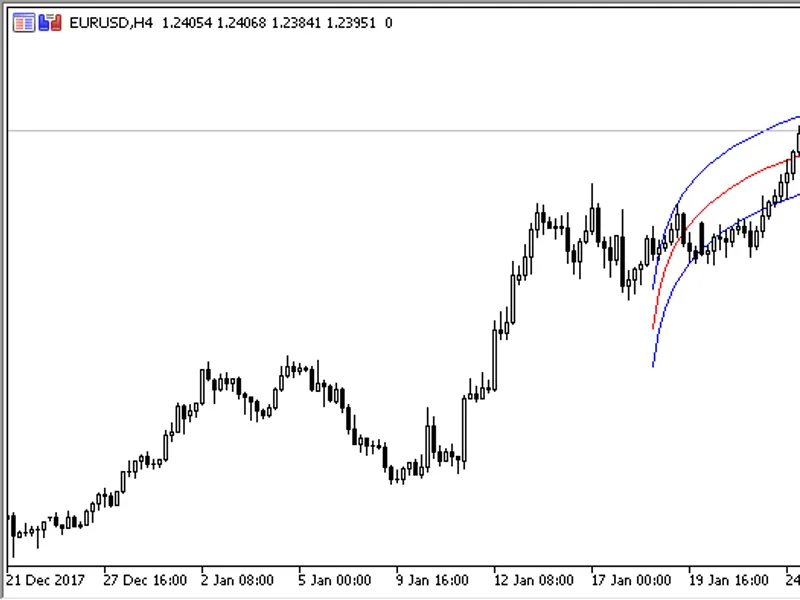
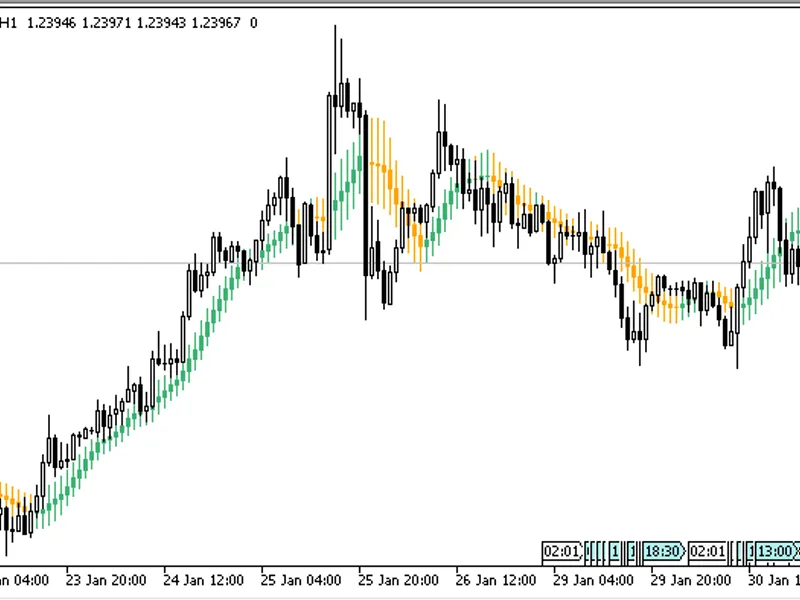
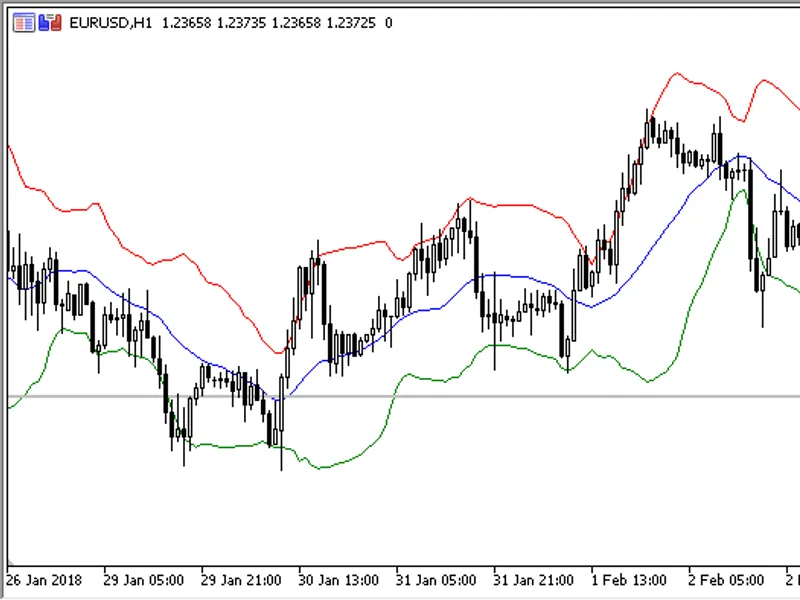
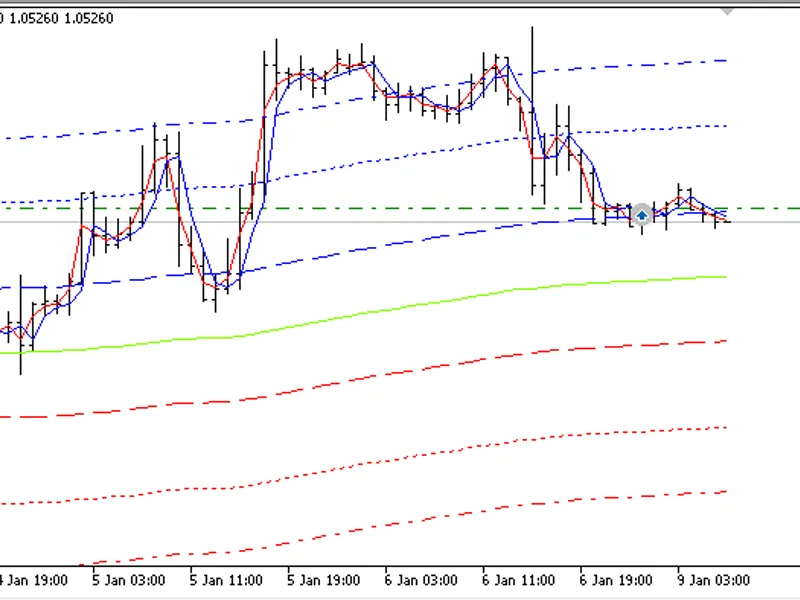
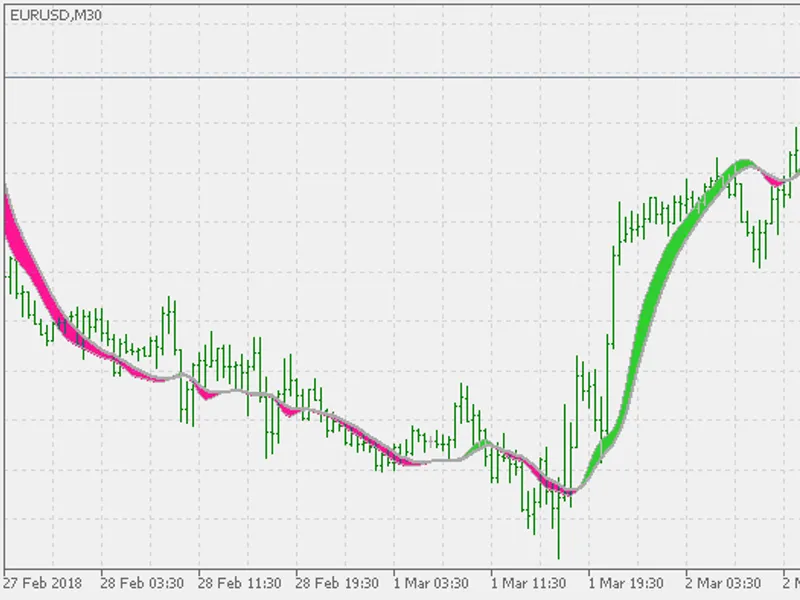
The indicator draws a Moving Average, as well as bullish and bearish areas built using Bollinger Bands calculated based on this Moving Average.It has five input parameters:Period o...
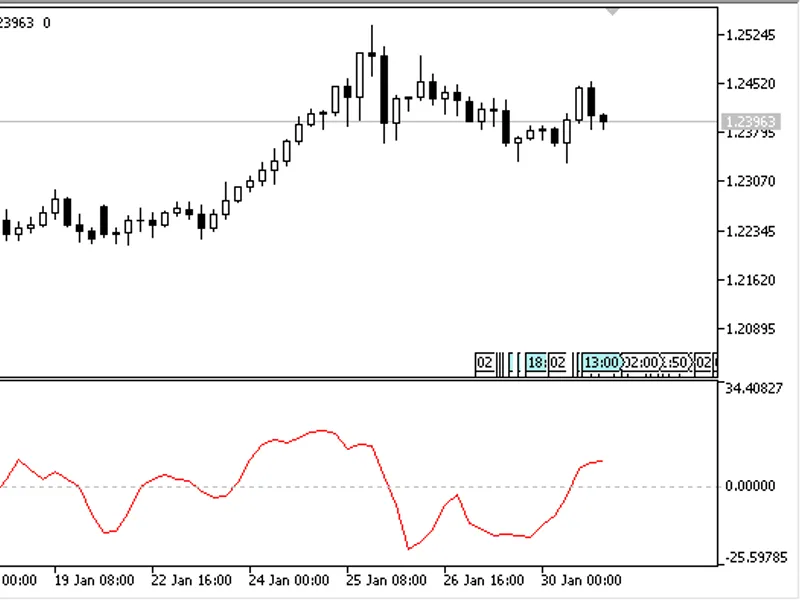
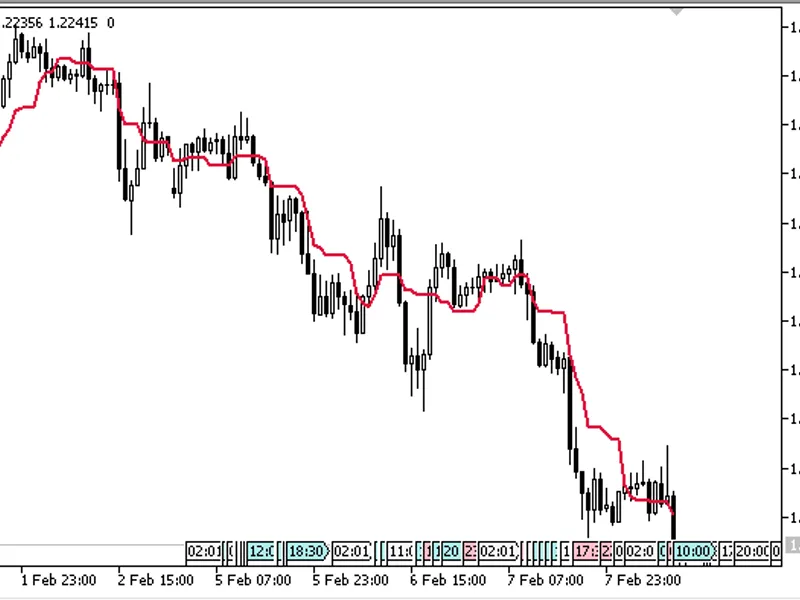
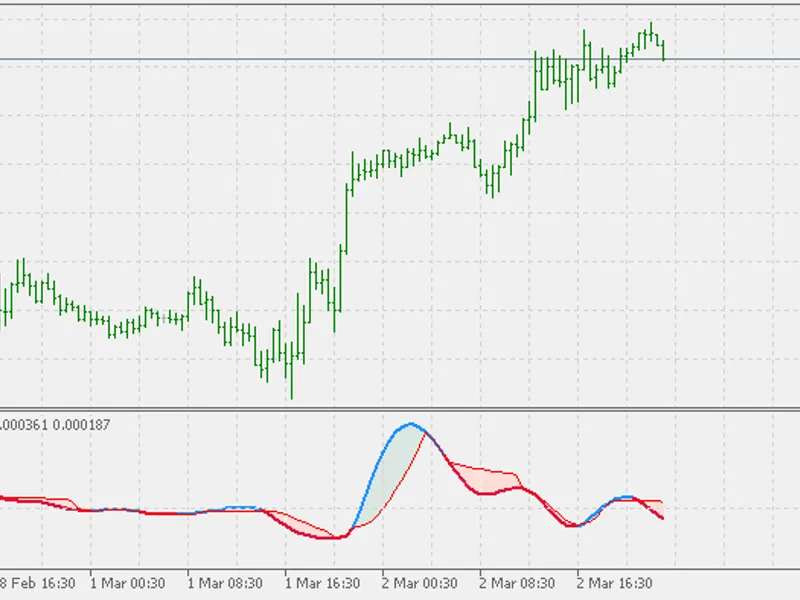
The Advance Trend Pressure indicator shows the trend direction and strength line. It can additionally show the bullish and bearish components of the trend.Trend is determined using...
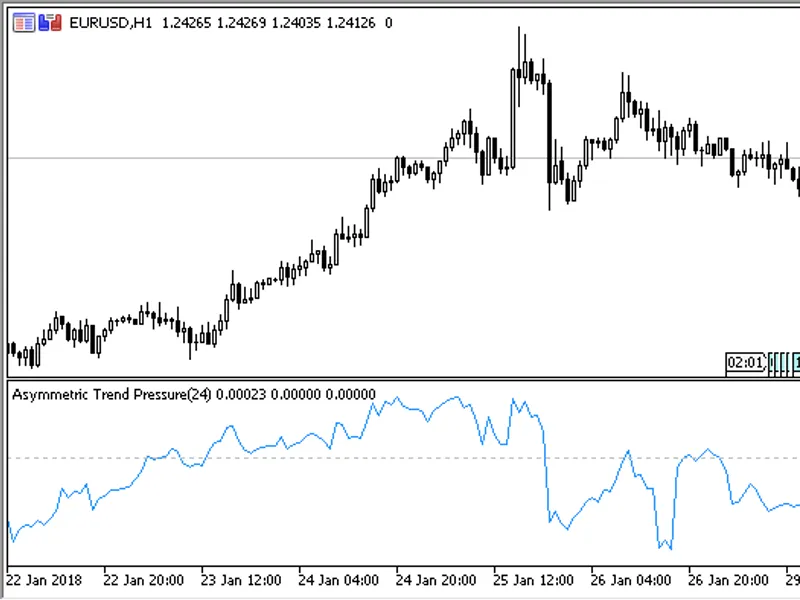
The Asymmetric Trend Pressure indicator shows the trend direction and strength line. It can additionally show the bullish and bearish components of the trend.Unlike , here only Ope...
The indicator shows MACD calculated based on AMA.The indicator has eight configurable parameters:Period of the Fast AMA;Fast EMA of the Fast AMA- the period of the fast EMA in the ...
The channel is based on the classic RSI and displays three zones, including the overbought zone, the oversold zone and the neutral zone, which is between the overbought and oversol...
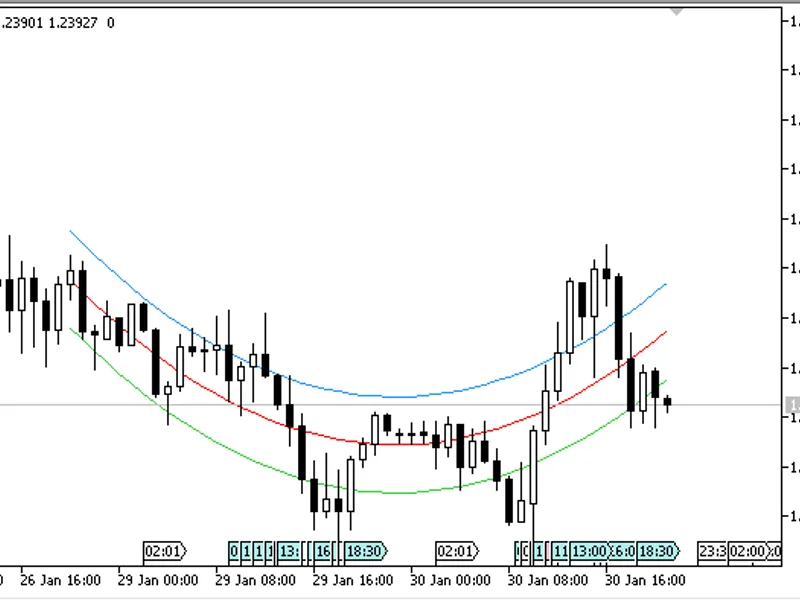
The indicator draws a channel constructed by the method of polynomial regression.It has four configurable parameters:Length- the channel length in bars;Power- sensitivity;Deviation...
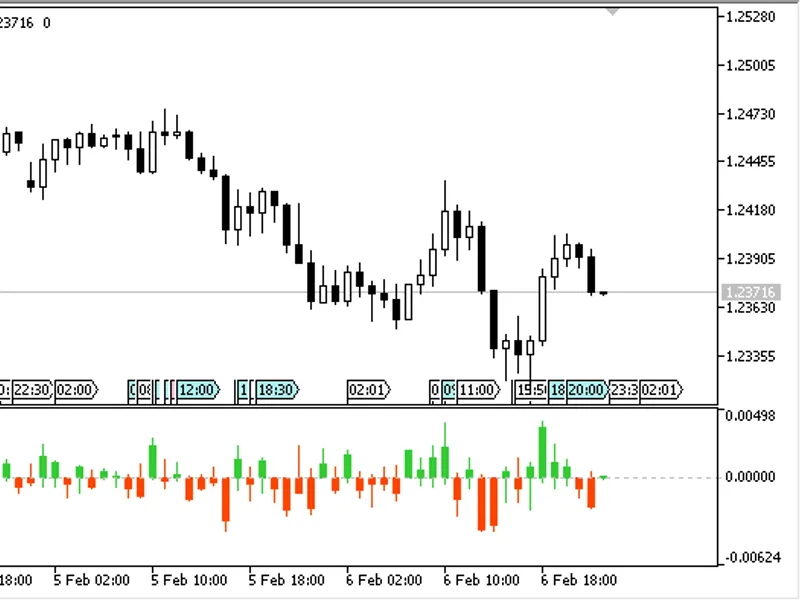
The Difference indicator shows the difference between the current prices and prices as of N periods ago.It can show the difference in two modes:The difference between Open and Clos...
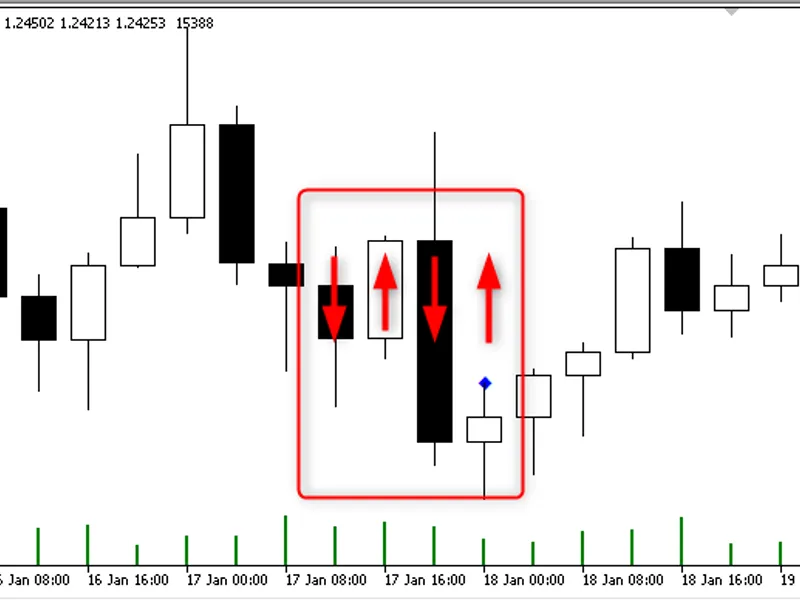
The Kicking Pattern indicator searches for a sequence of candlesticks on a chart and marks bullish and bearish sequences.Bearish Pattern: candlestick up - candlestick down - candle...
A trend oscillator. It is calculated by the following formula:SMA(3) of EMA (66) of ( Momentum[period] - Momentum[period-1] ) It has four configurable parameters:Period of momentum...
The indicator draws a channel calculated by the logarithmic function.There are three adjustable parameters:Length- the channel length in bars;Deviation- channel width;Applied price...
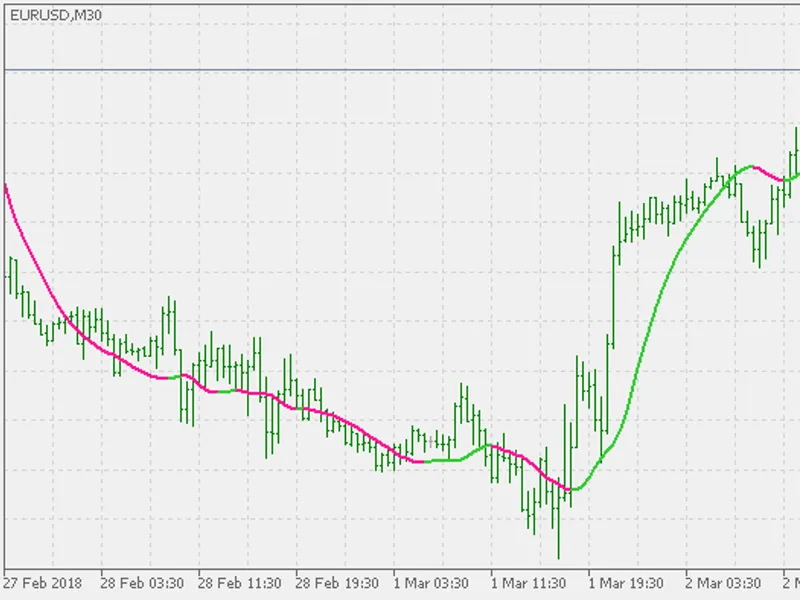
Moving Average Candles draws a moving average as candlesticks.It has five input parameters:MA period- moving average calculation periodMA method- moving average calculation method;...
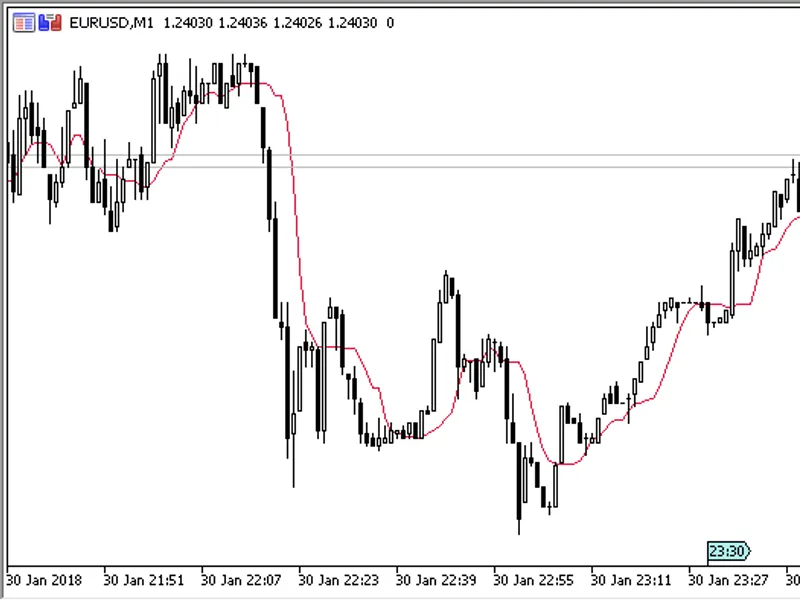
Median MA is a moving average, which is calculated using the median price for a given period.A sorted array of prices for the specified period is used for calculating the moving av...
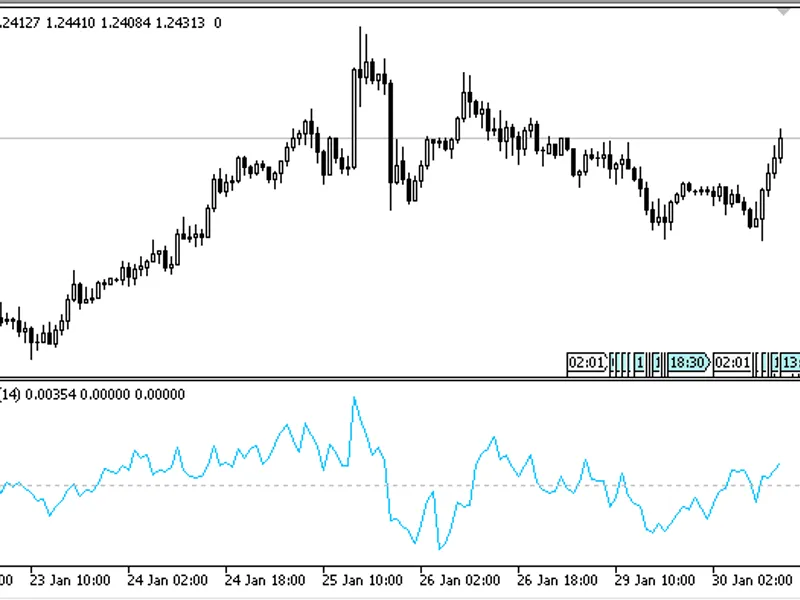
Random Walk Index (RWI) tries to determine whether a price movement is random or it is characteristic of the price and (or) is a result of a statistically significant trend.The ind...
The indicator draws a moving average calculated by the Square Weighted (SqWMA) methodIt has two parameters:Period- calculation period;Applied price- price used for calculations. ...
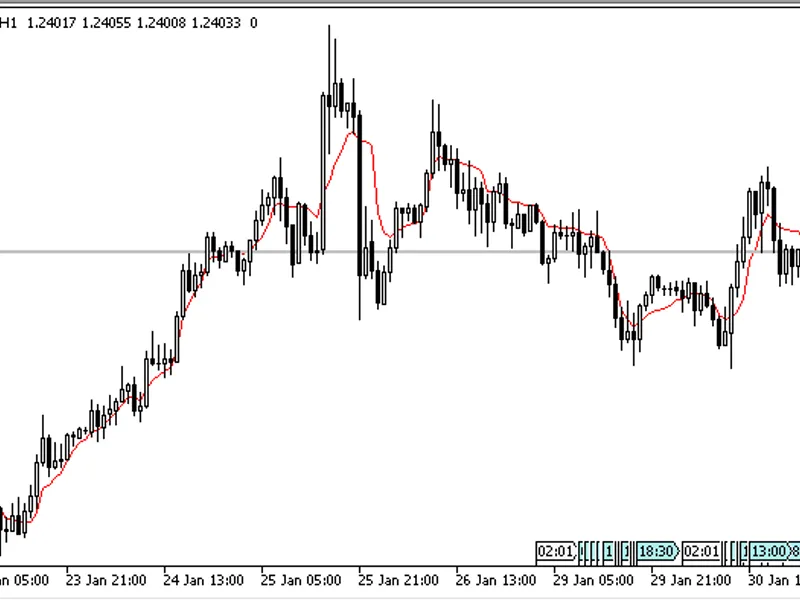
The VMA indicator draws a moving average, the period of which changes dynamically depending on volatility. The higher the volatility, the greater the period of the moving average, ...
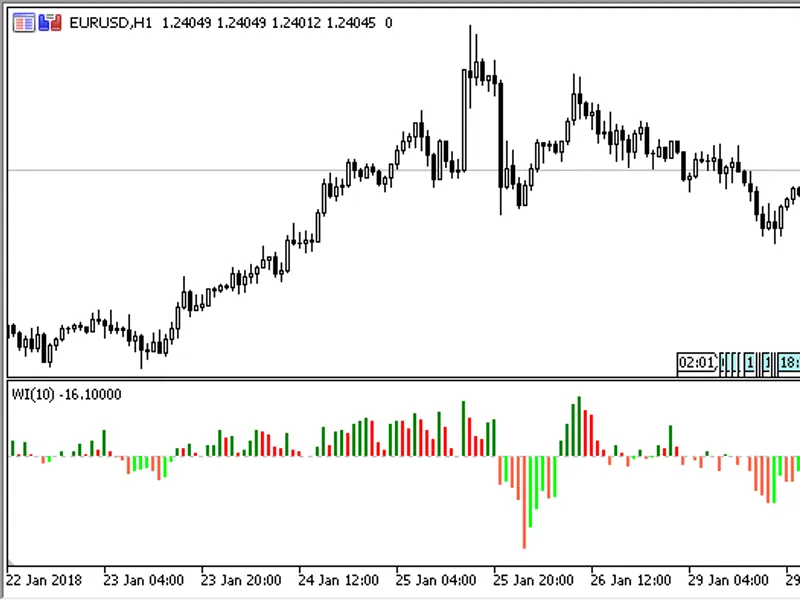
The WI indicator shows a moving average calculated by the following formula:WI(2 * Close-High-Low) It has two parameters:Period- calculation period;Method- calculation method. ...
Zero Lag is a modified EMA.Calculation formula:The formula is similar to EMA with an addition of a new value Gain * (Close - ZL [1])Gainis the value selected from the interval [-Ga...
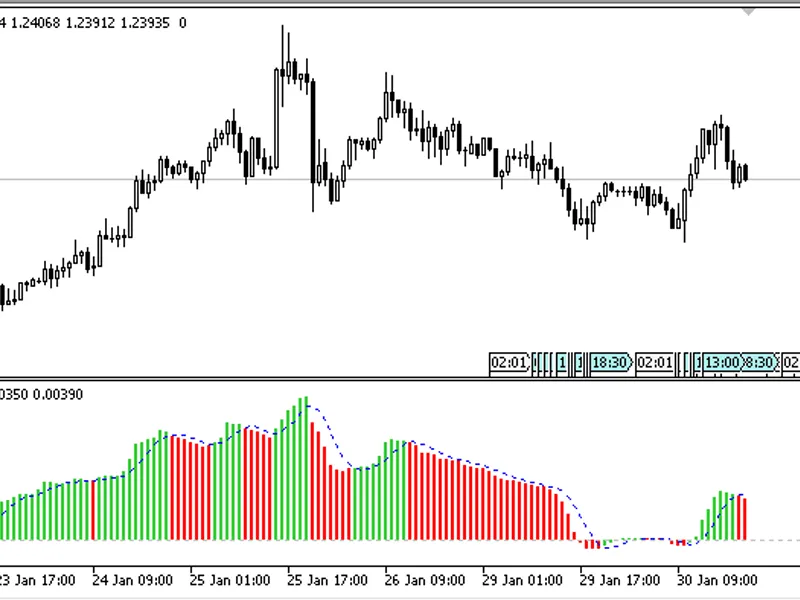
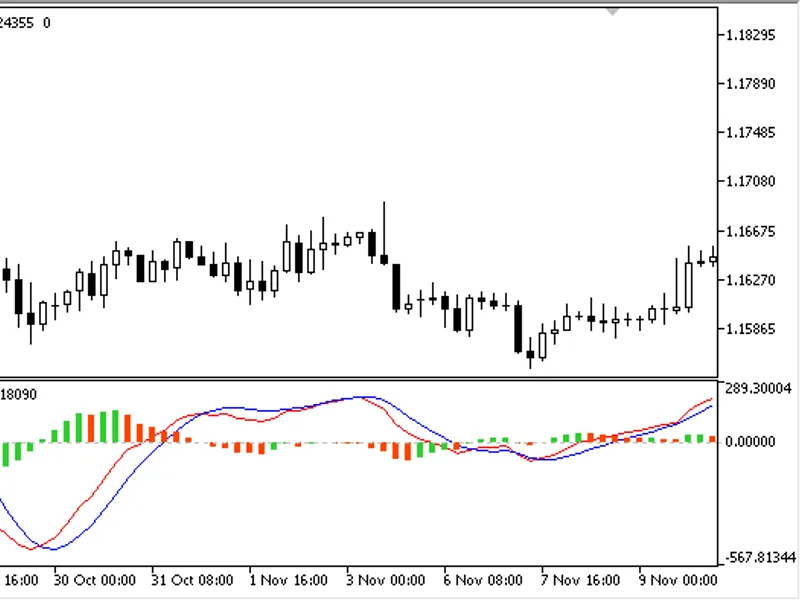
Unlike the standard MACD, the indicator has a smaller lag and three lines:The MACD line; A signal line; Histogram. The histogram can serve as a leading signal - the histogram color...
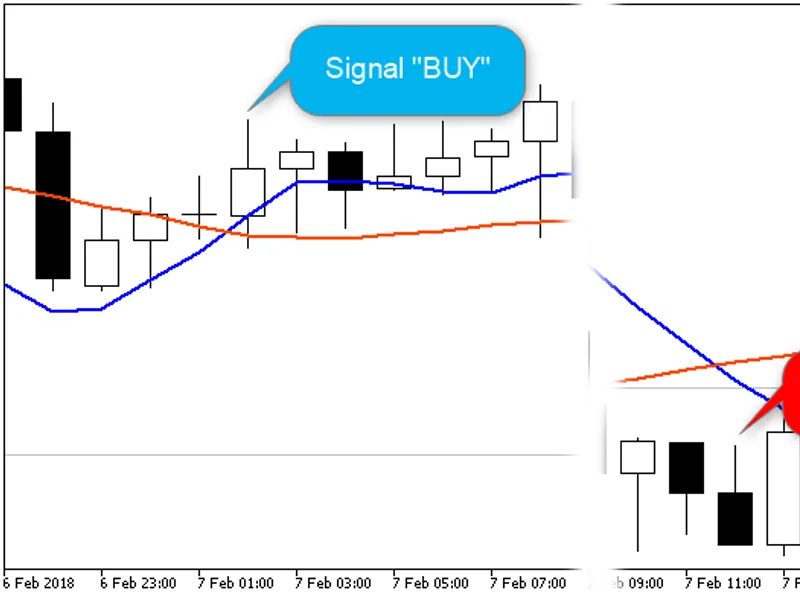
Expert Advisor signals are based on the common intersection of two MA lines. These are signals of the indicator:If the MA of the current timeframe crosses the MA line of the higher...
The Expert Advisor uses the indicator.The strategy is simple:The mode of trading based on channel borders: If the Low price of the first bar has crossed or touched the lower borde...
The Expert Advisor manages Buy and Sell positions (applies Trailing Stop) and sets pending Buy Stop and Sell Stop orders.Parameters Fixed Lot- the pending order lot is not calculat...
A Simple Expert Advisor The EA opens a position of the specified type at the time specified in the EA parameters. The position is closed at the time specified in the appropriate pa...
This non-trading Expert Advisor is designed for the simple trailing of take profit orders of open positions.The EA only works on hedging accounts. Principle of operation: when a ne...
The EA opens and closes positions with a minimum lot every Interval of opening and closing positionsminutes. The position type is determined as follows:If the random number generat...
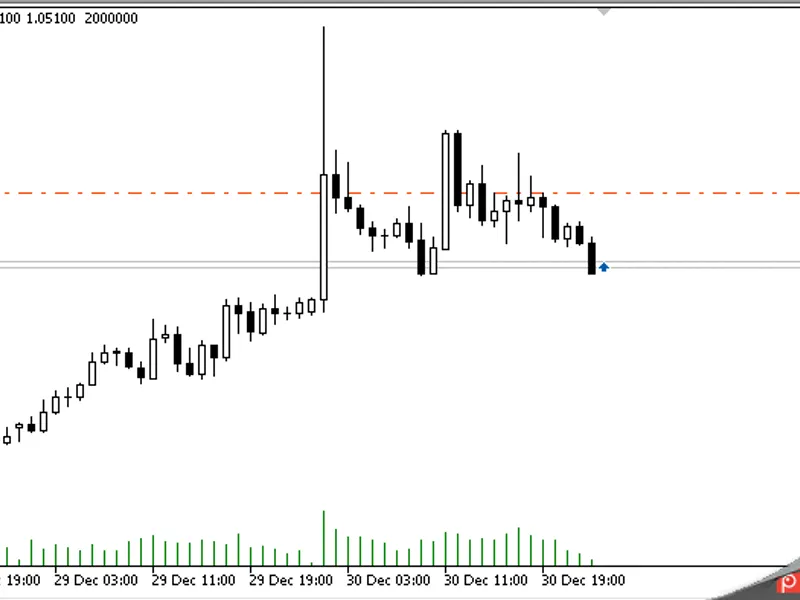
The Expert Advisor places pending Buy Stop and Sell Stop orders at a distance of Initial indentation. The Max spreadparameters is also taken into account: if the current spread exc...
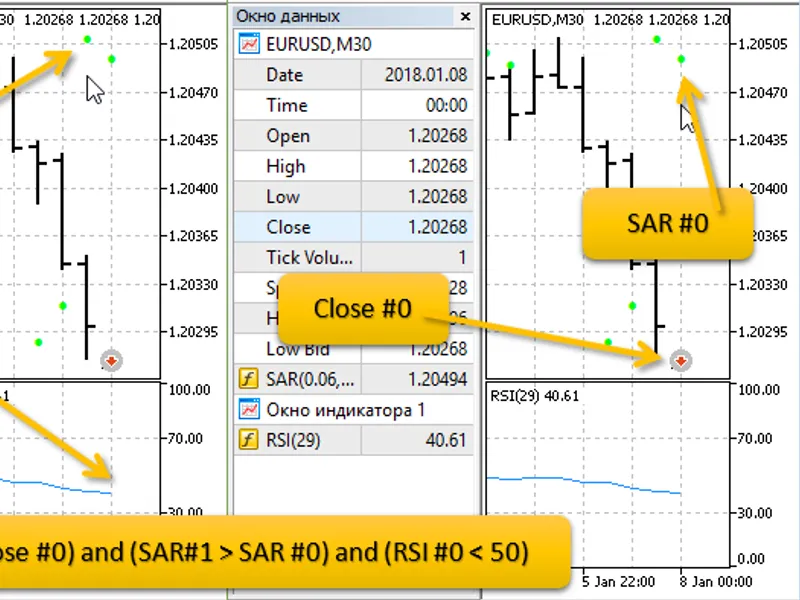
The rules of the trading system are as follows:A signal to open BUY: SAR on bar 1 is less than the Close of bar 0, SAR on bar 1 is less than SAR on bar 0, RSI on bar 0 is greater t...
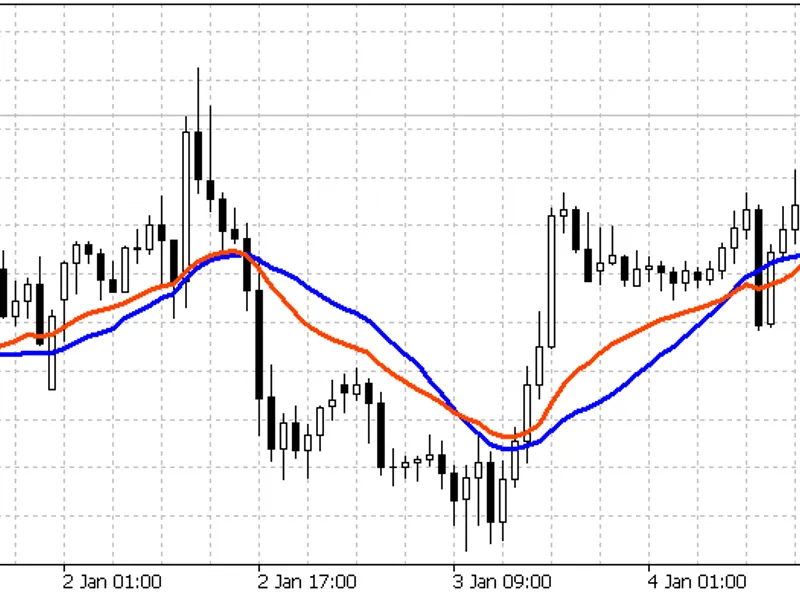
An intersection of two Moving Averages based on the data of two bars is searched for generating a signal:The number of the current bar can be specified in Trade bar: either bar #0o...
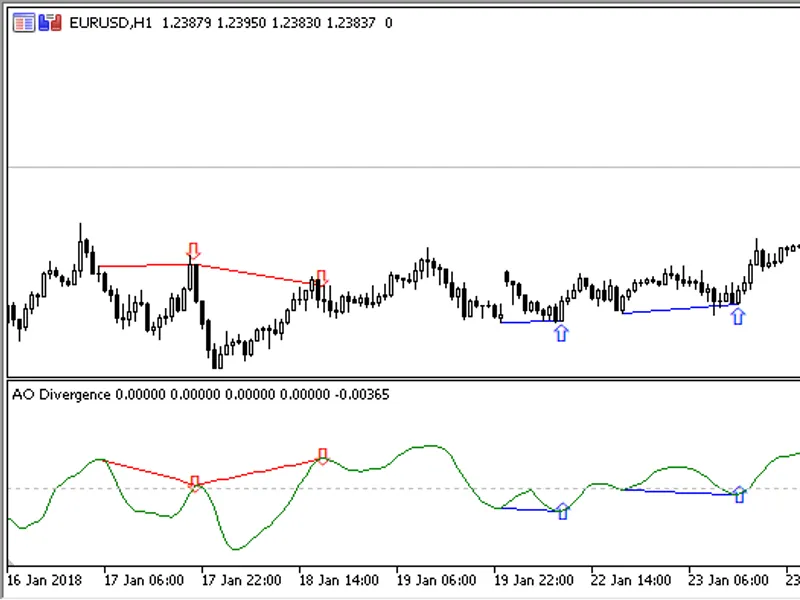
The custom indicator AO_Divergence draws the AO indicator line in a separate window and displays found divergences in the indicator window and on the price chart.Unlike the standar...
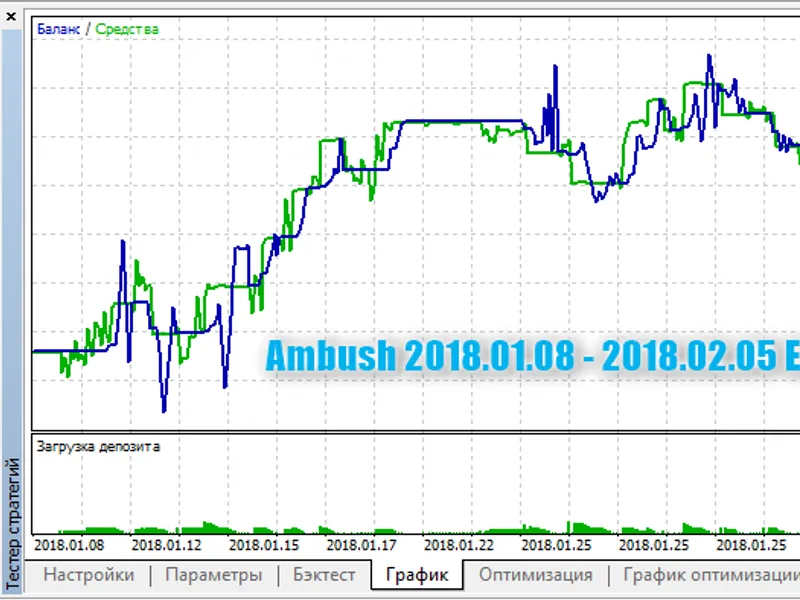
The Expert Advisor works with one position (can be used on netting accounts). The direction of a new open signal is calculated depending on the direction of the last closed positio...
Common Bollinger Bands with the possibility to set the colors and styles of all lines.There are three adjustable parameters:Period - periodDeviation - deviationApplied price- calcu...
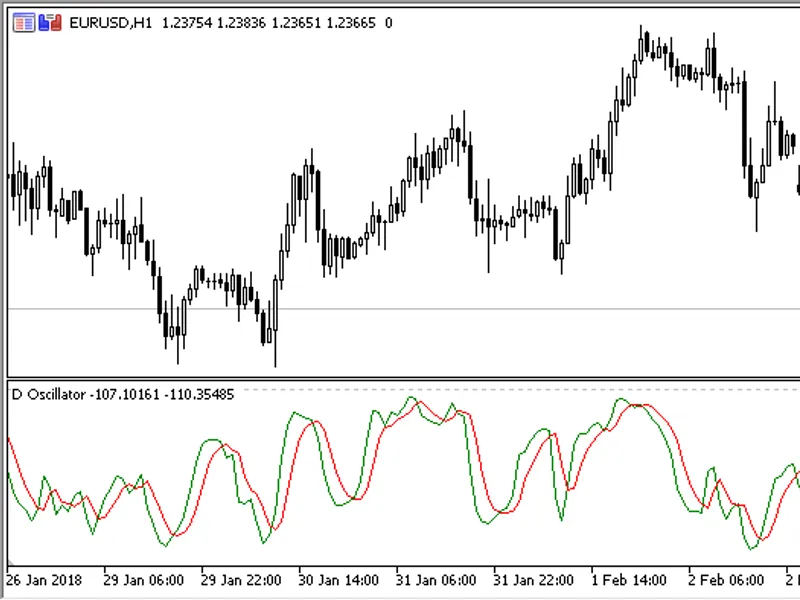
D-Oscillator is an oscillator based on the RSI and CCI ratio.Calculation formula whereMaxRSI, MinRSI - the maximum/minimum values of RSI between [i-D_Period] and [i].The indicator ...
A simple moving average calculated by the geometric mean method.The indicator has two input parameters:Period- calculation period;Applied price- price used for calculations. ...
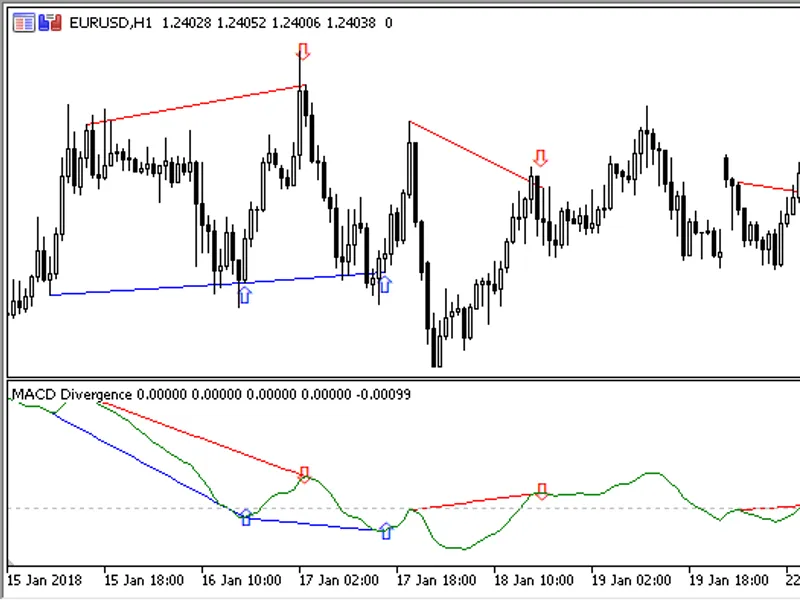
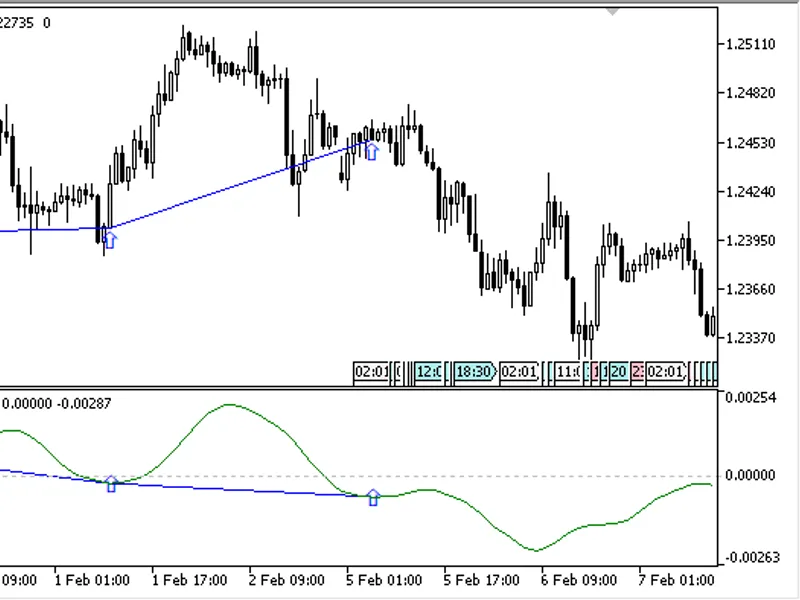
The custom MACD_Divergence indicator draws the MACD indicator line in a separate window and displays found divergences in the indicator window and on the price chart.Unlike the sta...
The custom MACD_Signal_Divergence indicator draws a signal line of the MACD indicator in a separate window and displays found divergences in the indicator window and on the price c...
The indicator draws a moving average line calculated based in the low and high prices over the given interval of bars.Calculation formula MinMaxMA[i] = (Min + Max)/2 where Min, Max...
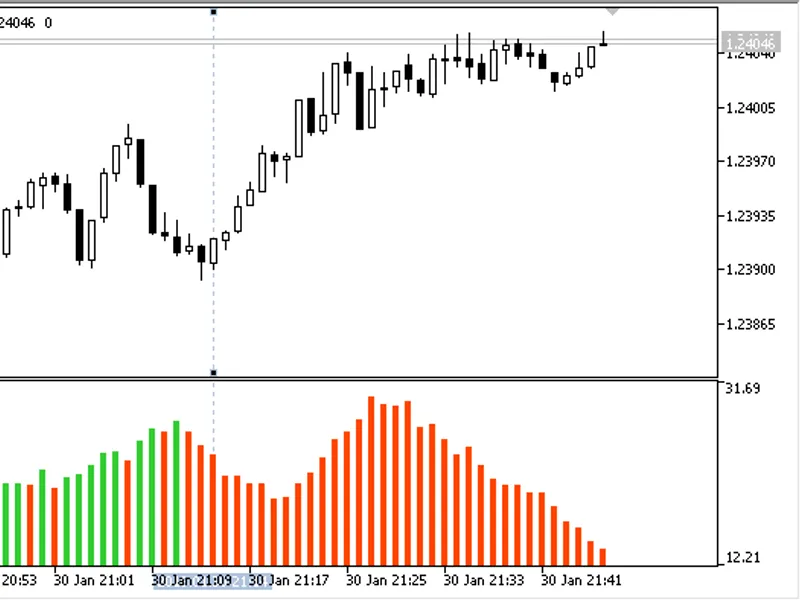
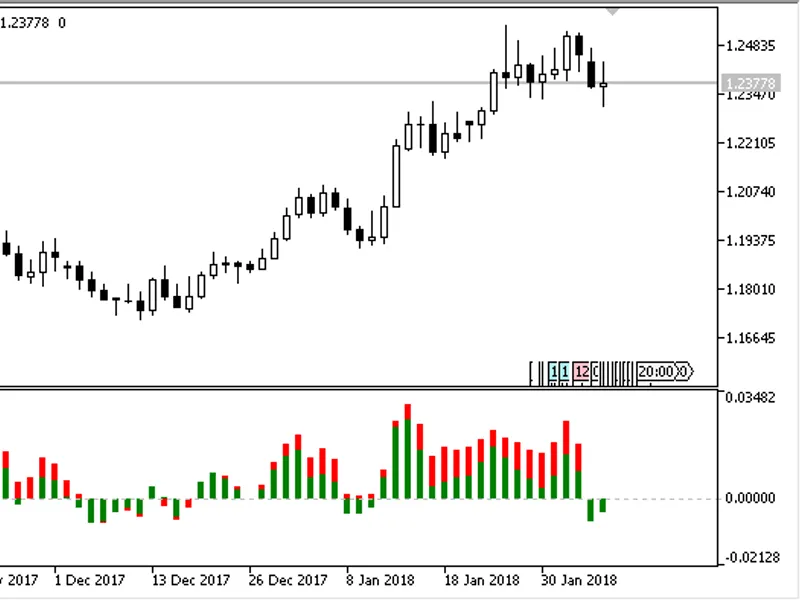
The indicator draws candlesticks in a separate window in the form of a histogram from the zero line.It has two parameters:Bullish candle color- the color of bullish candlesticks;Be...
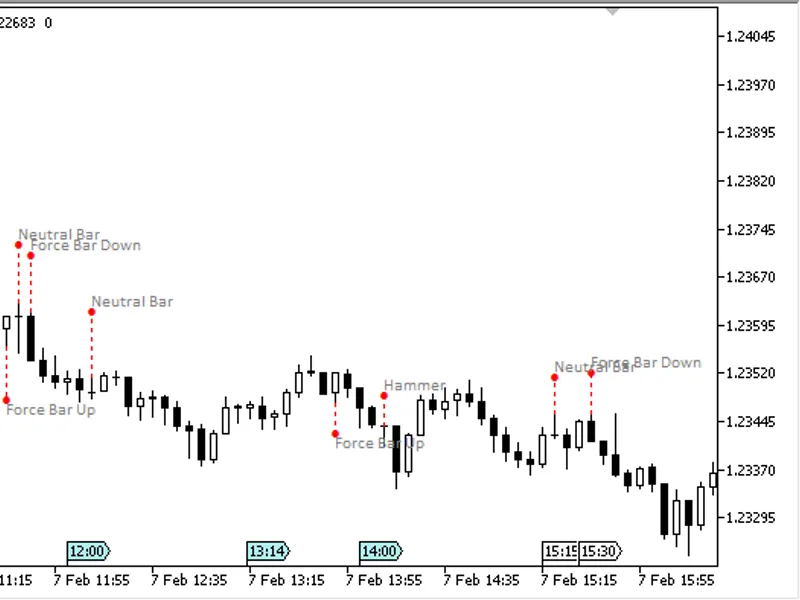
The indicator searches for thirty popular candlestick patterns and displays them on the price chart.The indicator can be configured to show separate patterns as well as groups: one...
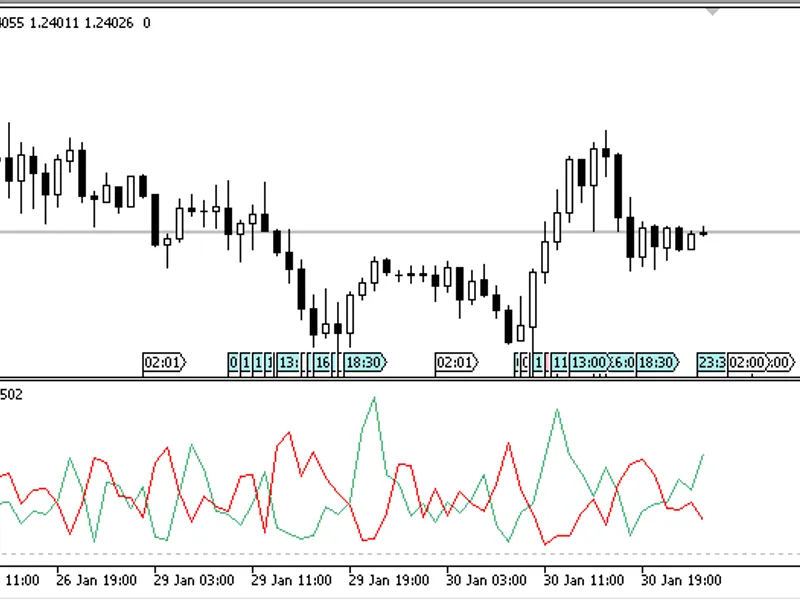
The Vector indicator tracks the market state and generates relatively few false signals. Signals are formed when the zero line is crossed.The indicator has two oscillators - the fa...
This non-trading Expert Advisor is designed for the simple trailing of stop loss and take profit orders of open positions.The EA only works on hedging accounts. Principle of operat...
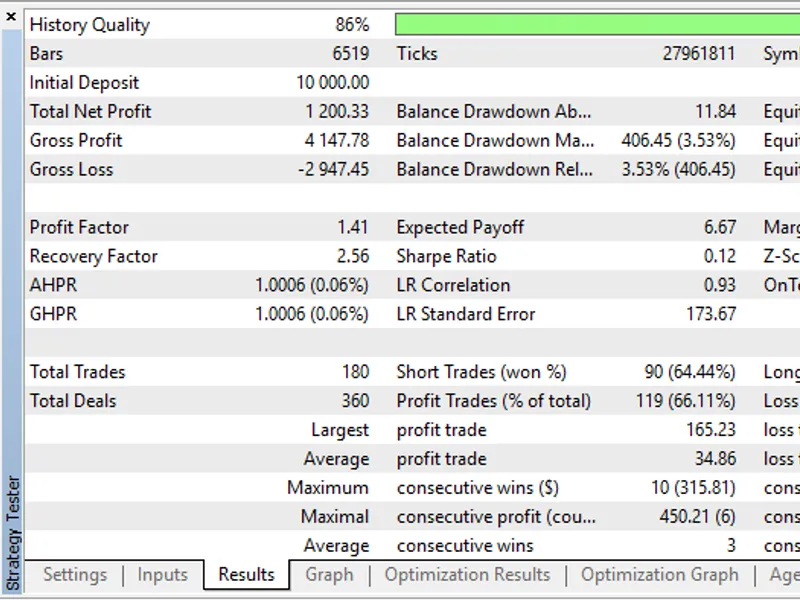
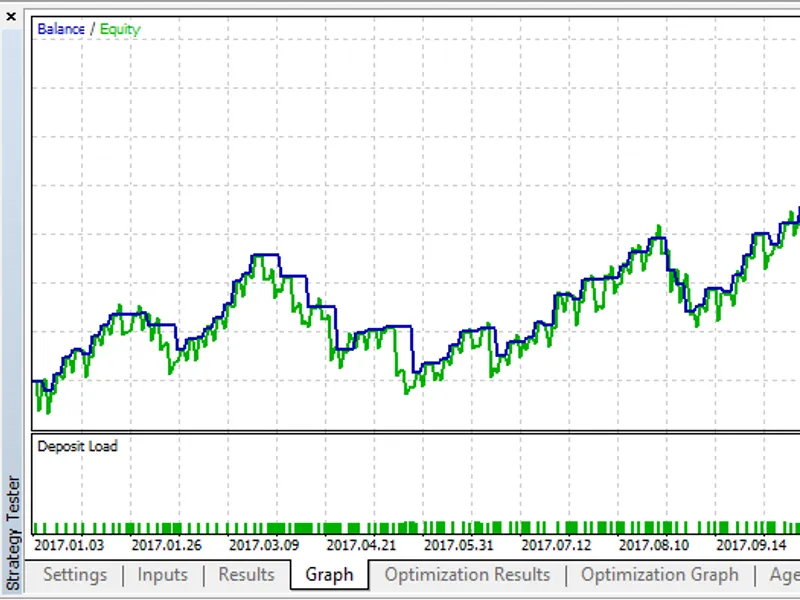
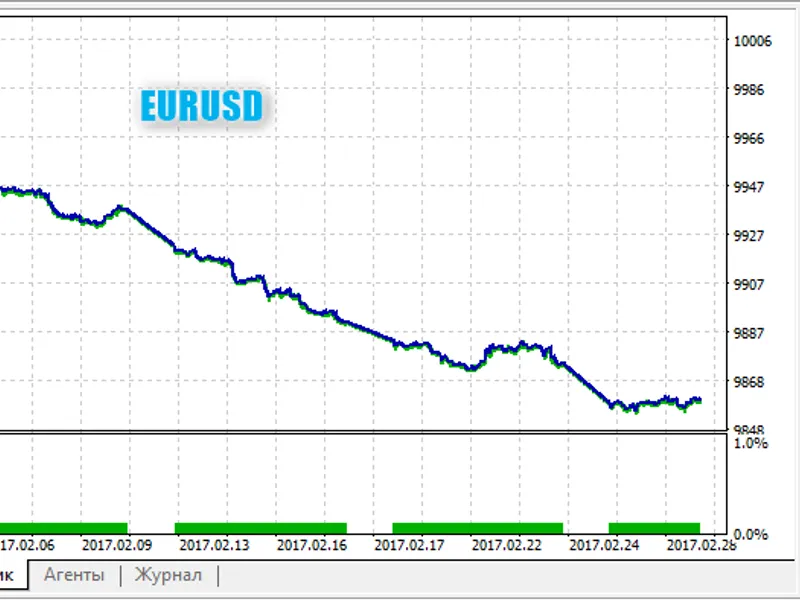
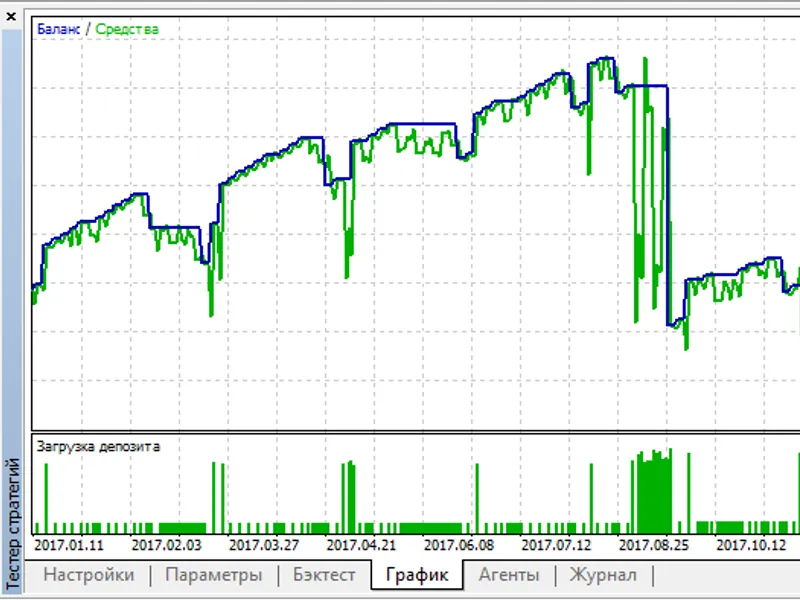
The Expert Advisor checks two parameters: the profitability of the last closed trade and the account balance.Attention: works only on "EURUSD"! Input Parameters Stop Loss (in pips)...
All indicators have hard coded parameters, including the timeframe: "H1". Therefore, it is recommended to run the Expert Advisor on the H1 timeframe and on the EURUSD symbol. You c...
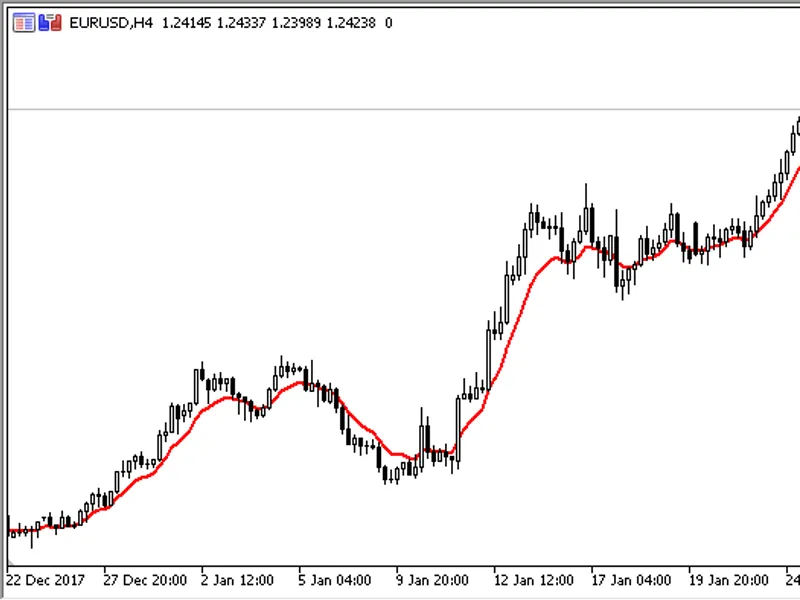
Fractal Adaptive Moving Average Technical Indicator (FRAMA) was developed by John Ehlers. This indicator is constructed based on the algorithm of the , in which the smoothing facto...
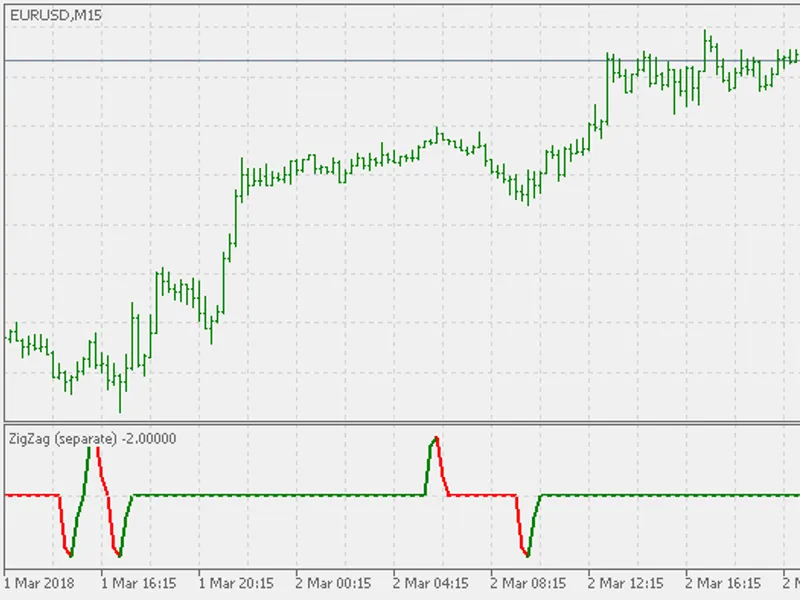
It is not a matter if it is useful or not (ZigZag is, in my opinion a useful indicator), but a matter of avoiding misuse of the indicator and presenting it as something it is not. ...
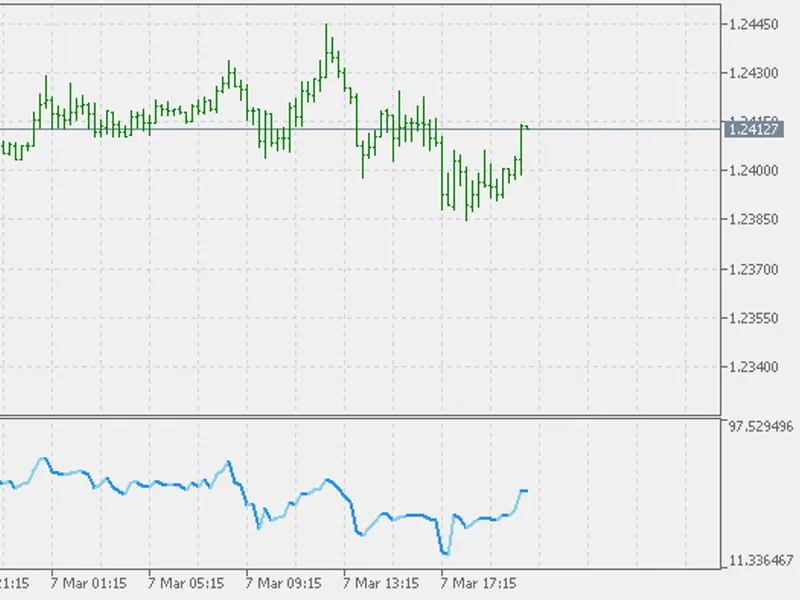
The Dynamic Momentum Index (DMI) is a variable term RSI. When default values are used, the RSI term varies from 3 to 30. The variable time period makes the RSI more responsive to s...
Indicator that shows the current estimated state of the market based on a correlation of 3 Moving Averages.If using default settings, the colors are the following:Light green- tren...
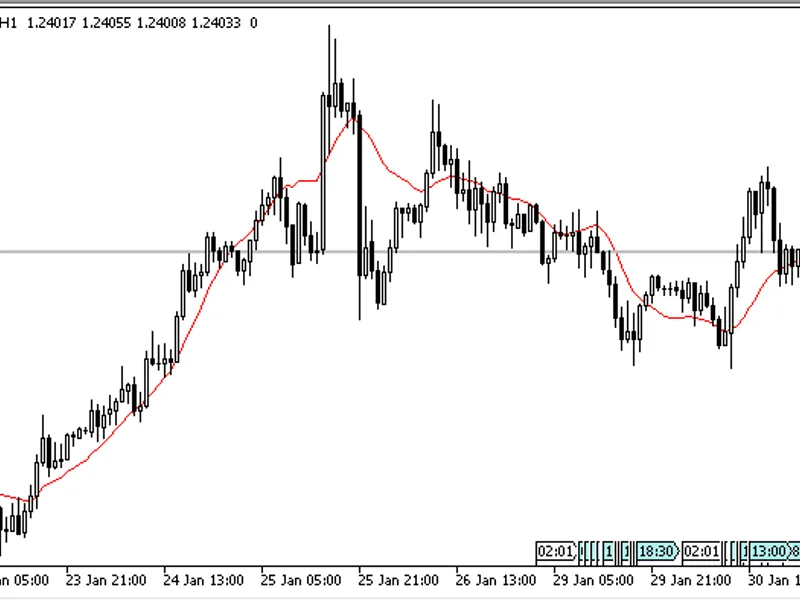
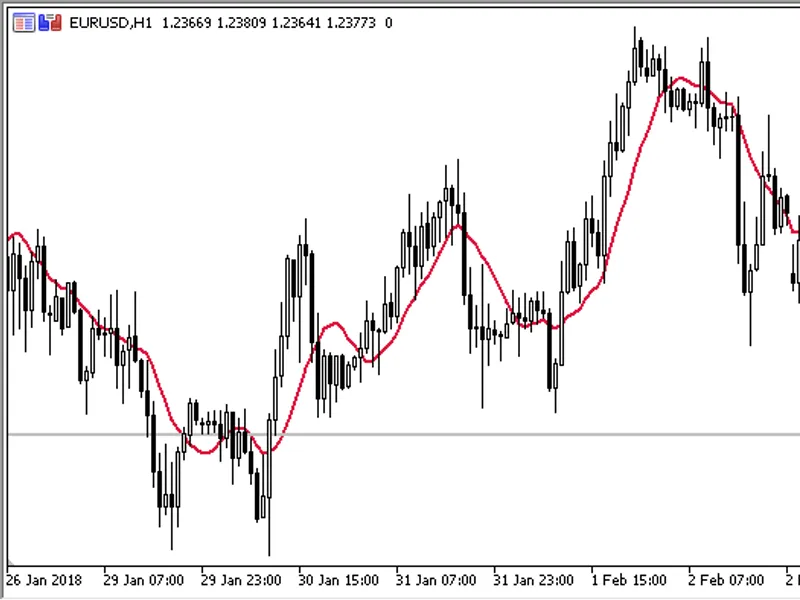
The McGinley Dynamic indicator is designed to follow prices, avoiding whipsaws that are given when conventional Moving Averages are used.Conventional Moving Averages have a fixed p...