


Statistics of candles
Info
The Statistics of candles is a Script for MetaTrader 5 that counting the number of series of bullish and bearish bars. Displaying the result as a chart.
Usage
This tool is typically used for enhancing chart analysis and decision making.
Platform
This Script works exclusively on MetaTrader 5 (both build 600+ and newer versions).
Setup
Place the downloaded file in MQL5/Scripts folder via File ? Open Data Folder in MetaTrader 5.
How to Install and Use Statistics of candles
1. Installation: Move your script file into the MQL/Scripts directory and restart the platform.
2. Execution: Drag the script onto a chart; it will perform a one-time action, such as closing all open orders or clearing chart objects.
3. Editing: Use MetaEditor (F4) to modify code, click "Compile," and verify no errors appear in the terminal before running.
4. Removing: Scripts stop automatically, but you can remove them manually by right-clicking the chart and choosing "Remove Script."
Frequently Asked Questions
Q: How are scripts different from EAs? A: Scripts execute a single action and then stop; EAs monitor the market and trade continuously.
Q: Can I assign a hotkey to a script? A: Yes, right-click the script in the Navigator, select "Set Hotkey," and define your preferred keyboard shortcut.
Q: Why did my script stop? A: Scripts are designed to stop immediately after finishing their programmed command; this is normal behavior.
What this tool does
Counting the number of series of bullish and bearish bars.
Typical Use Case
This Script excels in automated trading and technical analysis on MetaTrader 5.
Compatible Platform & Setup
This Script works on MetaTrader 5. Place the file in the MQL5/Scripts folder and restart the terminal.
Description & Settings
Related: MP C - Measure Popular Candles - another powerful script for MetaTrader 5 traders.
Counting the number of series of bullish and bearish bars. Displaying the result as a chart. Saving the screenshot of the resulting chart. The script uses the class.
Also recommended: Script for Calculation of Candle Statistics - similar script with strong performance on MetaTrader 5.
Input ParametersCount of bars
- the number of bars (from the rightmost bar on the chart), for which the calculation will be preformed;
Verification
- the flag for printing the copied timeseries of this symbol and the resulting array of bar series. NOTE: should only be enabled if the
Count of bars
parameter does not exceed 15-30. Otherwise the amount of printed data will be very large;
Save screenShot
- enable/disable saving of screenshots of the resulting chart;
Sleep (milliseconds)
- a delay in displaying the resulting chart.
Series of bars are coded according to the following principle:
A "bullish" candlestick has the code of "1", a "bearish" candlestick has the code of "-1".
Another parameter for the name of the series is calculated as follows:
Note: the very last series is not included in calculations, because you cannot know how long the series will last.
Screenshots are saved (if
Save screenShot
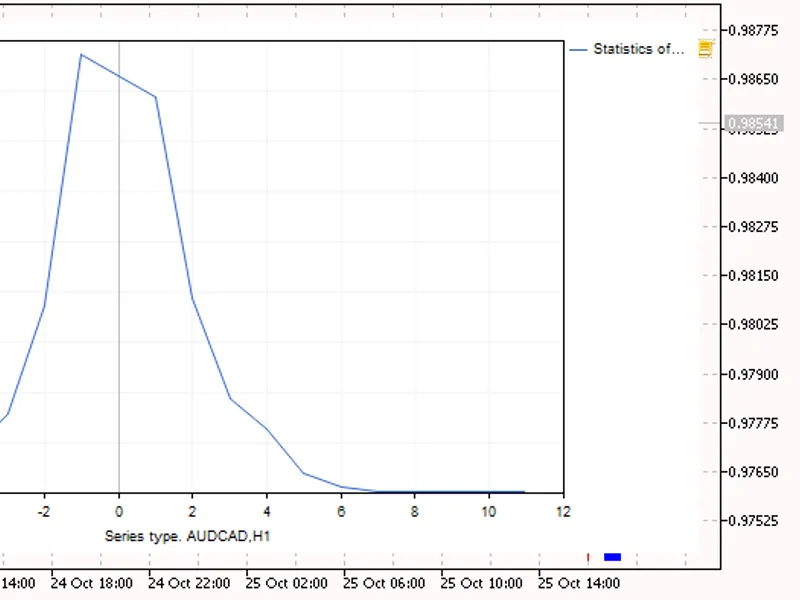
is enabled) to [data folder]\MQL5\Files\Statistics of candles\. An example of a saved screenshots of the resulting charts. Series are drawn along the X axis, i.e. the "-5" series means five bearish bars in a row, and "2" means two bullish bars in a row:
Fig. 1. AUDCAD,H1. 1200 bars
Fig. 2. EURUSD,H1. 1200 bars
Fig. 3. RTS-12.17,M5. 1200 bars
You may also like: Statistics of candles 2 - excellent alternative for script users on MetaTrader 5.
⚠ Limitations & Risk Warning
- This tool is provided for educational and testing purposes only.
- Past performance does not guarantee future results.
- Trading involves substantial risk of loss. Use on a demo account first.
- Results may vary depending on market conditions, broker, and settings.
- We recommend thorough backtesting and forward testing before using with real funds.