




Candlestick Statistics Calculation Tool
Info
The Candlestick Statistics Calculation Tool is a Script for MetaTrader 5 that this script calculates and displays statistics for candlestick bodies and shadows on the current chart. The statistics include minimal, maximal, and average values, presented for three groups: bullish candles, bearish candles, and all candles combined.
Usage
This tool is typically used for enhancing chart analysis and decision making.
Platform
This Script works exclusively on MetaTrader 5 (both build 600+ and newer versions).
Setup
Place the downloaded file in MQL5/Scripts folder via File ? Open Data Folder in MetaTrader 5.
How to Install and Use Candlestick Statistics Calculation Tool
1. Installation: Move your script file into the MQL/Scripts directory and restart the platform.
2. Execution: Drag the script onto a chart; it will perform a one-time action, such as closing all open orders or clearing chart objects.
3. Editing: Use MetaEditor (F4) to modify code, click "Compile," and verify no errors appear in the terminal before running.
4. Removing: Scripts stop automatically, but you can remove them manually by right-clicking the chart and choosing "Remove Script."
Frequently Asked Questions
Q: How are scripts different from EAs? A: Scripts execute a single action and then stop; EAs monitor the market and trade continuously.
Q: Can I assign a hotkey to a script? A: Yes, right-click the script in the Navigator, select "Set Hotkey," and define your preferred keyboard shortcut.
Q: Why did my script stop? A: Scripts are designed to stop immediately after finishing their programmed command; this is normal behavior.
What this tool does
This script calculates and displays statistics for candlestick bodies and shadows on the current chart.
Typical Use Case
This Script excels in automated trading and technical analysis on MetaTrader 5.
Compatible Platform & Setup
This Script works on MetaTrader 5. Place the file in the MQL5/Scripts folder and restart the terminal.
Description & Settings
Related: statistics of candles - another powerful script for MetaTrader 5 traders.
This script calculates and displays statistics for candlestick bodies and shadows on the current chart. The statistics include minimal, maximal, and average values, presented for three groups: bullish candles, bearish candles, and all candles combined. The results are shown in the upper left corner of the chart.Also recommended: statistics of candles 2 - similar script with strong performance on MetaTrader 5.
The calculation interval can be defined by several methods:
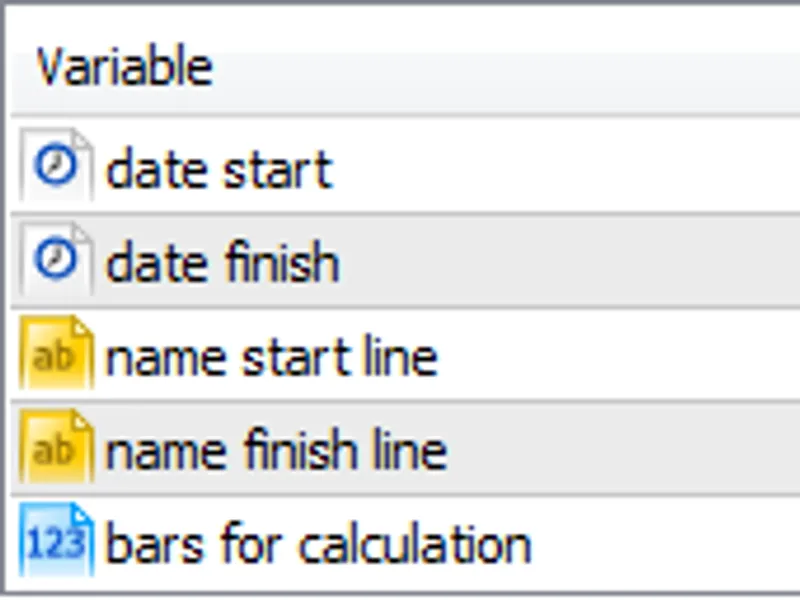
1. Input Parameters: The interval is determined by five initial input parameters. It can also be specified using two vertical lines, whose names are defined in the input parameters.
2. Date Range: If no vertical lines are present and the 'bars for calculation' parameter is set to 0, the start and finish dates for the calculation are taken from the 'date start' and 'date finish' input parameters.
3. Vertical Lines: If vertical lines with names defined by 'start line' and 'name finish line' inputs are present and 'bars for calculation' is 0, the start and finish dates are determined by the time properties of these vertical lines.
4. Number of Bars: If 'bars for calculation' is greater than 0, the script calculates statistics for the specified number of completed bars. The current, uncompleted bar is excluded from the calculations.
Error Handling: The script will not perform any calculations and will terminate if only one vertical line is present ('name start line' or 'name finish line'), if the start time is after the finish time, or if 'bars for calculation' is negative.
Other Input Parameters:
- Digits: Specifies the number of decimal places (4 or 5) used for normalization and string formatting.
- Colors: Allows customization of the colors for each group (bullish, bearish, all).
- Font Size: Controls the size of the text labels displayed on the chart.
- Delete Text Labels: If set to true, the script will only delete existing text labels from the chart and will not perform any calculations.
The script includes internal comments for better understanding. This tool was updated for 2026.
You may also like: script to extract candlesticks data from all time frames to cs v - excellent alternative for script users on MetaTrader 5.
Source Code
#property copyright "robotfx"
#property version   "1.00"
#property script_show_inputs
input datetime start_date="2013.01.01 00:00:00";         // date start
input datetime finish_date="2013.08.01 00:00:00";        // date finish
input string   start_line="q1";                          // name start line
input string   finish_line="q2";                         // name finish line
input int      barsc=0;                                  // bars for calculation
input bool     sfd=true;                                 // 4 digits - true, 5 digits - false
input color    colorbullish=clrgreen;                    // color: bullish candles
.......
⚠ Limitations & Risk Warning
- This tool is provided for educational and testing purposes only.
- Past performance does not guarantee future results.
- Trading involves substantial risk of loss. Use on a demo account first.
- Results may vary depending on market conditions, broker, and settings.
- We recommend thorough backtesting and forward testing before using with real funds.