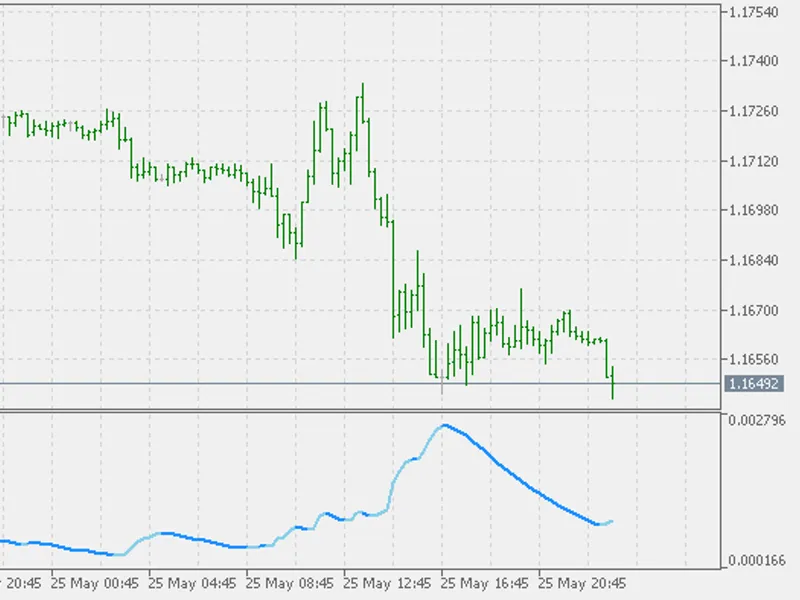
By definition, the Standard Deviation(SD, also represented by the Greek letter sigma σor the Latin letter s) is a measure that is used to quantify the amount of variation or disper...
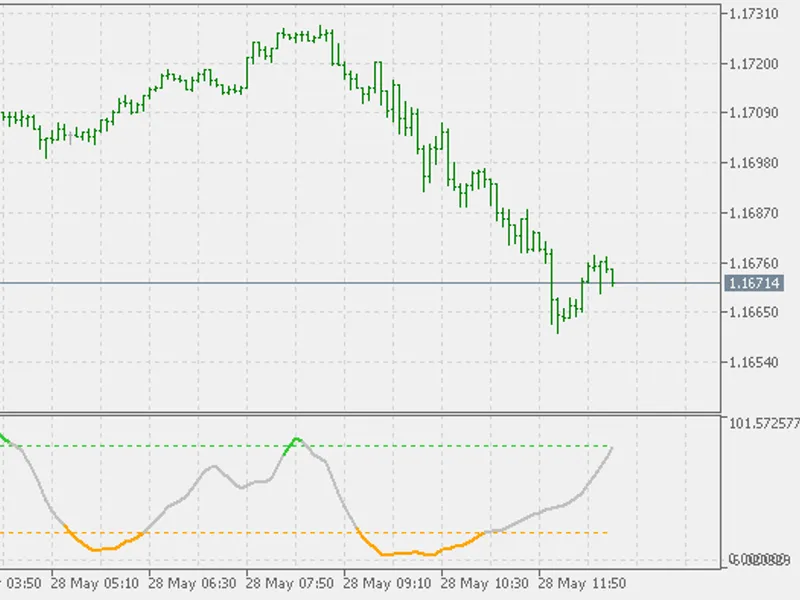
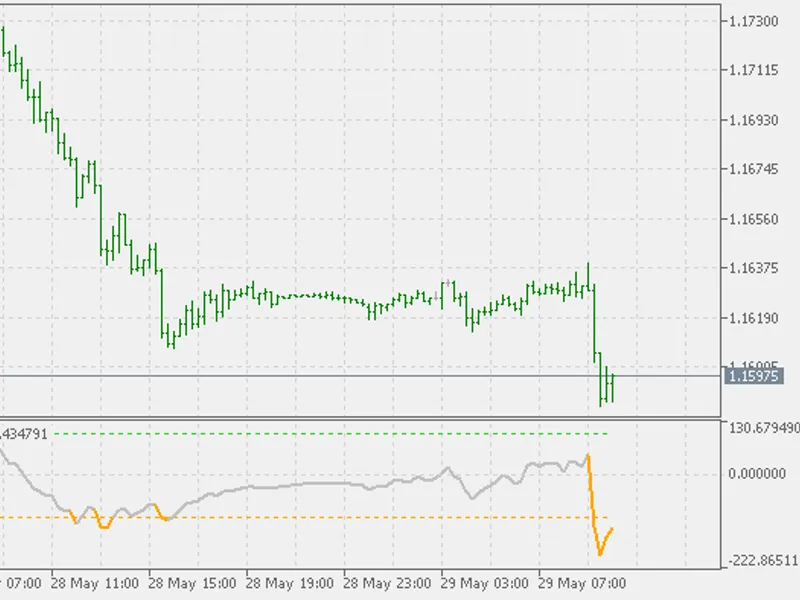
Indicator combining two well known indicators: CCI and Stochastic.This is a Stochastic of CCI. One possible issue that CCI can cause (it is not widely known that CCI actually does ...
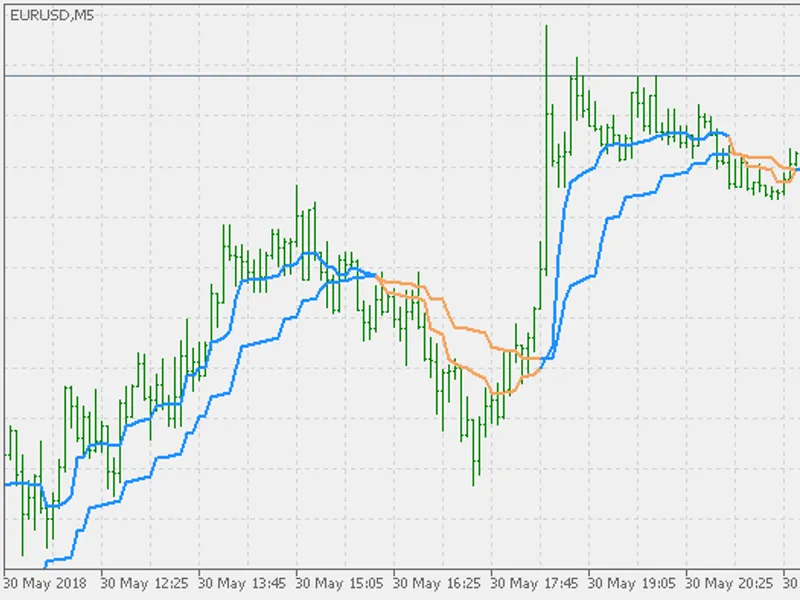
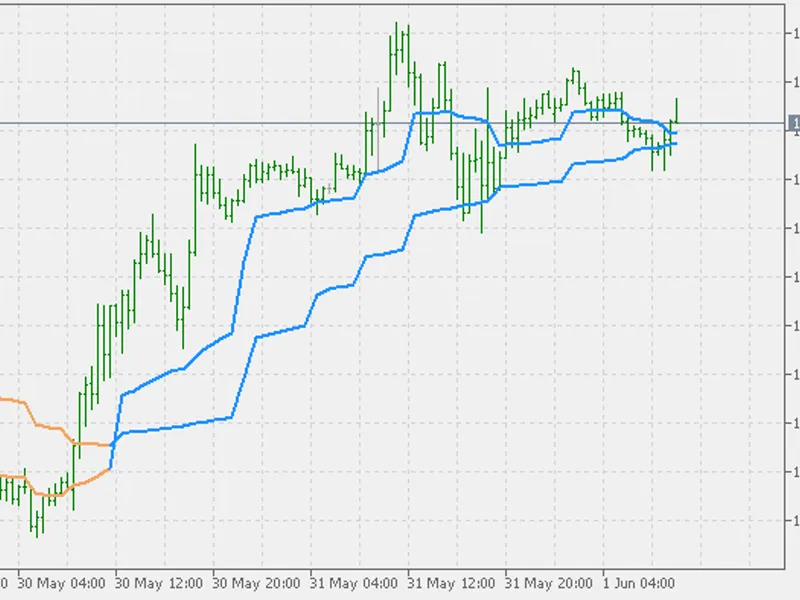
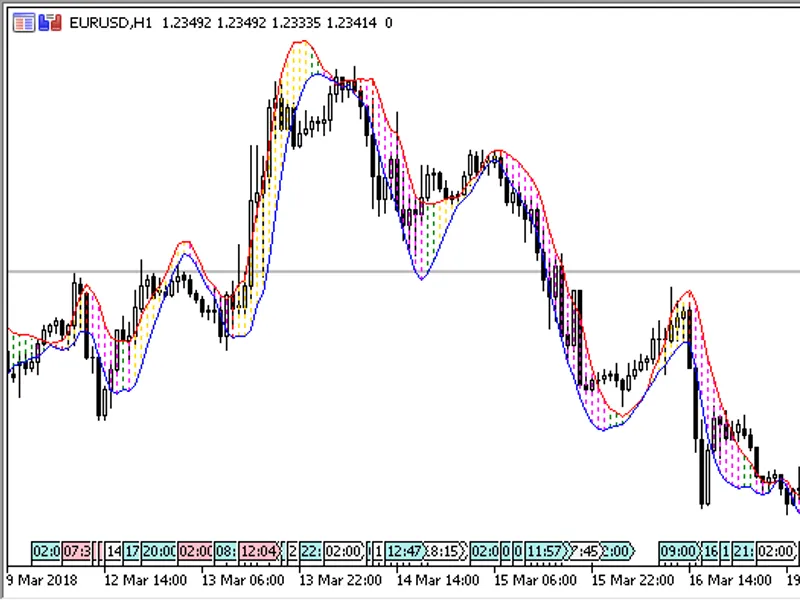
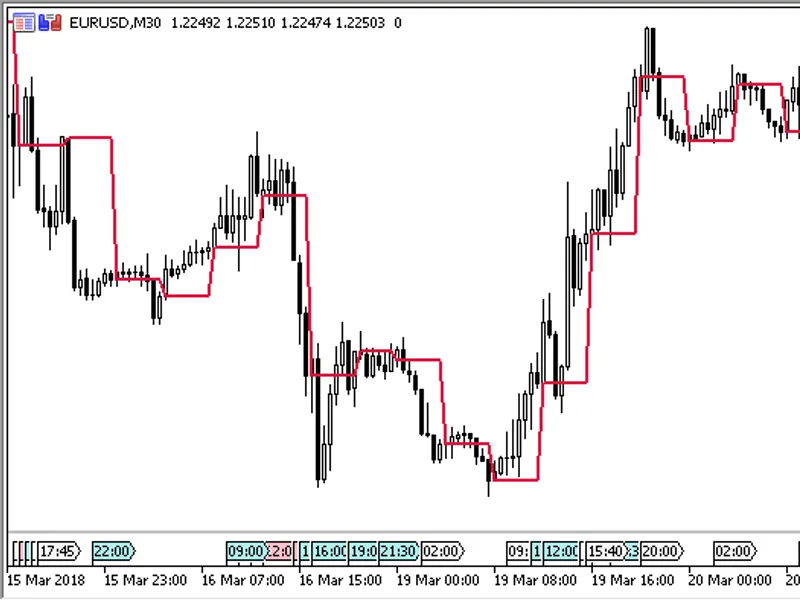
Usually MESA Adaptive Moving Average (MAMA) is displayed on chart as two values. That sometimes is misleading since it is not often explained what are the traders actually looking ...
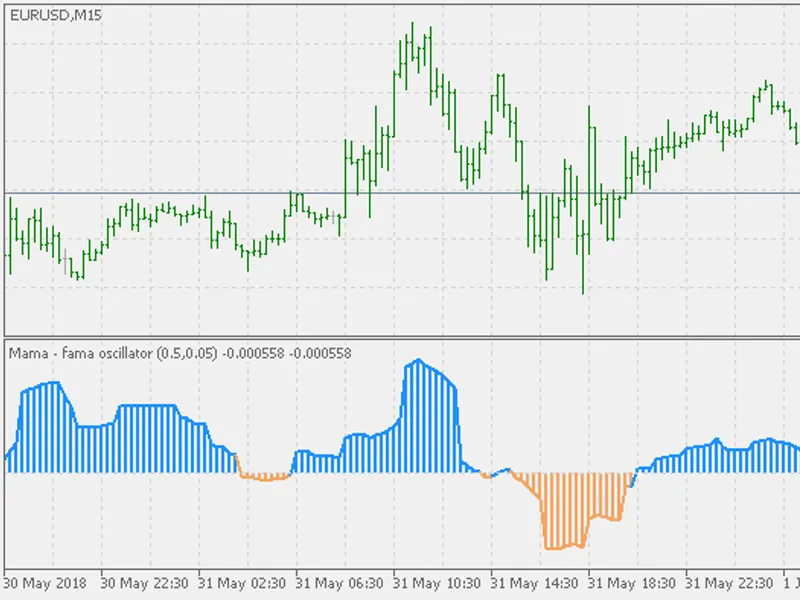
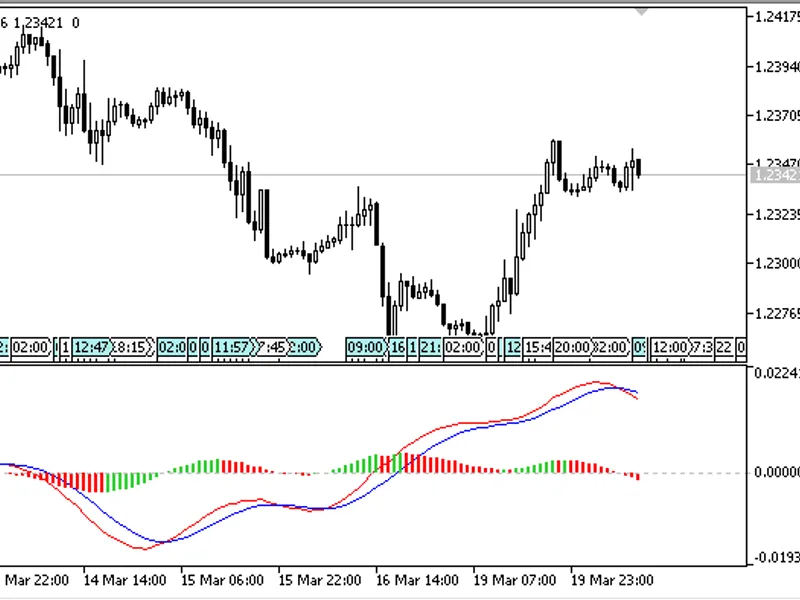
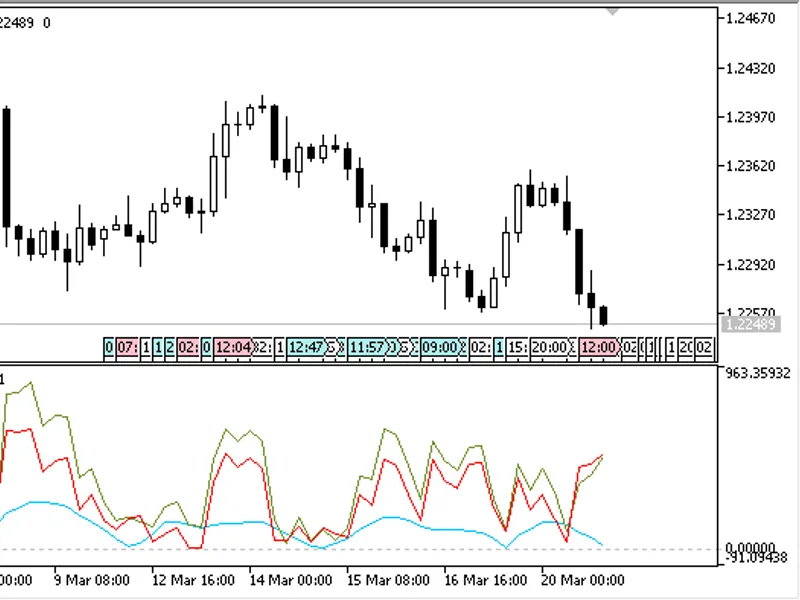
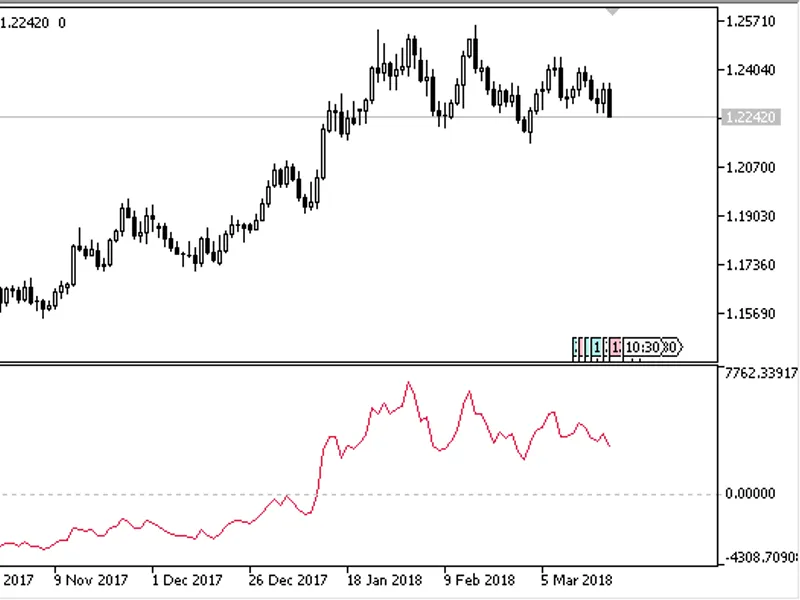
Combination of MAMA (MESA Adaptive Moving Average) and FAMA (Following Adaptive Moving Average) made as an oscillator.It can be used in a similar way as similar oscillators - indic...
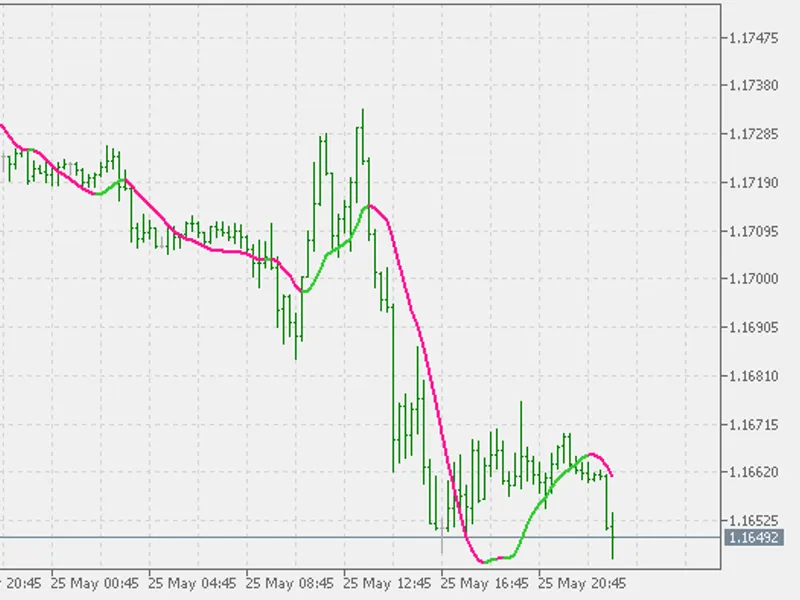
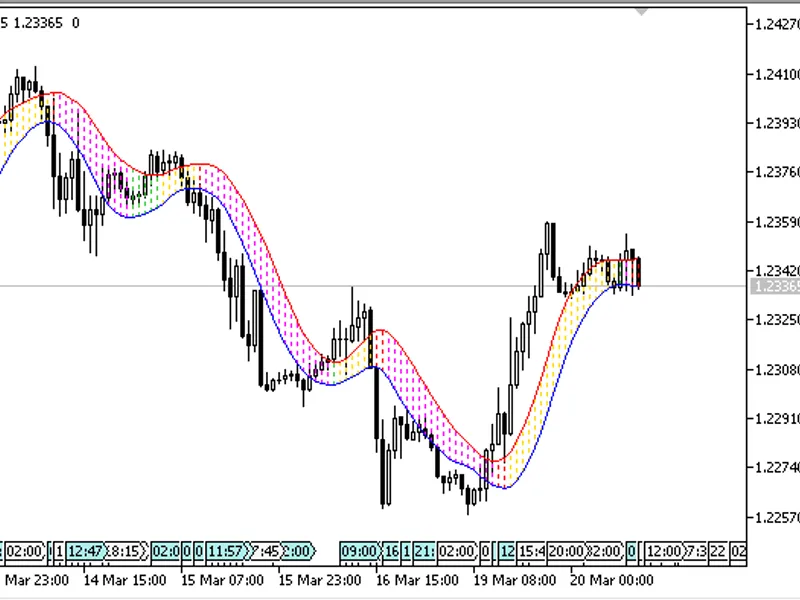
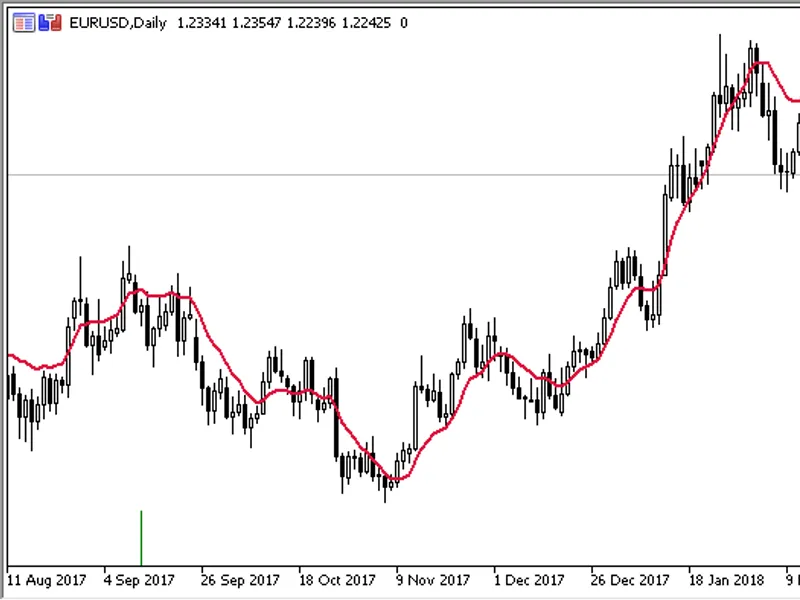
The MESA Adaptive Moving Average (MAMA) and the Following Adaptive Moving Average (FAMA) combination (originally published here ) made to be multi timeframe.Timeframes supported ar...
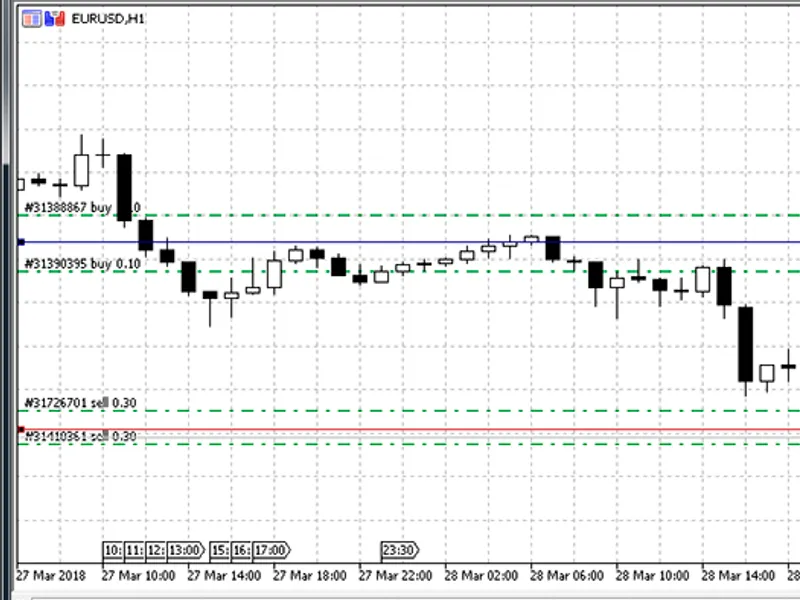
Based on the MQL4 code by Evgeny Trofimov .The script calculates and shows on a chart breakeven levels separately for open BUY and SELL positions.If the number of position changes,...
The MACD indicator, calculated based on a Moving Average which is constructed by the Linear Regression method (LSMA ).It has five input parameters:Fast LSMA period- fast LSMA calcu...
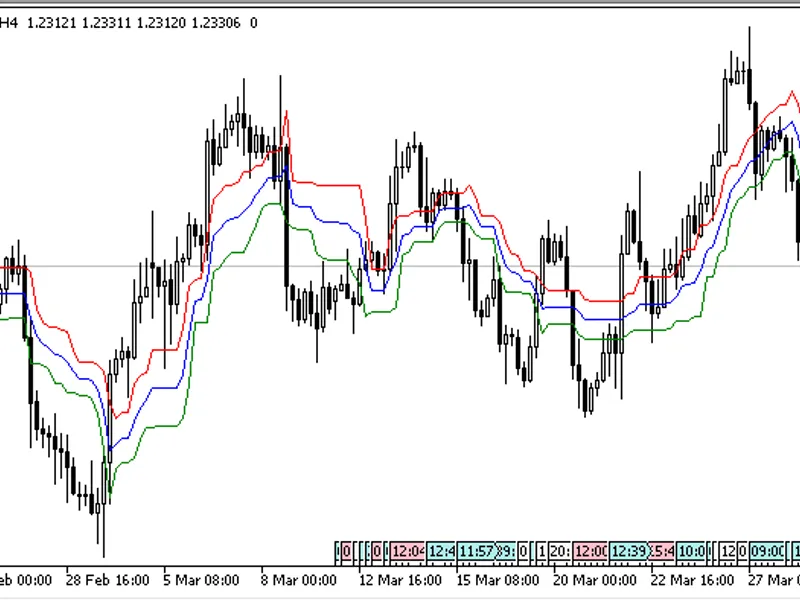
The indicator is a variation of Bollinger Bands and Envelopes, based on two moving averages calculated by the Linear Regression method (LSMA ).It has one input parameter:Period- LS...
The indicator is a variation of Bollinger Bands and Envelopes, based on two smoothed moving averages calculated by the Linear Regression method (LSMA ).It has two parameters:Period...
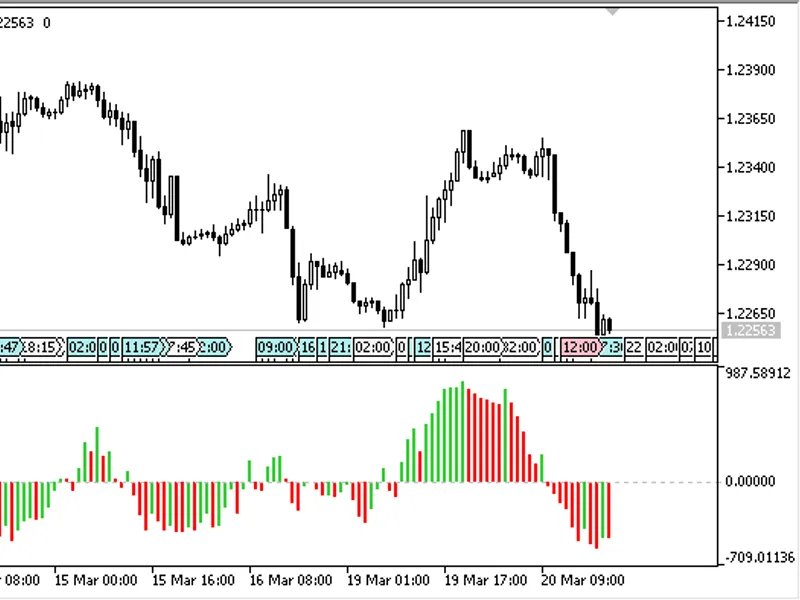
This oscillator indicator provides an interesting method for presenting volume data. It displays the total volume over the selected period.Volume data can be represented in several...
The MA_Difference trend indicator displays the absolute difference between:the price and the MA1 the price and the MA2 MA1 and MA2 The indicator has nine input parameters:MA1 perio...
A simple indicator. Shows the line of the opening of a period specified in settings.It has one input parameter:Timeframe- the timeframe, for which the indicator displays the open p...
Price Volume Trend (PVT) is an indicator of price trend and volume, similar to the standard On Balance Volume (OBV) indicator.The amount of the volume to be added to the current va...
The Recursive Trendline (RTL) indicator shows the trend as a recursive line.It has two parameters:Period- calculation period;Applied price- price used for calculations. Calculation...
The TOSC oscillator indicator. It shows the difference between the exponential moving average and the .It has two parameters:Period- period;Applied price- price used for calculatio...
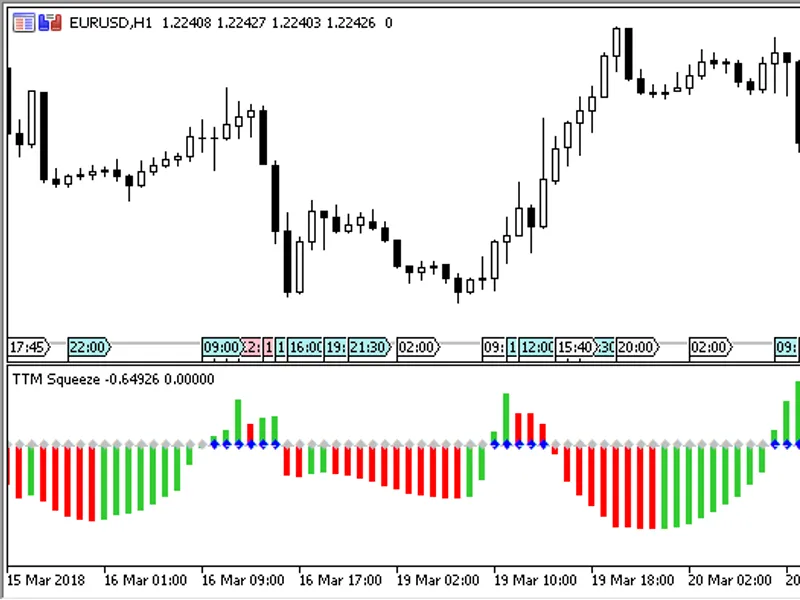
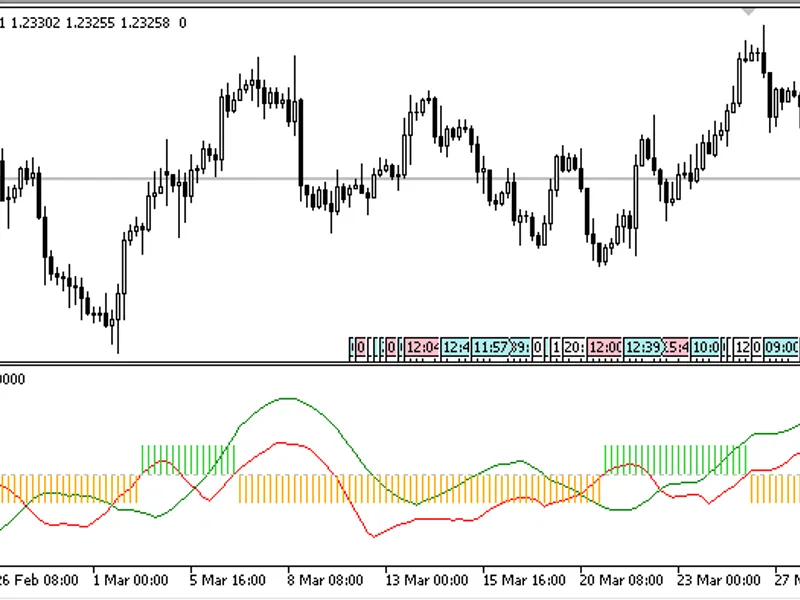
The Trade The Markets Squeeze indicator. The main idea is to trade only when Bollinger Bands are located within Keltner Bands and thus form trade zones.The indicator is drawn as a ...
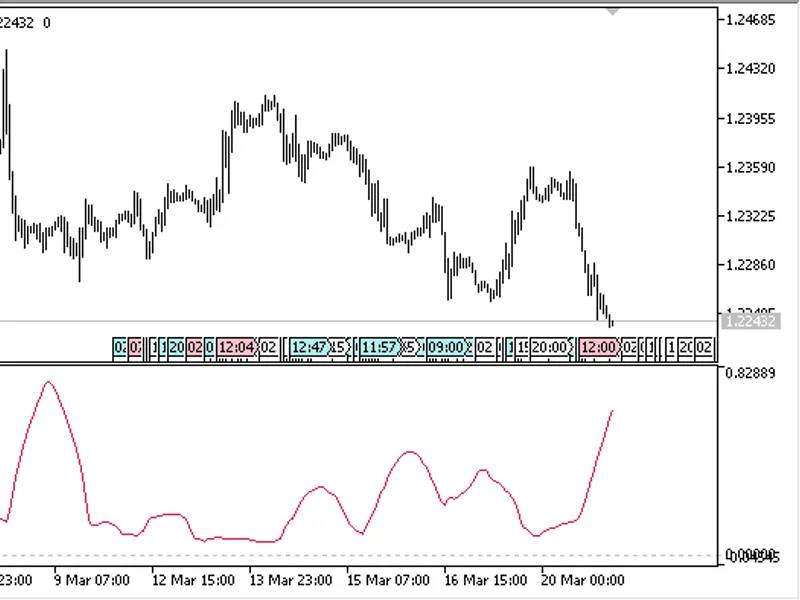
Ulcer Index (UI) shows the volatility decrease risk. It indicates lowering volatility, i.e. a possible drawdown or recovery within a given period.The indicator has three input para...
This indicator is an oscillator calculated by the following formula:JPO = MA(close[period] - (close[period-1]/2 + close[period-2]/2)) - (0 - (close[period] - close[period-4])) The ...
The Highest Lowestindicator searches for bars having High above the High of bars on the left and on the right, as well as bars having Low below the Low of bars on the left and on t...
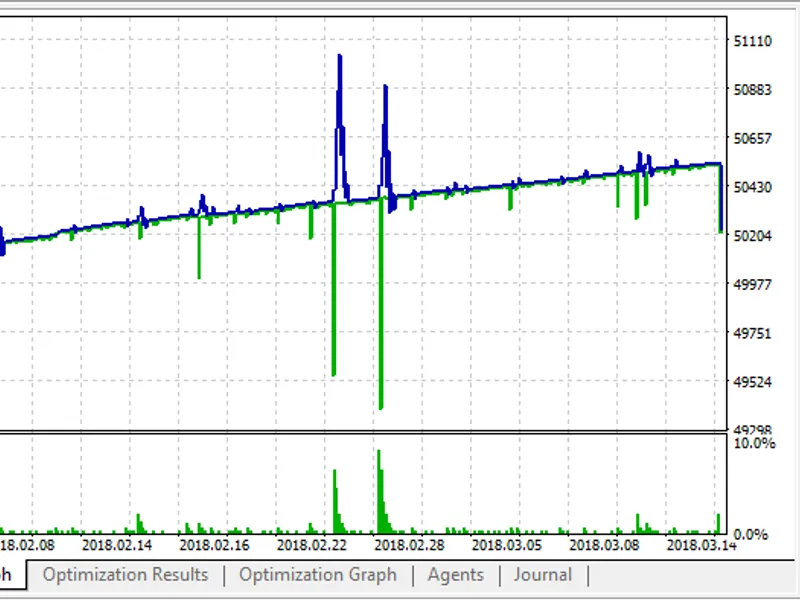
The Expert Advisor places a grid of pending Buy Stop and Sell Stop orders. When the profit reaches or exceeds Profit purpose, all positions are closed and all pending orders are de...
The indicator displays on the chart the Open, High and Low levels of the period specified in parameters.You can choose between two level display modes:High/Low; Open/Close. and two...
The indicator displays the average range for the specified period.It can show two types of ranges:High/Low; Open/Close. Two modes for rendering results are available:Absolute value...
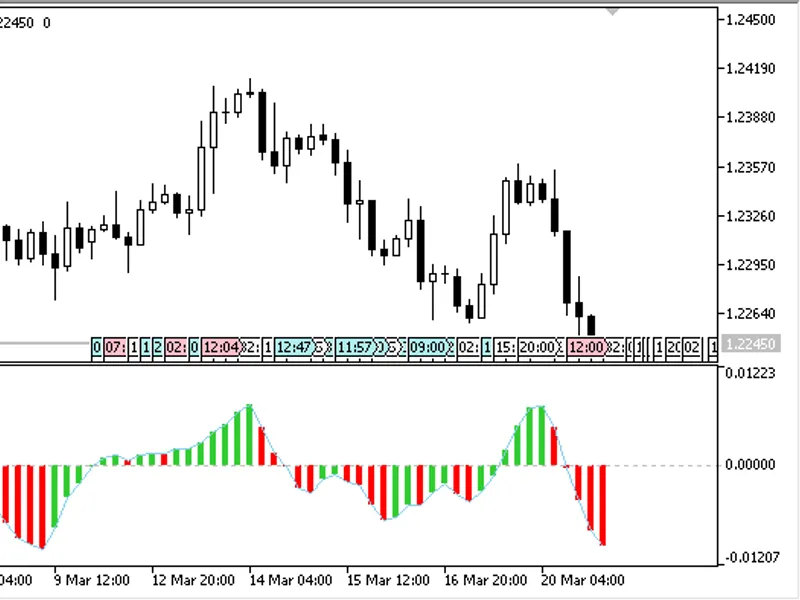
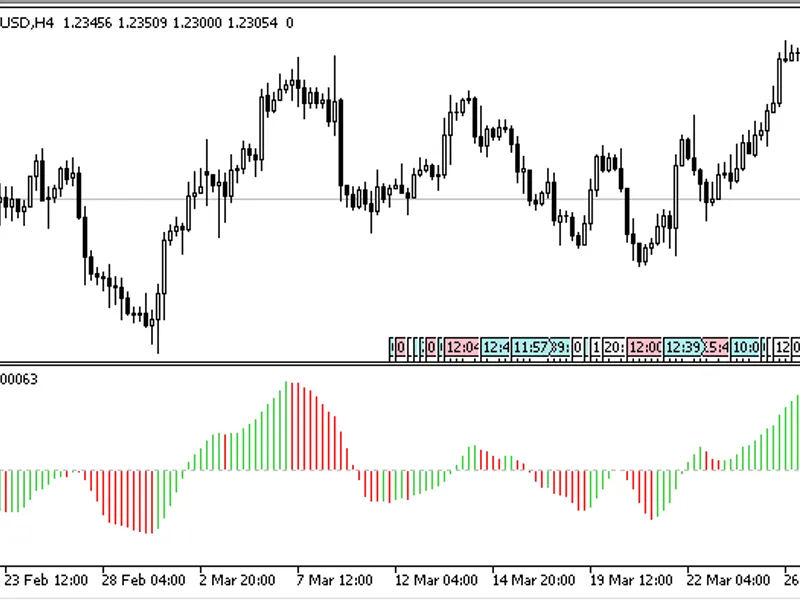
This indicator is a variation of Awesome Oscillator (AO) with the possibility to customize parameters:MA Fast period- fast Moving Average period;MA Slow period- slow Moving Average...
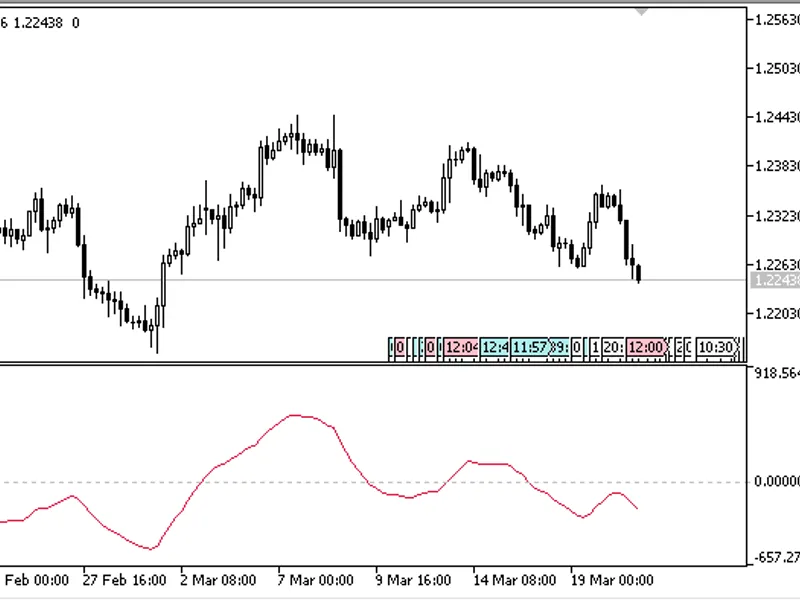
The Detrended Synthetic Price oscillator shows price movement trends without taking into account the trend component. It is calculated as the difference between EMA and a half-peri...
The Point of Balance indicator.It is calculated by the following formula:whereMinH, MaxH - is the maximum and minimum of HIGH prices over the period; MinL, MaxL - is the maximum an...
The indicator is drawn as two lines and a histogram:TD Index- the trend index;Direction- trend direction line;Signal- trade direction histogram. It has two parameters:Period- calcu...
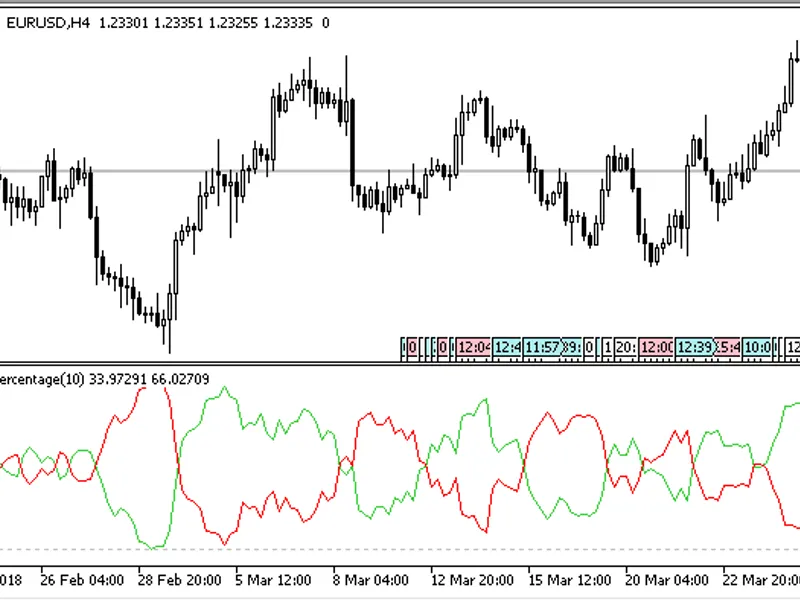
The indicator shows the percentage ratio of bullish and bearish bars in the given interval.It has two parameters:Period- calculation period;Applied price- price used for calculatio...
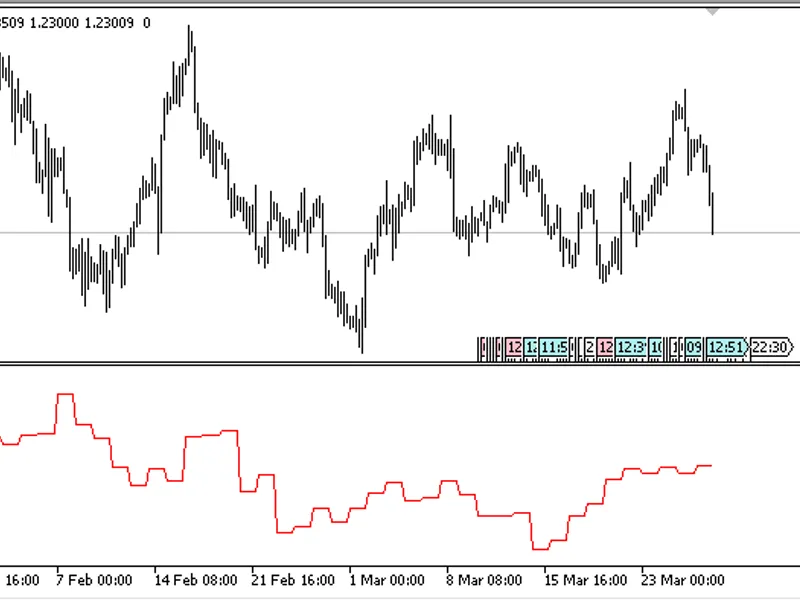
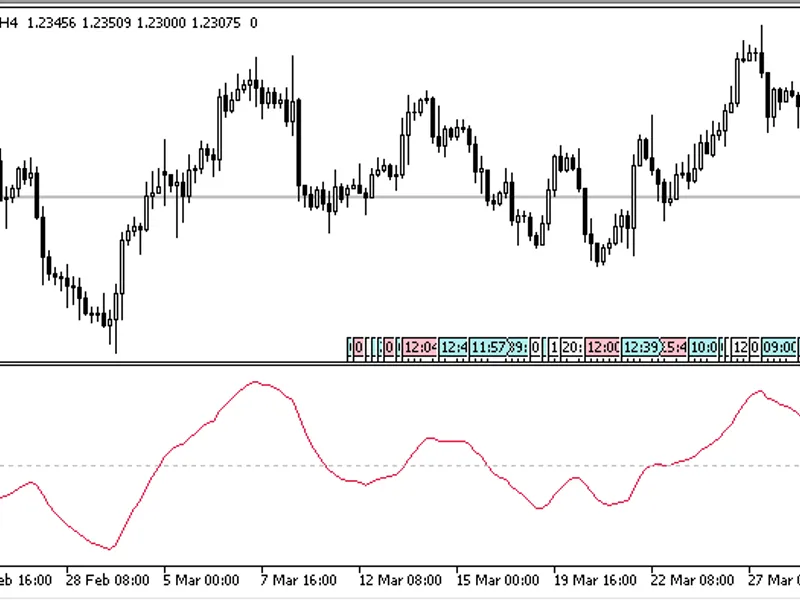
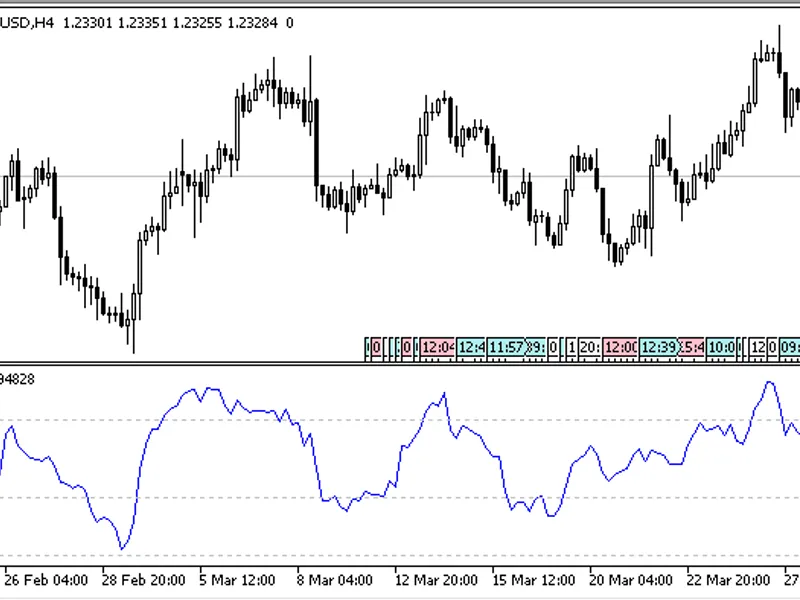
The indicator shows a line of the unsmoothed RSI in a separate chart window.It has four input parameters:Period- calculation period;Applied price- the calculation price;Overbought-...
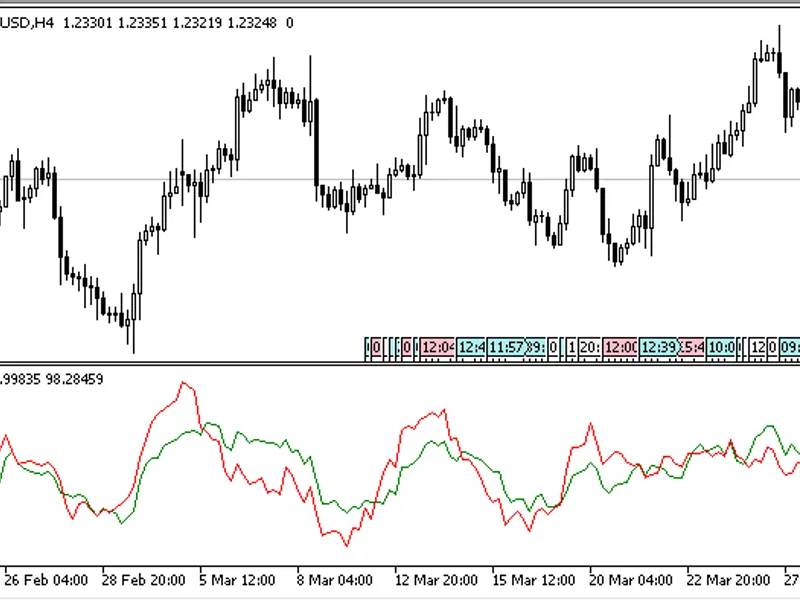
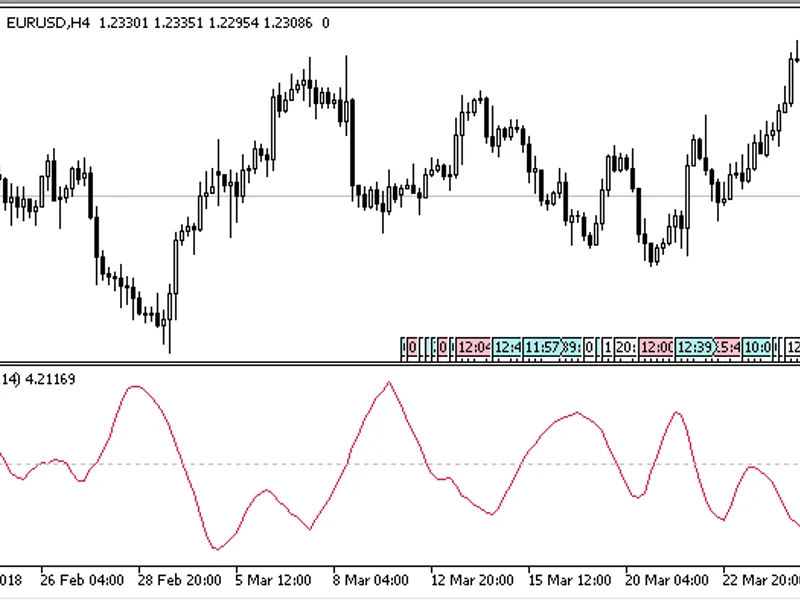
The oscillator indicator shows the velocity/acceleration.The indicator has three input parameters:Velocity period- velocity calculation period;Acceleration period- acceleration cal...
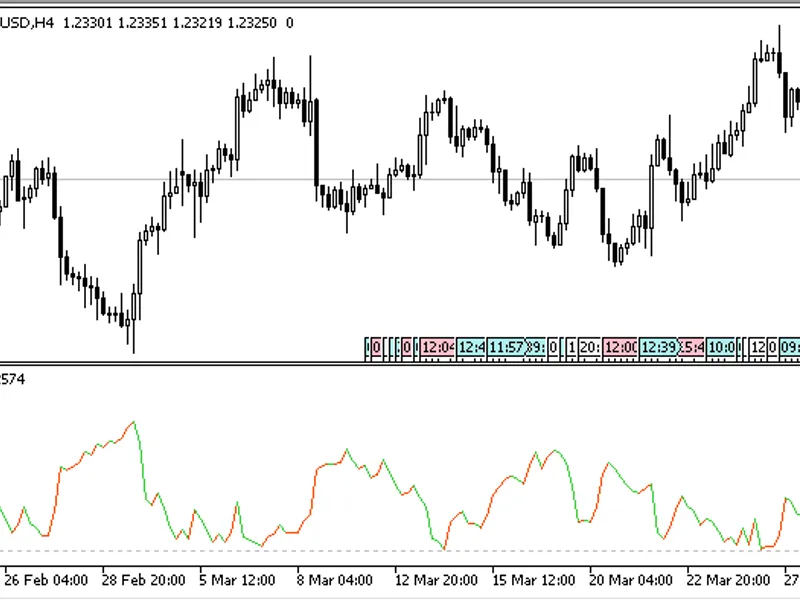
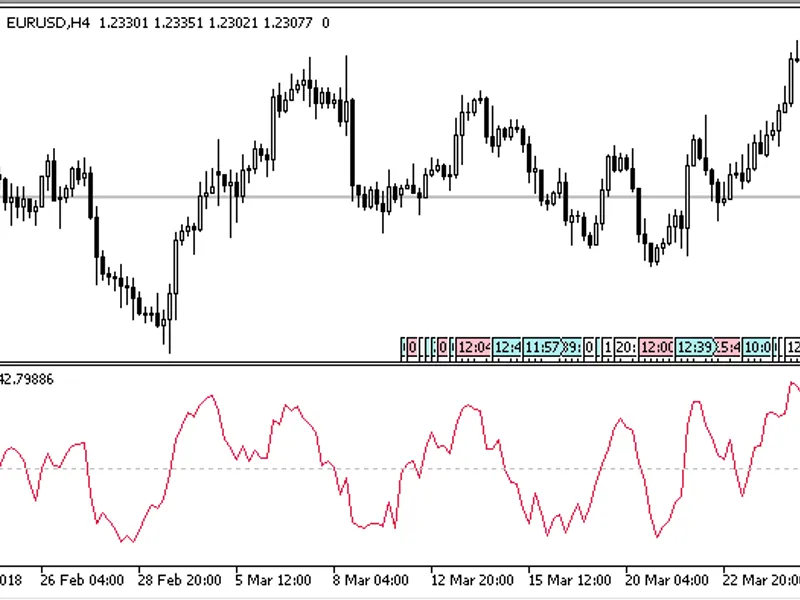
The volatility index oscillator (VIX).It has two parameters:Period - calculation period (default 22)Drawing style:Line - a colored line Histogram - a colored histogram The original...
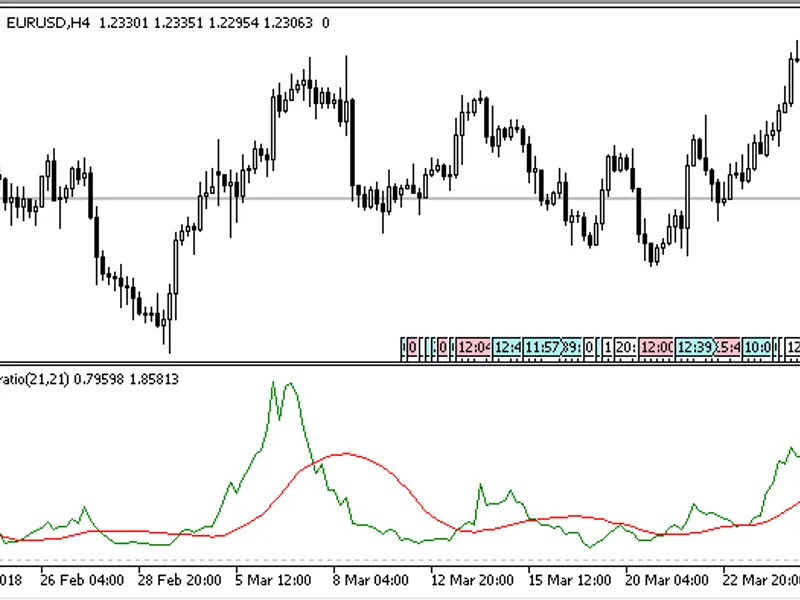
The indicator shows the ratio of two Moving Averages calculated using the High/Low and Open/Close values for a given period.It has one input parameter:Period - calculation period...
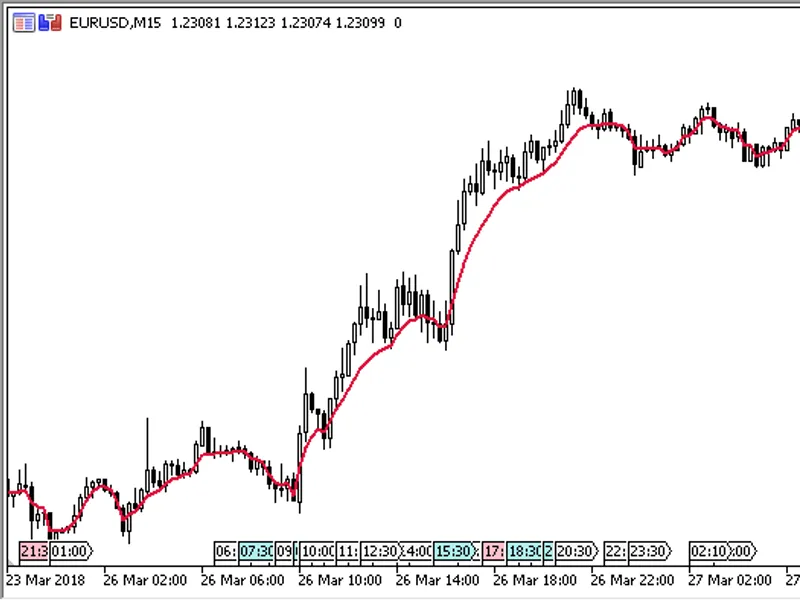
The indicator predicts a probable price reversal. The reversal of the indicator line suggests that the price direction may change soon.The indicator has three input parameters:Fast...
The indicator shows the ratio between bullish and bearish candlesticks over the specified period.The indicator has three input parameters:Period - calculation periodSmoothing perio...
The DMA indicator, in which the period parameter is the number of days N in the below calculation formula.The indicator has two input parameters:Period - calculation periodApplied ...
The oscillator indicator shows a ratio between bullish and bearish candlesticks over the selected period.It has two parameters:Period - calculation periodMethod - the method of smo...
An indicator of Larry Williams' COT indexIt has one input parameter:Period - calculation period Calculation: MovingAvg(Open-Close, bars used in average)/MovingAvg(Range,bars used i...
An indicator of Larry Williams' COT index (), with a different calculation formulaIt has one input parameter:Period - calculation period Calculation: MovingAvg(Close - Close[Period...
A trend indicator drawn using the CCI and ATR values. It draws on a chart a colored line indicating three directions: uptrend, downtrend and flat.It has two parameters:CCI period- ...
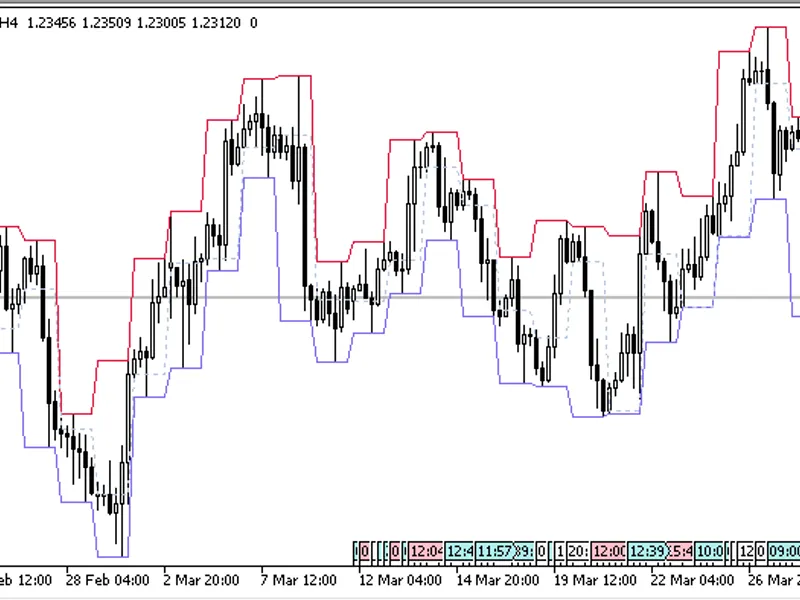
The indicator is similar to Bollinger Bands, but has a signal ("mirror") line.It has four input parameters:Period - calculation periodMA period- MA line calculation periodDeviation...
This indicator is a result of an attempt to combine the theory of movement stability with the Hodrick-Prescott filter.The Hodrick-Prescott filter is a method for smoothing the time...
The indicator shows on a chart High and Low levels over the specified time interval, which is set as hours and minutes of the period beginning and end.The indicator shows two zones...
The Expert Advisor works in a channel drawn by the indicator.The indicator itself is not required for the EA operation, since its data are calculated inside the EA.The EA trades on...
A further development of .An Expert Advisor based on the iBands (Bollinger Bands) indicator. When a signal is received, the EA closes opposite positions (see 'Features' for details...
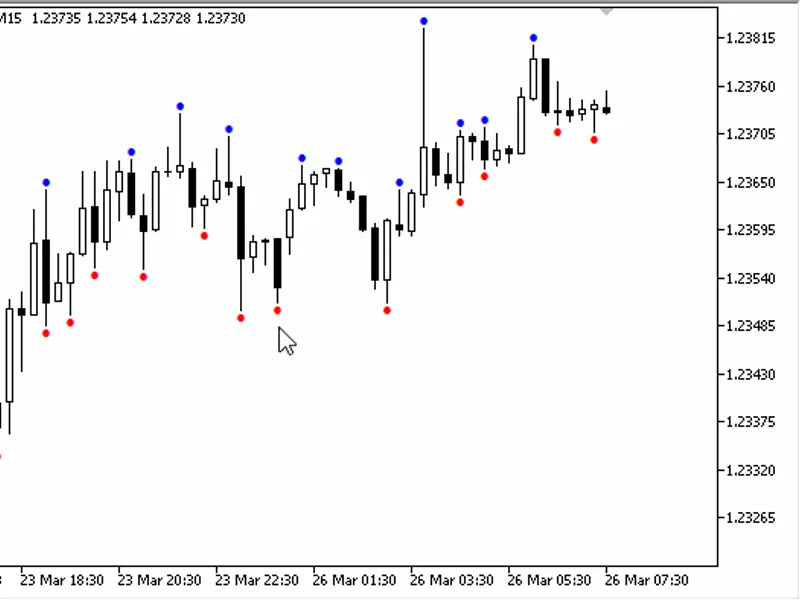
A simple signal indicator.When the direction of the moving average, which is calculated using Close prices, changes, a signal arrow is drawn on the chart:If the direction of the Mo...
A simple indicator, which marks candlesticks with the maximum and minimum volume over a given period on a price chart.It has one input parameter:Period- indicator calculation perio...
T3 MA is an adaptive Moving Average developed by Tim Tillson, first presented in his article 'Smoothing Techniques For More Accurate Signals'.It has lower lagging and better noise ...