Stochastic Momentum Index
This software component for MetaTrader 5 is built to enhance the capabilities of your trading environment. This technical indicator acts as a specialized analysis tool designed to visualize market data. It helps traders identify emerging trends, momentum shifts, and key support or resistance levels by plotting statistical calculations directly onto price charts.
How to Setup and Use Stochastic Momentum Index
1. Installation: Place your file in the MQL/Indicators folder via "Open Data Folder" and restart your terminal.
2. Loading: Find the indicator in the Navigator, drag it onto your chart, and configure the input parameters in the popup window.
3. Customization: Press Ctrl+I to open the indicator list, select your tool, and click "Properties" to change colors, levels, or visual styles.
4. Updating: Replace the old file in the Indicators folder with the new version and restart the platform to apply changes.
Frequently Asked Questions
Q: Why is my indicator not showing? A: Verify the file is in the MQL/Indicators folder, or try right-clicking the "Indicators" tree in the Navigator and clicking "Refresh."
Q: Do custom indicators slow down the platform? A: Too many complex indicators can impact performance; remove unused ones via the "Indicator List" (Ctrl+I).
Q: Can I use MT4 indicators on MT5? A: No, MQL4 and MQL5 are distinct languages; ensure the indicator is compiled specifically for your platform version.
Description & Settings
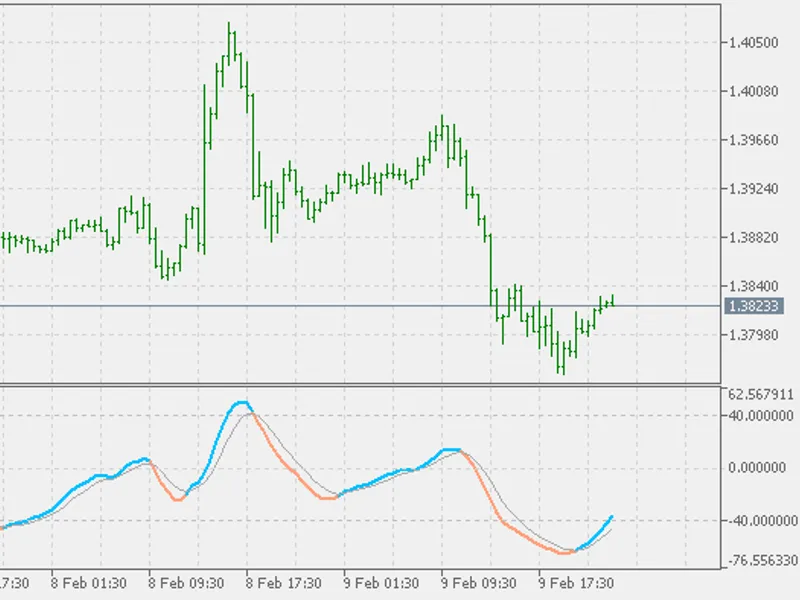
The Stochastic Momentum Index (SMI) was developed by William Blau and was introduced in the January 1993 issue of Technical Analysis of Stocks & Commodities magazine.
It incorporates an interesting twist on the popular Stochastic Oscillator. While the Stochastic Oscillator provides you with a value showing the distance the current close is relative to the recent x-period high/low range, the SMI shows you where the close is relative to the midpoint of the recent x-period high/low range.
The result is an oscillator that ranges between +/- 100 and is a bit less erratic than an equal period Stochastic Oscillator.
When the close is greater than the midpoint of the range, the SMI is positive.
When the close is less than the midpoint of the range, it is negative.
The interpretation of the SMI is virtually identical to the Stochastic Oscillator.
Three popular methods include:
Buy when the SMI falls below a specific level (e.g., -40) and then rises above that level, and sell when the Oscillator rises above a specific level (e.g., +40) and then falls below that level.
However, before basing any trade off of strict overbought/oversold levels it is recommended that you first qualify the trendiness of the market using indicators such as r-squared or Chande Momentum Oscillator. If these indicators suggest a non-trending market, then trades based on strict overbought/oversold levels should produce the best results. If a trending market is suggested, then you can use the oscillator to enter trades in the direction of the trend.
Buy when the SMI rises above its signal line (dotted) line and sell when the SMI falls below the signal line.
Look for divergences. For example, where prices are making a series of new highs and the SMI is failing to surpass its previous highs.
Mr. Blau also notes that a 1-day SMI (with large smoothing periods such as 100) is very sensitive to the close relative to the high and low of the day.