Fisher RV I
This is a powerful addition to your MetaTrader 5 toolkit designed to optimize market analysis and performance. This technical indicator acts as a specialized analysis tool designed to visualize market data. It helps traders identify emerging trends, momentum shifts, and key support or resistance levels by plotting statistical calculations directly onto price charts.
How to Setup and Use Fisher RV I
1. Installation: Place your file in the MQL/Indicators folder via "Open Data Folder" and restart your terminal.
2. Loading: Find the indicator in the Navigator, drag it onto your chart, and configure the input parameters in the popup window.
3. Customization: Press Ctrl+I to open the indicator list, select your tool, and click "Properties" to change colors, levels, or visual styles.
4. Updating: Replace the old file in the Indicators folder with the new version and restart the platform to apply changes.
Frequently Asked Questions
Q: Why is my indicator not showing? A: Verify the file is in the MQL/Indicators folder, or try right-clicking the "Indicators" tree in the Navigator and clicking "Refresh."
Q: Do custom indicators slow down the platform? A: Too many complex indicators can impact performance; remove unused ones via the "Indicator List" (Ctrl+I).
Q: Can I use MT4 indicators on MT5? A: No, MQL4 and MQL5 are distinct languages; ensure the indicator is compiled specifically for your platform version.
Description & Settings
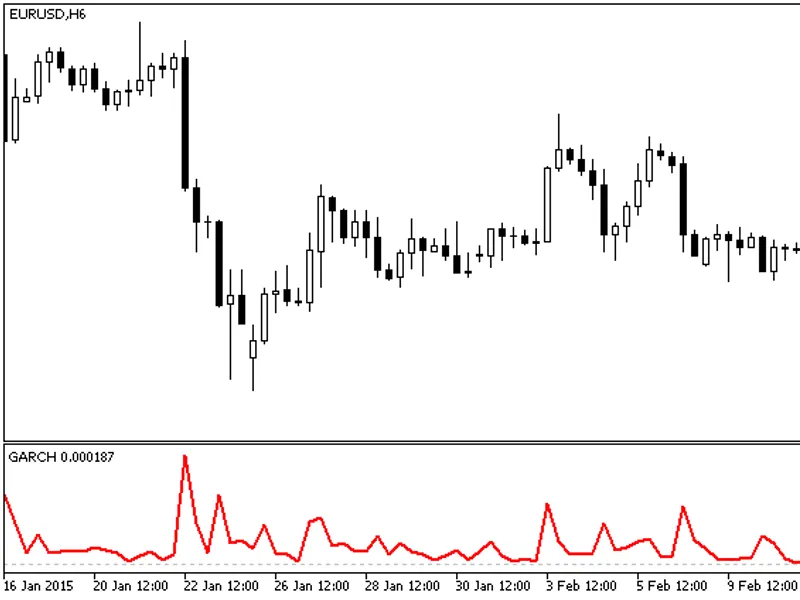
Relative Vigor Index (RVI) indicator is used in technical analysis to measure the conviction of a recent price action and the likelihood that it will continue. The RVI compares the positioning of a security's relative to its price range, and the result is smoothed by calculating an exponential moving average of the values.
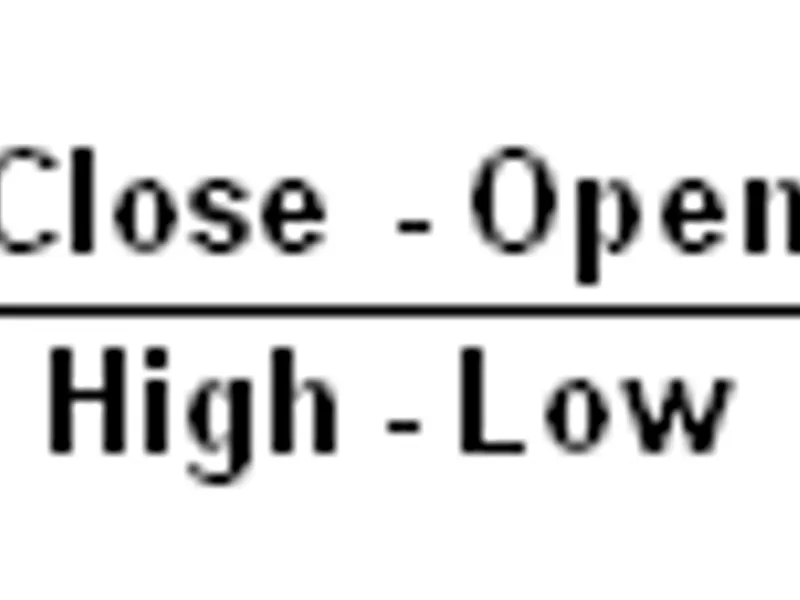
The indicator is calculated by using the following formula:
This indicator has an addition of Fisher Transform to the RVI. The Fisher Transform enables traders to create a nearly Gaussian probability density function by normalizing prices. In essence, the transformation makes peak swings relatively rare events and unambiguously identifies price reversals on a chart. The technical indicator is commonly used by traders looking for extremely timely signals rather than lagging indicators.