TT M trend
This professional-grade solution for MetaTrader 5 helps traders achieve greater efficiency in their daily workflow. This technical indicator acts as a specialized analysis tool designed to visualize market data. It helps traders identify emerging trends, momentum shifts, and key support or resistance levels by plotting statistical calculations directly onto price charts.
How to Setup and Use TT M trend
1. Installation: Place your file in the MQL/Indicators folder via "Open Data Folder" and restart your terminal.
2. Loading: Find the indicator in the Navigator, drag it onto your chart, and configure the input parameters in the popup window.
3. Customization: Press Ctrl+I to open the indicator list, select your tool, and click "Properties" to change colors, levels, or visual styles.
4. Updating: Replace the old file in the Indicators folder with the new version and restart the platform to apply changes.
Frequently Asked Questions
Q: Why is my indicator not showing? A: Verify the file is in the MQL/Indicators folder, or try right-clicking the "Indicators" tree in the Navigator and clicking "Refresh."
Q: Do custom indicators slow down the platform? A: Too many complex indicators can impact performance; remove unused ones via the "Indicator List" (Ctrl+I).
Q: Can I use MT4 indicators on MT5? A: No, MQL4 and MQL5 are distinct languages; ensure the indicator is compiled specifically for your platform version.
Description & Settings
There is already one in the code base, but this one is doing the calculation in a different way.
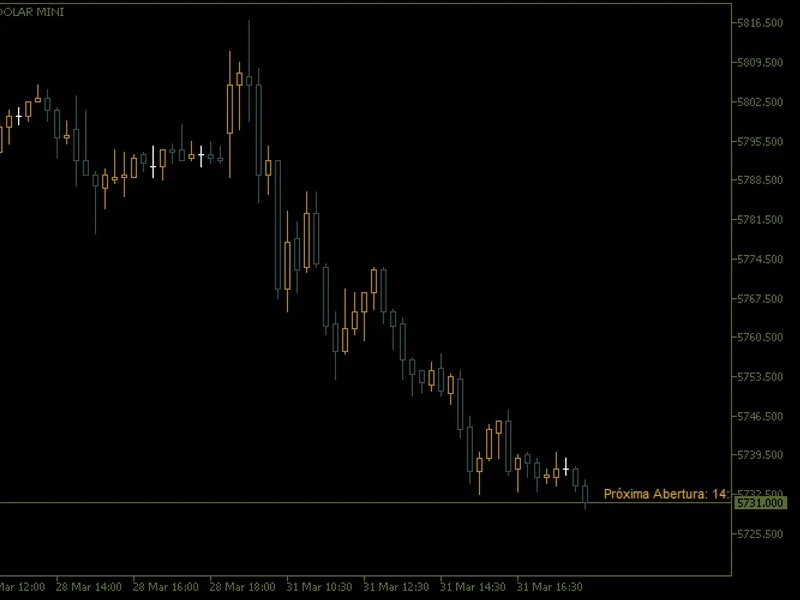
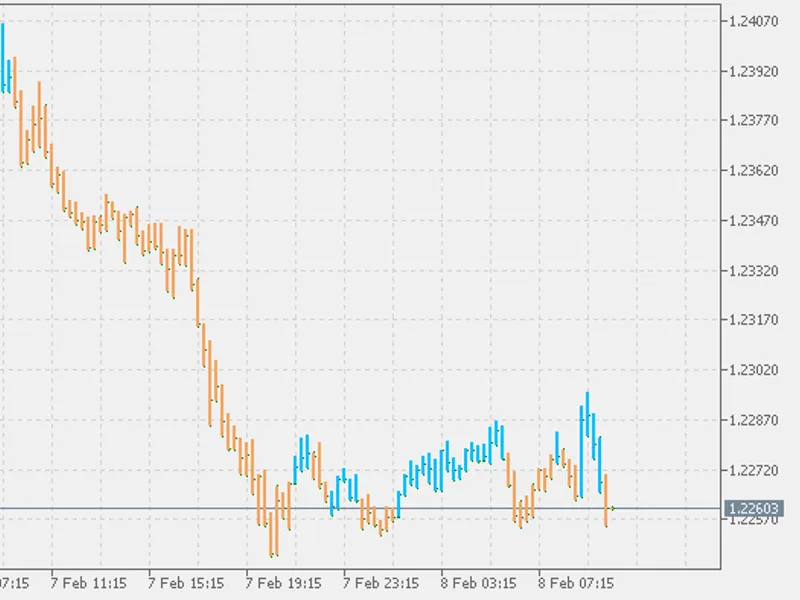
The TTM (Trade The Markets) Trend is basically an easier way to look at candlesticks. It is the The Heikin-Ashi method. Literally translated Heikin is "average" or "balance,", while Ashi means "foot" or "bar." The TTM trend is a visual technique that eliminates the irregularities from a normal candlestick chart and offers a better picture of trends and consolidations.
The TTM Trend can be modified to suit your trading personality or style. If look back bars closes above the 50% mark of the average for the past look back candlesticks, it changes color to bearish. If look back bars closes below the 50% mark of the average for the past look back candlesticks, the TTM Trend changes color to bullish. It is simple, but the TTM Trend is definitely an easier way to look at charts.