




Quantora Multi-Timeframe Trend Dashboard MT5 - Professional EMA Trend Analysis
Info
The Quantora Multi-Timeframe Trend Dashboard MT5 - Professional EMA Trend Analysis is a Indicator for MetaTrader 5 that quantora multi-timeframe trend dashboard mt5 is a professional multi-timeframe market trend analysis indicator designed for metatrader 5. The indicator simultaneously analyzes 7 different timeframes — M1, M5, M15, M30, H1, H4 and D1 — using a simple and transparent EMA-based trend model.
Usage
This tool is typically used for trend following strategies across multiple currency pairs.
Platform
This Indicator works exclusively on MetaTrader 5 (both build 600+ and newer versions).
Setup
Place the downloaded file in MQL5/Indicators folder via File ? Open Data Folder in MetaTrader 5.
How to Install and Use Quantora Multi-Timeframe Trend Dashboard MT5 - Professional EMA Trend Analysis
1. Installation: Place your file in the MQL/Indicators folder via "Open Data Folder" and restart your terminal.
2. Loading: Find the indicator in the Navigator, drag it onto your chart, and configure the input parameters in the popup window.
3. Customization: Press Ctrl+I to open the indicator list, select your tool, and click "Properties" to change colors, levels, or visual styles.
4. Updating: Replace the old file in the Indicators folder with the new version and restart the platform to apply changes.
Frequently Asked Questions
Q: Why is my indicator not showing? A: Verify the file is in the MQL/Indicators folder, or try right-clicking the "Indicators" tree in the Navigator and clicking "Refresh."
Q: Do custom indicators slow down the platform? A: Too many complex indicators can impact performance; remove unused ones via the "Indicator List" (Ctrl+I).
Q: Can I use MT4 indicators on MT5? A: No, MQL4 and MQL5 are distinct languages; ensure the indicator is compiled specifically for your platform version.
What this tool does
Quantora Multi-Timeframe Trend Dashboard MT5 is a professional multi-timeframe market trend analysis indicator designed for MetaTrader 5.
Typical Use Case
This Indicator excels in trend following on MetaTrader 5.
Compatible Platform & Setup
This Indicator works on MetaTrader 5. Place the file in the MQL5/Indicators folder and restart the terminal.
Description & Settings
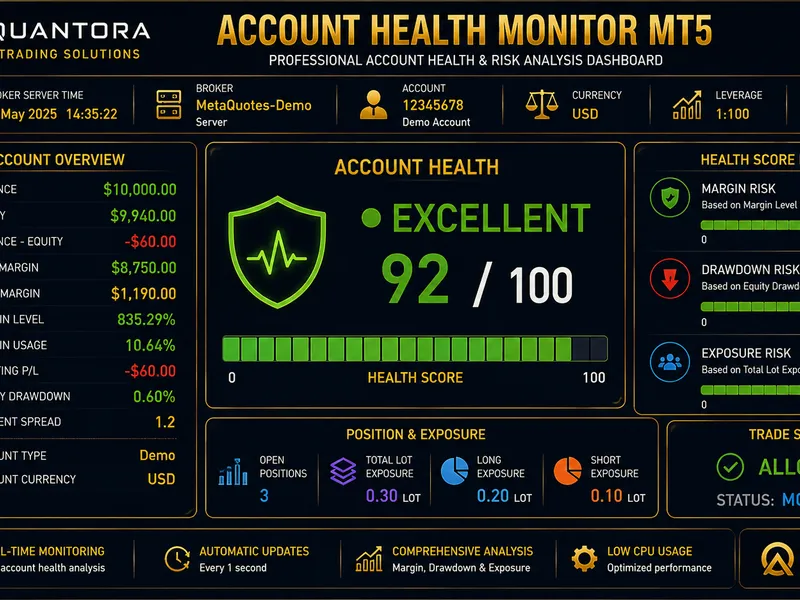
Related: Quantora Account Health Monitor MT5 - Professional Account Health and Risk Monitor - another powerful indicator for MetaTrader 5 traders.
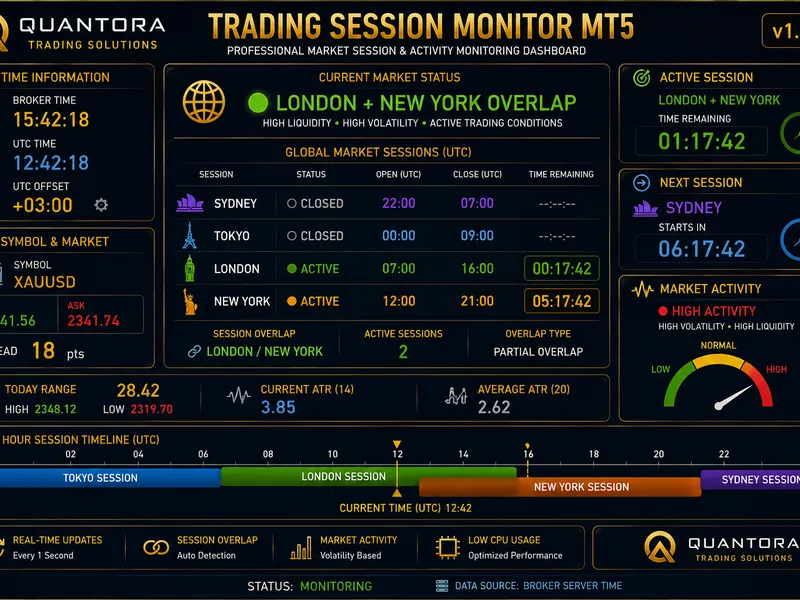
Also recommended: Quantora Trading Session Monitor MT5 - Professional Market Session and Activity Monitor - similar indicator with strong performance on MetaTrader 5.
Quantora Multi-Timeframe Trend Dashboard MT5
is a professional multi-timeframe market trend analysis indicator designed for MetaTrader 5.
The indicator simultaneously analyzes
7 different timeframes — M1, M5, M15, M30, H1, H4 and D1
— using a simple and transparent EMA-based trend model.
Each timeframe is independently classified as:
BULLISH — BEARISH — NEUTRAL
The results are combined into a
Trend Score from -7 to +7
and an Overall Market Bias ranging from
STRONG BEARISH to STRONG BULLISH
.
This allows traders to quickly understand whether different market timeframes are aligned or showing mixed conditions without manually switching between charts.
Main Features
7 Timeframe simultaneous analysis
M1 analysis
M5 analysis
M15 analysis
M30 analysis
H1 analysis
H4 analysis
D1 analysis
Fast EMA calculation
Slow EMA calculation
Default EMA 20 / EMA 50
Current price vs Fast EMA analysis
Fast EMA vs Slow EMA analysis
BULLISH classification
BEARISH classification
NEUTRAL classification
Trend Score from -7 to +7
Bullish timeframe counter
Bearish timeframe counter
Neutral timeframe counter
Overall Market Bias
STRONG BULLISH condition
BULLISH condition
MIXED condition
BEARISH condition
STRONG BEARISH condition
Live Bid
Live Ask
Current Spread
Configurable EMA periods
Automatic updates
Professional Quantora dashboard
Works with Forex, Gold, Indices, Crypto and other broker-supported symbols
Free and open-source MQ5 code
Trend Analysis Logic
Each timeframe is analyzed independently using:
Current Price
Fast EMA
Slow EMA
Default settings are:
Fast EMA = 20 Slow EMA = 50
Bullish Trend
A timeframe is classified as
BULLISH
when:
Price > EMA 20 > EMA 50
This means that the current price is above the fast EMA and the fast EMA is above the slow EMA.
The timeframe receives:
Trend Score = +1
Bearish Trend
A timeframe is classified as
BEARISH
when:
Price < EMA 20 < EMA 50
The timeframe receives:
Trend Score = -1
Neutral Trend
If neither complete bullish nor complete bearish alignment exists, the timeframe is classified as:
NEUTRAL
The timeframe receives:
Trend Score = 0
This prevents partial EMA alignment from automatically being classified as a confirmed trend.
Multi-Timeframe Analysis
The following timeframes are analyzed simultaneously:
M1 M5 M15 M30 H1 H4 D1
For example:
TIMEFRAME PRICE EMA20 EMA50 TREND M1 1.08945 1.08910 1.08872 BULLISH M5 1.08940 1.08905 1.08880 BULLISH M15 1.08920 1.08955 1.08910 NEUTRAL M30 1.08890 1.08960 1.08740 NEUTRAL H1 1.08830 1.08890 1.08980 BEARISH H4 1.08540 1.08620 1.08740 BEARISH D1 1.07890 1.07980 1.08090 BEARISH
This provides a compact overview of short-, medium- and higher-timeframe market structure.
Trend Score
Each timeframe contributes to the overall Trend Score.
BULLISH = +1 NEUTRAL = 0 BEARISH = -1
With seven timeframes, the possible score range is:
-7 to +7
Example:
Bullish Timeframes = 2 Bearish Timeframes = 3 Neutral Timeframes = 2 Trend Score = -1
The Trend Score provides a quick numerical representation of overall timeframe alignment.
Overall Market Bias
The combined Trend Score is converted into an Overall Bias.
The current version uses:
+5 to +7 STRONG BULLISH +2 to +4 BULLISH -1 to +1 MIXED -2 to -4 BEARISH -5 to -7 STRONG BEARISH
For example:
TREND SCORE: +6 OVERALL BIAS: STRONG BULLISH
Or:
TREND SCORE: -1 OVERALL BIAS: MIXED
Bull / Bear / Neutral Counters
In addition to the numerical score, the dashboard shows how many timeframes belong to each condition.
Example:
BULLISH TIMEFRAMES 4 BEARISH TIMEFRAMES 2 NEUTRAL TIMEFRAMES 1
This makes it easier to understand how the final Trend Score was formed.
Configurable EMA Periods
The default configuration is:
Fast EMA Period = 20 Slow EMA Period = 50
Both periods can be changed from the indicator inputs.
For example:
Fast EMA Period = 50 Slow EMA Period = 200
This allows users to adapt the dashboard to different trend-analysis methods.
The Slow EMA period must be greater than the Fast EMA period.
Live Market Information
The dashboard also monitors current market data for the chart symbol.
Displayed information includes:
SYMBOL EURUSD BID 1.08940 ASK 1.08955 SPREAD 1.5 points
Spread is calculated using the broker's symbol point size.
Automatic Updates
The dashboard automatically recalculates the multi-timeframe trend information.
Default:
Update Interval = 2 seconds
The interval can be changed from the indicator inputs.
This allows all seven timeframe conditions to remain updated without manually refreshing the chart.
Example Dashboard
QUANTORA MULTI-TIMEFRAME TREND DASHBOARD MT5 ──────────────────────────────────────── SYMBOL: EURUSD SPREAD: 1.5 pts OVERALL BIAS: MIXED TREND SCORE: -1 BULL: 2 BEAR: 3 NEUTRAL: 2 TIMEFRAME PRICE EMA20 EMA50 TREND M1 1.08945 1.08910 1.08872 BULLISH M5 1.08940 1.08905 1.08880 BULLISH M15 1.08920 1.08955 1.08910 NEUTRAL M30 1.08890 1.08960 1.08740 NEUTRAL H1 1.08830 1.08890 1.08980 BEARISH H4 1.08540 1.08620 1.08740 BEARISH D1 1.07890 1.07980 1.08090 BEARISH BID: 1.08940 ASK: 1.08955 STATUS: MONITORING
Why Multi-Timeframe Analysis?
A market may appear bullish on a short timeframe while remaining bearish on higher timeframes.
For example:
M1 BULLISH M5 BULLISH M15 NEUTRAL M30 NEUTRAL H1 BEARISH H4 BEARISH D1 BEARISH
Looking only at M1 or M5 could therefore provide a very different picture from the broader market structure.
Quantora Multi-Timeframe Trend Dashboard brings these conditions together in a single panel.
Installation
Place:
Quantora Multi-Timeframe Trend Dashboard MT5.mq5
inside:
MQL5 → Indicators
Compile the source file using MetaEditor.
Then attach
Quantora Multi-Timeframe Trend Dashboard MT5
to any MetaTrader 5 chart.
The indicator will automatically analyze the current chart symbol across all seven supported timeframes.
Important Notes
EMA calculations use closing prices.
The current bar is used for the displayed EMA and price values, meaning conditions may change while a candle is still forming.
A BULLISH or BEARISH classification represents only the EMA alignment defined by this indicator.
The Overall Bias and Trend Score are analytical summaries and should not be interpreted as guaranteed trading signals.
The indicator does not:
Open positions
Close positions
Modify trades
Set Stop Loss
Set Take Profit
Predict future price movements
Guarantee trend continuation
It is designed for multi-timeframe market monitoring and analytical purposes only.
Product Information
You may also like: Quantora Symbol Information Dashboard MT5 - Professional Symbol and Trading Specifications Panel - excellent alternative for indicator users on MetaTrader 5.
Source Code
#property copyright "RobotFX"
#property link "https://robotfx.org"
#property version   "1.00"
#property strict
#property indicator_chart_window
#property indicator_plots 0
#property description "This code is educational. Feel free to use, modify and upgrade as you wish. Visit ROBOTFX.ORG for professional trading tools"
input group "========== TREND SETTINGS =========="
input int InpFastEMAPeriod = 20;
input int InpSlowEMAPeriod = 50;
.......
⚠ Limitations & Risk Warning
- This tool is provided for educational and testing purposes only.
- Past performance does not guarantee future results.
- Trading involves substantial risk of loss. Use on a demo account first.
- Results may vary depending on market conditions, broker, and settings.
- We recommend thorough backtesting and forward testing before using with real funds.