Stochastic Extended
This is a powerful addition to your MetaTrader 5 toolkit designed to optimize market analysis and performance. This technical indicator acts as a specialized analysis tool designed to visualize market data. It helps traders identify emerging trends, momentum shifts, and key support or resistance levels by plotting statistical calculations directly onto price charts.
How to Setup and Use Stochastic Extended
1. Installation: Place your file in the MQL/Indicators folder via "Open Data Folder" and restart your terminal.
2. Loading: Find the indicator in the Navigator, drag it onto your chart, and configure the input parameters in the popup window.
3. Customization: Press Ctrl+I to open the indicator list, select your tool, and click "Properties" to change colors, levels, or visual styles.
4. Updating: Replace the old file in the Indicators folder with the new version and restart the platform to apply changes.
Frequently Asked Questions
Q: Why is my indicator not showing? A: Verify the file is in the MQL/Indicators folder, or try right-clicking the "Indicators" tree in the Navigator and clicking "Refresh."
Q: Do custom indicators slow down the platform? A: Too many complex indicators can impact performance; remove unused ones via the "Indicator List" (Ctrl+I).
Q: Can I use MT4 indicators on MT5? A: No, MQL4 and MQL5 are distinct languages; ensure the indicator is compiled specifically for your platform version.
Description & Settings
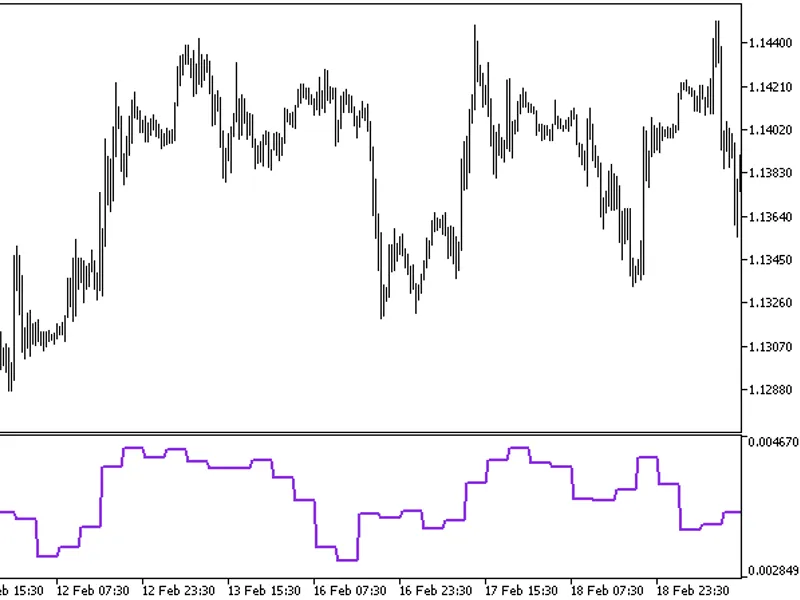
The Stochastic Oscillator is a Momentum indicator comparing the closing price of a security to the range of its prices over a certain period of time. The sensitivity of the oscillator to market movements is reducible by adjusting that time period or by taking a moving average of the result.
The Stochastic Oscillator is calculated using the following formula:
%K = 100(C - L(period))/(H(period) - L(period))
Where:
C - the most recent closing price.
L(period) - the low of the (period) previous trading sessions.
H(period) - the highest price traded during the same (period)-sessions period.
%K - the current market rate for the currency pair.
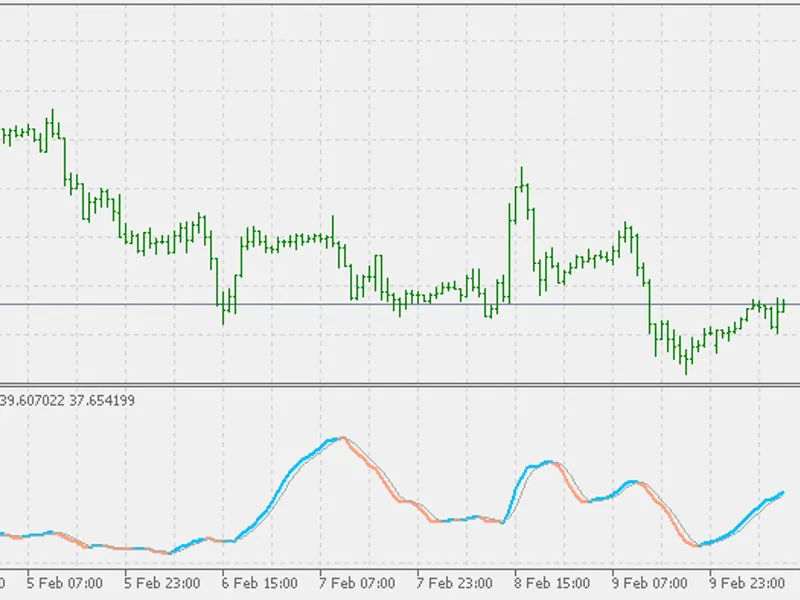
%D - (signal)-period moving average of %K.
The general theory serving as the foundation for this indicator is that in a market trending upward, prices will close near the high, and in a market trending downward, prices close near the low. Transaction signals are created when the %K crosses through a three-period moving average, which is called the %D.