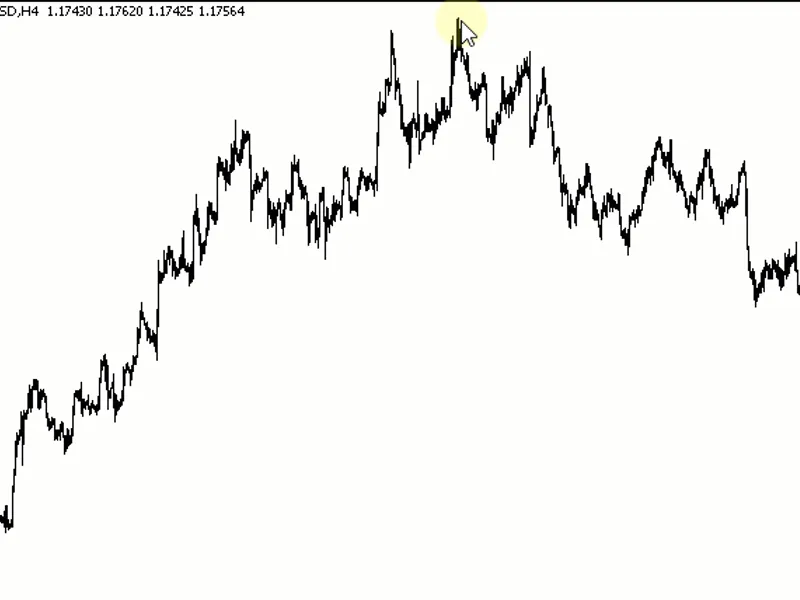
Four clicks to draw an arc-shaped channel
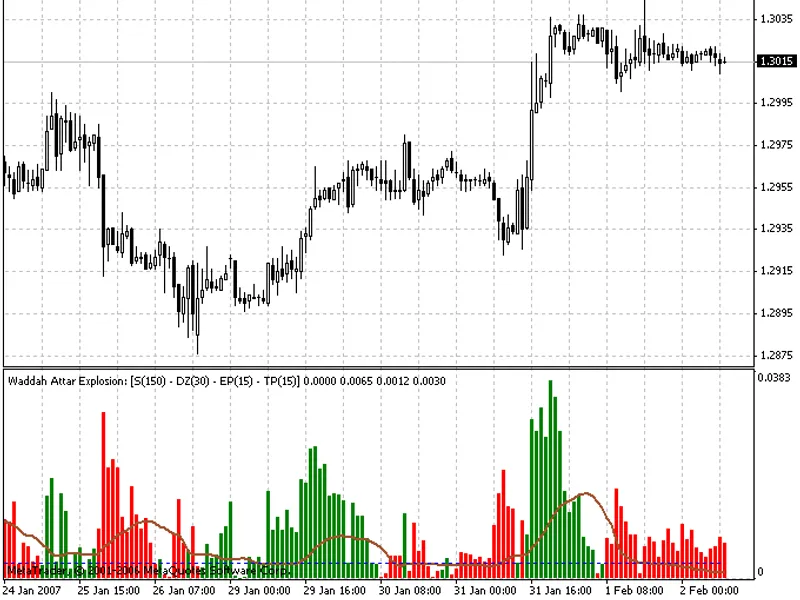
This is a powerful addition to your MetaTrader 5 toolkit designed to optimize market analysis and performance. This technical indicator acts as a specialized analysis tool designed to visualize market data. It helps traders identify emerging trends, momentum shifts, and key support or resistance levels by plotting statistical calculations directly onto price charts.
How to Setup and Use Four clicks to draw an arc-shaped channel
1. Installation: Place your file in the MQL/Indicators folder via "Open Data Folder" and restart your terminal.
2. Loading: Find the indicator in the Navigator, drag it onto your chart, and configure the input parameters in the popup window.
3. Customization: Press Ctrl+I to open the indicator list, select your tool, and click "Properties" to change colors, levels, or visual styles.
4. Updating: Replace the old file in the Indicators folder with the new version and restart the platform to apply changes.
Frequently Asked Questions
Q: Why is my indicator not showing? A: Verify the file is in the MQL/Indicators folder, or try right-clicking the "Indicators" tree in the Navigator and clicking "Refresh."
Q: Do custom indicators slow down the platform? A: Too many complex indicators can impact performance; remove unused ones via the "Indicator List" (Ctrl+I).
Q: Can I use MT4 indicators on MT5? A: No, MQL4 and MQL5 are distinct languages; ensure the indicator is compiled specifically for your platform version.
Description & Settings
This tool is what the standard MetaTrader 5 objects miss. To edit a formed line, click on it (at the edges or in the center of the line) until a dotted line appears. Then move the cursor without pressing a button.
The indicator has a simple animated button. Its size and transparency changes, when the mouse pointer is moved closer to it.
This is a cross-platform code, which can also be used in MetaTrader 4. I apologize for not adding comments.
The arc is drawn according to the following formula:
Price = a+b*n+c*n²
where a, b, c are coefficients, and n is the bar number.
In fact, it is a polynomial of degree 2. Three points are enough to calculate the a, b, c coefficients.