Relative Momentum Index
This is a powerful addition to your MetaTrader 5 toolkit designed to optimize market analysis and performance. This technical indicator acts as a specialized analysis tool designed to visualize market data. It helps traders identify emerging trends, momentum shifts, and key support or resistance levels by plotting statistical calculations directly onto price charts.
How to Setup and Use Relative Momentum Index
1. Installation: Place your file in the MQL/Indicators folder via "Open Data Folder" and restart your terminal.
2. Loading: Find the indicator in the Navigator, drag it onto your chart, and configure the input parameters in the popup window.
3. Customization: Press Ctrl+I to open the indicator list, select your tool, and click "Properties" to change colors, levels, or visual styles.
4. Updating: Replace the old file in the Indicators folder with the new version and restart the platform to apply changes.
Frequently Asked Questions
Q: Why is my indicator not showing? A: Verify the file is in the MQL/Indicators folder, or try right-clicking the "Indicators" tree in the Navigator and clicking "Refresh."
Q: Do custom indicators slow down the platform? A: Too many complex indicators can impact performance; remove unused ones via the "Indicator List" (Ctrl+I).
Q: Can I use MT4 indicators on MT5? A: No, MQL4 and MQL5 are distinct languages; ensure the indicator is compiled specifically for your platform version.
Description & Settings
The Relative Momentum Index (RMI) was developed by Roger Altman. It was first introduced in the February 1993 issue of Technical Analysis of Stocks & Commodities magazine.
The RMI is a variation of the RSI indicator. The RMI counts up and down days from the Close relative to the Close X days ago (where X is not limited to 1 as is required by the RSI) instead of counting up and down days from Close to Close as the RSI does.
Note that an RMI with parameters of C, 14, 1 is equivalent to a 14 period RSI of the Close price. This is because the Momentum parameter is calculating only a 1-day price change (which the RSI does by (default).
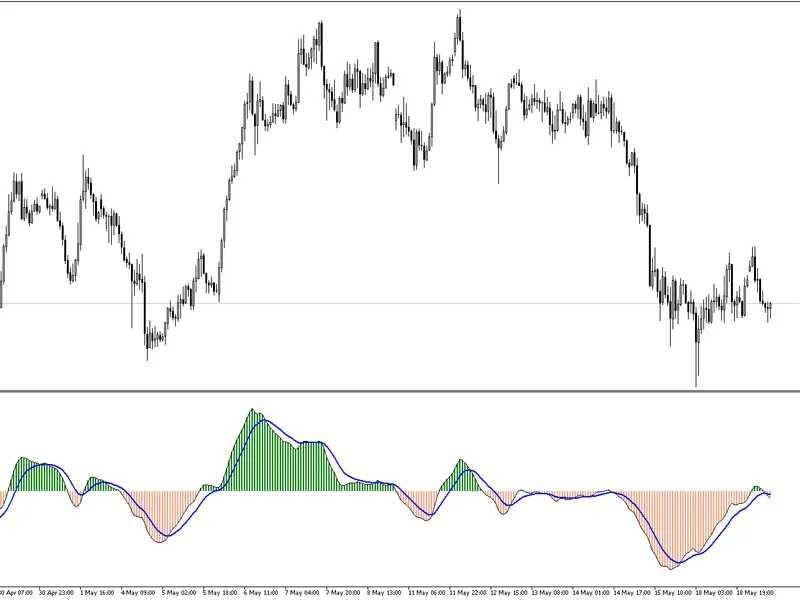
As the Momentum periods are increased the RMI fluctuations become smoother.
Since the RMI is an oscillator it exhibits the same strengths and weaknesses of other overbought / oversold indicators. During strong trending markets it is likely that the RMI will remain at overbought or oversold levels for an extended period of time.
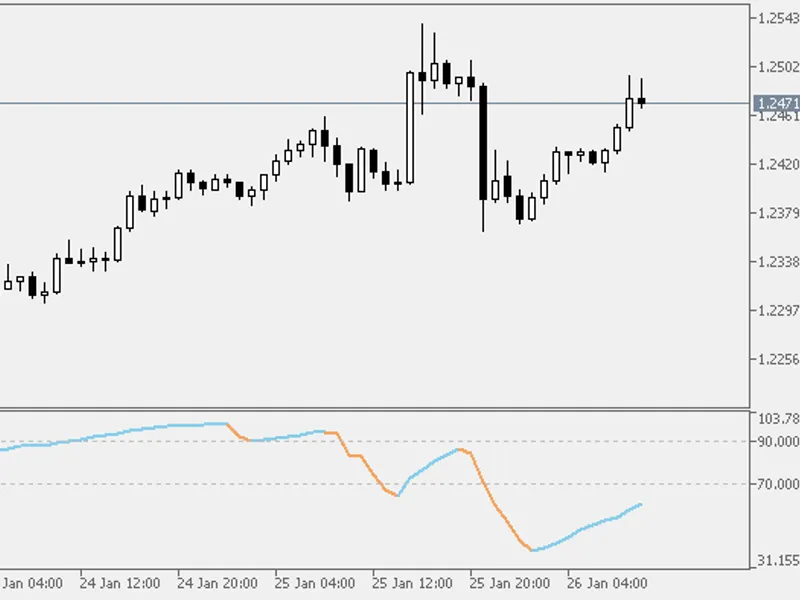
However, during non-trending markets the RMI tends to oscillate more predictably between an overbought level of 70 to 90 and an oversold level of 10 to 30.