






Relative Moving Average (RMA) Indicator for MT5
Info
The Relative Moving Average (RMA) Indicator for MT5 is a Indicator for MetaTrader 5 that overviewthis is a direct metatrader 5 port of the relative moving average (rma) framework developed by dr. Daniel Alexandre Bloch.
Usage
This tool is typically used for enhancing chart analysis and decision making.
Platform
This Indicator works exclusively on MetaTrader 5 (both build 600+ and newer versions).
Setup
Place the downloaded file in MQL5/Indicators folder via File ? Open Data Folder in MetaTrader 5.
How to Install and Use Relative Moving Average (RMA) Indicator for MT5
1. Installation: Place your file in the MQL/Indicators folder via "Open Data Folder" and restart your terminal.
2. Loading: Find the indicator in the Navigator, drag it onto your chart, and configure the input parameters in the popup window.
3. Customization: Press Ctrl+I to open the indicator list, select your tool, and click "Properties" to change colors, levels, or visual styles.
4. Updating: Replace the old file in the Indicators folder with the new version and restart the platform to apply changes.
Frequently Asked Questions
Q: Why is my indicator not showing? A: Verify the file is in the MQL/Indicators folder, or try right-clicking the "Indicators" tree in the Navigator and clicking "Refresh."
Q: Do custom indicators slow down the platform? A: Too many complex indicators can impact performance; remove unused ones via the "Indicator List" (Ctrl+I).
Q: Can I use MT4 indicators on MT5? A: No, MQL4 and MQL5 are distinct languages; ensure the indicator is compiled specifically for your platform version.
What this tool does
OverviewThis is a direct MetaTrader 5 port of the Relative Moving Average (RMA) framework developed by Dr.
Typical Use Case
This Indicator excels in automated trading and technical analysis on MetaTrader 5.
Compatible Platform & Setup
This Indicator works on MetaTrader 5. Place the file in the MQL5/Indicators folder and restart the terminal.
Description & Settings
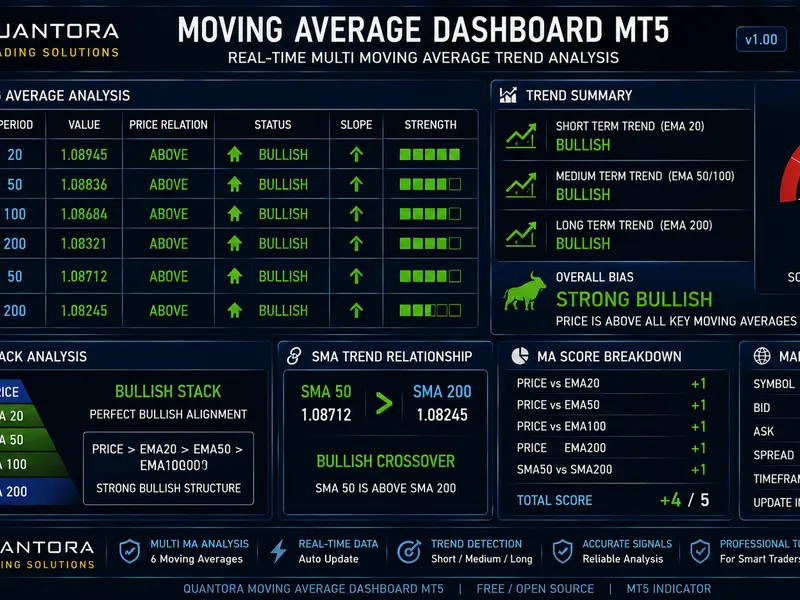
Related: Quantora Moving Average Dashboard MT5 - Professional EMA SMA Trend Analysis - another powerful indicator for MetaTrader 5 traders.
OverviewAlso recommended: multi-timeframe moving average indicator (v03) - similar indicator with strong performance on MetaTrader 5.
This is a direct MetaTrader 5 port of the Relative Moving Average (RMA) framework developed by Dr. Daniel Alexandre Bloch.
The standard moving average provides a smoothed price level but does not indicate the price's rarity within its window. The RMA addresses this by treating the price window as a distribution. It ranks the current price within this distribution and reports it on a scale of [0, 1], providing a consistent measure across different instruments and volatility regimes.
Important Note: This RMA is not the Wilder's smoothing (an EMA variant) sometimes found on other platforms. This indicator implements Bloch's construction, which measures price statistics relative to a sliding average and normalizes them onto a distribution scale.
The framework consists of three layers, mirrored in the code:
1. The SMA: The Simple Moving Average of the past W closes, serving as the local equilibrium point, fixed at zero.
2. The RMA Family: The deviation of each window price point from the SMA, expressed as a pure ratio (sma / x - 1). These ratios are scale-free and comparable across different symbols.
3. The Fractiles: Prices are re-expressed as normalized returns (close / sma - 1). The current price, minimum, and maximum within the window are ranked within this distribution. This empirical Cumulative Distribution Function (CDF) is the core series (f_w) used by the indicator.
The construction process involves calculating an SMA of closing prices, re-expressing these prices as normalized returns around the SMA, and then determining the rank (fractile) of the current price within this distribution on a [0, 1] scale.
Additionally, the indicator includes two derived readings:
- Regime Detector: Classifies the spread of normalized returns as expanding, contracting, or transitioning, using Relative Extremum Ratios, a least-squares slope, z-score, and coefficient of variation.
- Adverse Movement Monitor: Publishes d_med_w (fractile re-centered on the median) and D_k (the proportion of recent upward bar-to-bar steps), providing a directional consistency measure.
Included Programs:
- RMA_Engine: Computes all nineteen series and exposes them as buffers for Expert Advisors (EAs) or other indicators to read. This avoids the need to reimplement the calculations.
- RMA_Panel: Locates the attached RMA_Engine and mirrors a selection of its buffers into a separate sub-window with its own scale. This is useful because the RMA family and d_med_w are often not directly readable on the engine's default 0-to-1 axis.
What the Engine Draws:
The engine displays six plots in a separate window with a vertical axis from 0 to 1:
- Regime: A full-height colored band indicating the market regime (green for expansion, red for contraction, amber for rollover, blue for breakout). No color is shown during the initial undecided phase.
- f_w: A thick blue line representing the current close's fractile – its rank within the normalized return distribution of the window. This is the primary series.
- f_min / f_max: Dotted red and green lines showing the fractiles of the window's minimum and maximum prices, representing the envelope boundaries.
- alpha_lo_mean / alpha_hi_mean: Purple and orange lines representing smoothed quantile levels (EMAs of f_w and its complement), providing a slower backdrop for evaluating f_w spikes.
Three horizontal guide lines are drawn at the entry thresholds and the median. These are dynamically linked to the input parameters, ensuring they update if the thresholds are changed.
How to Read the Indicator:
- f_w near the upper guide suggests the current close is at the highest point seen in the window, potentially signaling an upcoming downward move.
- f_w near the lower guide indicates the current close is at the lowest point, potentially signaling an upcoming upward move.
- The median line shows the level that a price move needs to remain on the correct side of; crossing it can signify a natural exit point.
- The colored regime band provides context: trades are often initiated at the start of an expansion phase and closed during contraction.
Recommended Setup:
- Symbol: Any (the scale is self-normalizing). EURUSD was used for development and screenshots.
- Timeframe: M30 to H4 (works on any timeframe; window size in bars describes a shorter market duration on lower timeframes).
- Window size (W): 106 bars (default, intended as a starting point for per-asset calibration).
- History required: W + regime lookback bars (e.g., 126 bars with defaults). Plots appear as their respective modules become ready.
Key Features:
- Faithful to the Paper: Implements the paper's appendix definition for the fractile (f_i). Discrepancies between prose and appendix are documented. Regime classification adheres to the paper's Relative Extremum Ratios.
- Built for Integration: All nineteen series are exposed as indicator buffers (six plotted, thirteen calculation-only), enabling EAs to read the same data as the chart. A shared header file ensures consistent vocabulary across the engine, panels, and external consumers. Mathematics are in header-only classes, allowing use in scripts or test harnesses.
- Correct Incremental Recalculation: Each pass recalculates from prev_calculated-1 to ensure accuracy with forming bars. Warmup bars return EMPTY_VALUE. Regime classification maintains per-bar history for correct incremental updates.
- Panels with Secondary Axis: Automatically attaches requested panels, avoiding duplicates. Panels are removed with the engine. Panel attachment uses the engine's short name for reliable linking.
Screenshots:
- Engine window on EURUSD, M30: f_w with its envelope and smoothed quantile means against the regime backdrop.
- Adverse panel: d_med_w centered on zero with D_k above it, showing directional consistency.
- RMA family panel: rma_w with window min/max on their own scale, showing the envelope f_w traverses.
Installation and File Structure:
Place the files in the specified subfolders:
- Indicators/RMA/RMA_Engine.mq5 (Main indicator: runs modules, binds buffers, draws plots, opens panels)
- Indicators/RMA/RMA_Panel.mq5 (Passthrough panel: mirrors engine buffers to a sub-window)
- Include/RMA/RmaTypes.mqh (Shared definitions: enums, buffer maps, plot/palette counts)
- Include/RMA/RmaCore.mqh (Numerical core: SMA, RMA family, fractile function, etc.)
- Include/RMA/RegimeDetector.mqh (Regime classification logic)
- Include/RMA/AdverseMonitor.mqh (Directional consistency calculations)
Reading Buffers from Custom Code:
Use iCustom to get a handle to RMA_Engine and CopyBuffer to read the series by index. Indices 0-6 are plotted, 7-18 are calculation-only.
- Index 0, 1: Regime band color index
- Index 2: f_w (primary series)
- Index 3, 4: f_min, f_max (envelope fractiles)
- Index 5, 6: alpha_lo_mean, alpha_hi_mean (smoothed quantile levels)
- Index 7: sma (window's simple moving average)
- Index 8 to 12: rma_w, rma_1, rma_mid, rma_min, rma_max (RMA family)
- Index 13: range (normalized return spread)
- Index 14, 15: alpha_lo, alpha_hi (raw quantile levels)
- Index 16: regime (enumeration: 0=expansion, 1=contraction, 2=rollover, 3=breakout, 4=unknown)
- Index 17, 18: D_k, d_med_w (directional consistency, median-centered fractile)
Caution: Ensure iCustom parameters match the indicator's input declaration order exactly, including empty groups, to avoid silent failures.
Input Parameters:
- Window: InpWindowSize (106), InpSmoothingPeriod (10)
- Regime detection: InpEpsilonLow (0.15), InpEpsilonHigh (3.0), InpSlopeThreshold (0.0001), InpRegimeLookback (20), InpVariationRatioLow (0.1), InpZScoreExpansion (1.0), InpRangeHistoryLookback (100)
- Adverse movement: InpAdverseLookback (10)
- Reference lines: InpEntryUpperThreshold (0.9), InpEntryLowerThreshold (0.1)
- Panels: InpAutoAttachPanels (true), InpPanelAdverse (true), InpPanelRmaValues (false), InpAdverseThresholdDown (0.3), InpAdverseThresholdUp (0.7)
- Regime backdrop: InpShowRegimeBand (true) plus colors for each regime.
Note: Panels are automatically skipped in non-visual Strategy Tester runs.
Research Basis:
Implementation follows Daniel Alexandre Bloch's work, A Course on Systematic Trading with RMA. The paper provides the framework and mechanics; empirical results are noted as future work. This indicator offers a universally understood market state description as a foundation for your own testing.
A companion article details the mathematics, implementation, and the associated Expert Advisor: Bloch's Relative Moving Average (RMA) Framework Implementation In MQL5.
You may also like: multi-timeframe relative strength index (mtf rsi) indicator for mt4/mt5 - excellent alternative for indicator users on MetaTrader 5.
Source Code
#property copyright "RobotFX"
#property link "https://robotfx.org"
#property description "This code is educational. Feel free to use, modify and upgrade as you wish. Visit ROBOTFX.ORG for professional trading tools"
#property version     "1.00"
#property strict
#property indicator_separate_window
#property indicator_buffers 19
#property indicator_plots   6
#property indicator_minimum 0.0
#property indicator_maximum 1.0
.......
⚠ Limitations & Risk Warning
- This tool is provided for educational and testing purposes only.
- Past performance does not guarantee future results.
- Trading involves substantial risk of loss. Use on a demo account first.
- Results may vary depending on market conditions, broker, and settings.
- We recommend thorough backtesting and forward testing before using with real funds.