KD J Indicator
This is a powerful addition to your MetaTrader 5 toolkit designed to optimize market analysis and performance. This technical indicator acts as a specialized analysis tool designed to visualize market data. It helps traders identify emerging trends, momentum shifts, and key support or resistance levels by plotting statistical calculations directly onto price charts.
How to Setup and Use KD J Indicator
1. Installation: Place your file in the MQL/Indicators folder via "Open Data Folder" and restart your terminal.
2. Loading: Find the indicator in the Navigator, drag it onto your chart, and configure the input parameters in the popup window.
3. Customization: Press Ctrl+I to open the indicator list, select your tool, and click "Properties" to change colors, levels, or visual styles.
4. Updating: Replace the old file in the Indicators folder with the new version and restart the platform to apply changes.
Frequently Asked Questions
Q: Why is my indicator not showing? A: Verify the file is in the MQL/Indicators folder, or try right-clicking the "Indicators" tree in the Navigator and clicking "Refresh."
Q: Do custom indicators slow down the platform? A: Too many complex indicators can impact performance; remove unused ones via the "Indicator List" (Ctrl+I).
Q: Can I use MT4 indicators on MT5? A: No, MQL4 and MQL5 are distinct languages; ensure the indicator is compiled specifically for your platform version.
Description & Settings
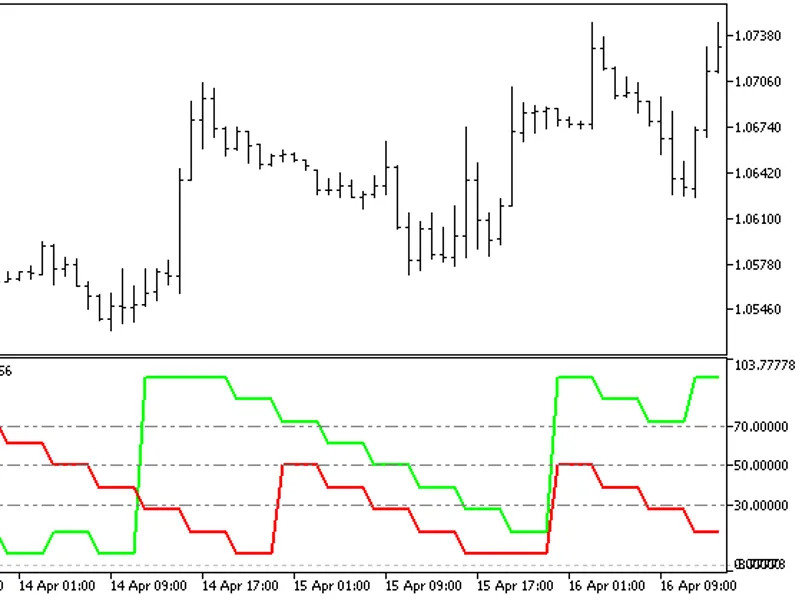
MaxHigh (the highest high) and MinLow (the lowest Low) are determined in the specified
KdjPeriod
interval. Thus, MaxHigh minus MinLow will be equal to the height of the selected
KdjPeriod
interval. Next, we determine the distance between the Close price of the current bar and MinLow as a percentage of the height of the selected
KdjPeriod
interval. It is the base RSV line.
By averaging the base RSV line with the M1 period, we obtain a smoothed K line. By averaging the smoothed K line with the M2 period, we obtain a smoothed D line. The difference between the K line and the D line gives the KDC histogram.
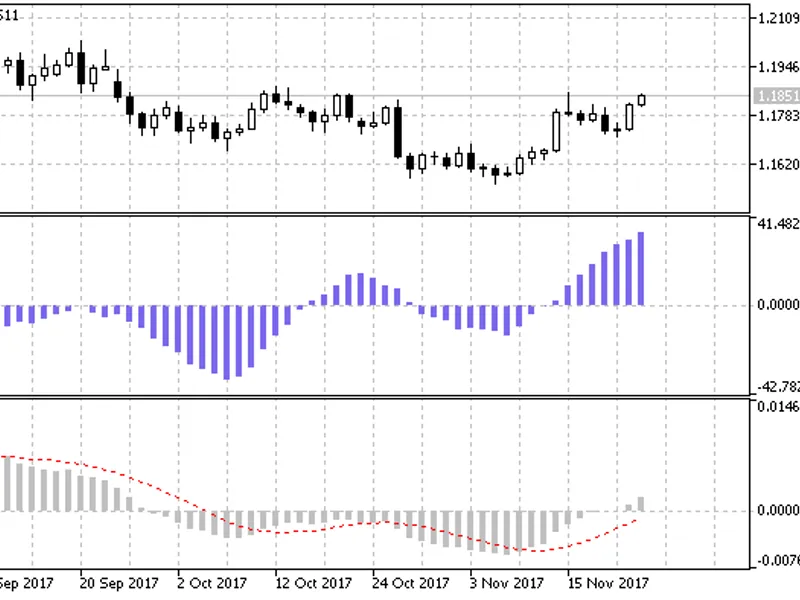
Compare KDJ Indicator and MACD: