Correlation
This is a powerful addition to your MetaTrader 5 toolkit designed to optimize market analysis and performance. This technical indicator acts as a specialized analysis tool designed to visualize market data. It helps traders identify emerging trends, momentum shifts, and key support or resistance levels by plotting statistical calculations directly onto price charts.
How to Setup and Use Correlation
1. Installation: Place your file in the MQL/Indicators folder via "Open Data Folder" and restart your terminal.
2. Loading: Find the indicator in the Navigator, drag it onto your chart, and configure the input parameters in the popup window.
3. Customization: Press Ctrl+I to open the indicator list, select your tool, and click "Properties" to change colors, levels, or visual styles.
4. Updating: Replace the old file in the Indicators folder with the new version and restart the platform to apply changes.
Frequently Asked Questions
Q: Why is my indicator not showing? A: Verify the file is in the MQL/Indicators folder, or try right-clicking the "Indicators" tree in the Navigator and clicking "Refresh."
Q: Do custom indicators slow down the platform? A: Too many complex indicators can impact performance; remove unused ones via the "Indicator List" (Ctrl+I).
Q: Can I use MT4 indicators on MT5? A: No, MQL4 and MQL5 are distinct languages; ensure the indicator is compiled specifically for your platform version.
Description & Settings
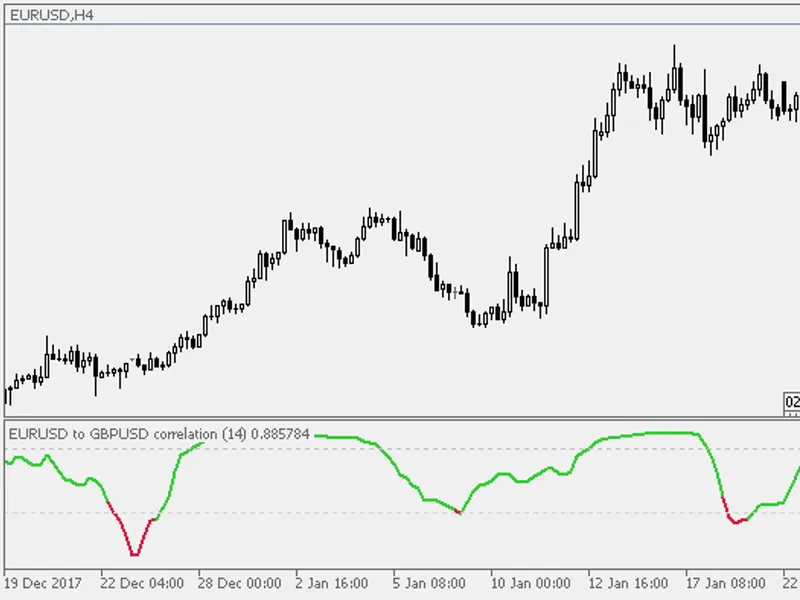
Correlation of two symbols. Values are oscillating between +1 (complete positive correlation) and -1 (complete negative correlation). Correlation value 0 is denoting absence of correlation (random changes without correlated price changes between the two observed symbols).
Usage
Use the correlation period to calculate either longer term correlation using longer period (good for observing if the symbols that are monitored are tending to trend in the same direction) or using short period (good for sudden price changes observation - usually when news are issued for one symbol and not for the other).
Enter in either or both of the symbol parameters the symbol you wish to monitor.
If the symbol parameter is left empty, current chart symbol will be used.
Set the coloring mode (two color mode is displaying different colors when zero value - no correlation level - is crossed). Recommendations
If the symbols observed tend to be either completely positively or negatively correlated, a break in the opposite direction usually can be used for entries.
In cases like the above estimate which is the symbol that is deviating from the usual trend, and enter in the direction of the other observed symbol.
All values above 0.8 or bellow -0.8 can be considered as a high level of correlation.
P.S.
Using same symbols in both symbol parameters will always produce result 1.