






interactive correlation matrix heatmap for mt5
Info
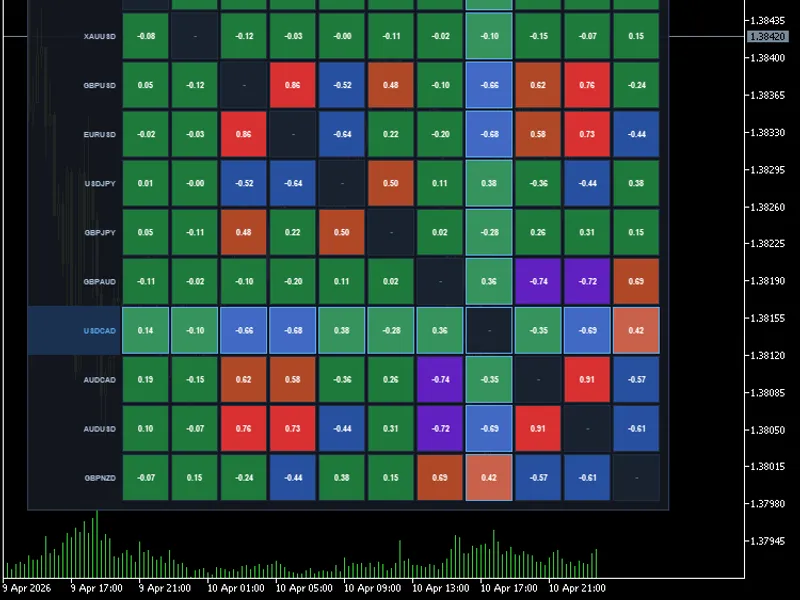
The interactive correlation matrix heatmap for mt5 is a Indicator for MetaTrader 5 that interactive correlation matrix dashboardstop guessing how your pairs move together. this professional-grade heatmap provides a clear, real-time bird's-eye view of the entire market's relationships directly on your chart.
Usage
This tool is typically used for enhancing chart analysis and decision making.
Platform
This Indicator works exclusively on MetaTrader 5 (both build 600+ and newer versions).
Setup
Place the downloaded file in MQL5/Indicators folder via File ? Open Data Folder in MetaTrader 5.
How to Install and Use interactive correlation matrix heatmap for mt5
1. Installation: Place your file in the MQL/Indicators folder via "Open Data Folder" and restart your terminal.
2. Loading: Find the indicator in the Navigator, drag it onto your chart, and configure the input parameters in the popup window.
3. Customization: Press Ctrl+I to open the indicator list, select your tool, and click "Properties" to change colors, levels, or visual styles.
4. Updating: Replace the old file in the Indicators folder with the new version and restart the platform to apply changes.
Frequently Asked Questions
Q: Why is my indicator not showing? A: Verify the file is in the MQL/Indicators folder, or try right-clicking the "Indicators" tree in the Navigator and clicking "Refresh."
Q: Do custom indicators slow down the platform? A: Too many complex indicators can impact performance; remove unused ones via the "Indicator List" (Ctrl+I).
Q: Can I use MT4 indicators on MT5? A: No, MQL4 and MQL5 are distinct languages; ensure the indicator is compiled specifically for your platform version.
What this tool does
interactive correlation matrix dashboardstop guessing how your pairs move together.
Typical Use Case
This Indicator excels in automated trading and technical analysis on MetaTrader 5.
Compatible Platform & Setup
This Indicator works on MetaTrader 5. Place the file in the MQL5/Indicators folder and restart the terminal.
Description & Settings
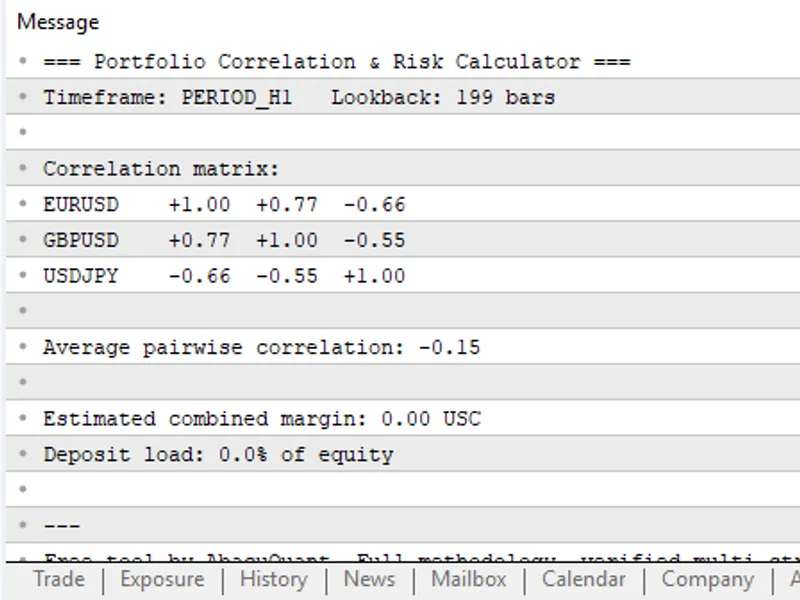
Related: Portfolio Correlation and Margin Risk Calculator - another powerful indicator for MetaTrader 5 traders.
interactive correlation matrix dashboardAlso recommended: institutional dxy overlay and correlation divergence indicator - similar indicator with strong performance on MetaTrader 5.
stop guessing how your pairs move together. this professional-grade heatmap provides a clear, real-time bird's-eye view of the entire market's relationships directly on your chart.key trading features
live heatmap visualization:
high-contrast color coding (red for positive, blue/purple for negative) allows you to spot strong relationships in milliseconds.
on-chart workspace control:
draggable:
click and move the panel so it never blocks your price action.
minimize/restore:
one-click "dash" mode to hide the grid and keep only the title bar visible when you're focusing on a trade.
instant timeframe analysis:
switch between d1, h4, h1, and m15. understand if a correlation is a long-term structural trend or just a short-term intraday move.
high-precision values:
displays exact pearson coefficients (e.g., 0.85, -0.72) so you can distinguish between "correlated" and "perfectly synced."
real-world use cases
1. risk management (avoiding over-exposure)
if you are long eurusd and long gbpusd, you might think you have two trades. the matrix will show you if they have a 0.90+ correlation, alerting you that you are actually holding a double-sized position on "usd weakness."
2. finding hedge opportunities
identify pairs with a strong negative correlation (e.g., eurusd and usdchf). if you want to stay in the market but reduce risk during high volatility, these pairs can act as natural hedges.
3. confirmation & confluence
use the matrix to see if a breakout in gold is being reflected in correlated pairs like audusd. if gold moves but aud stays flat, the matrix helps you spot the "divergence" that might save you from a fake-out.
4. cleaning up your market watch
the dashboard automatically pulls from your market watch. use it to quickly see which pairs are currently "active" and moving in sync, helping you focus only on the most tradable setups.
built for performance
pure mql5:
no external files or complex setups. just drag, drop, and trade.
ultra-lightweight:
optimized to ensure your mt5 terminal remains snappy, even when analyzing 12+ symbols at once.
broker-friendly:
automatically cleans symbol names (stripping suffixes like .m or +) so it works on any account type.
You may also like: Spearman's Rank Correlation Indicator - excellent alternative for indicator users on MetaTrader 5.
Source Code
#property copyright "robotfx"
#property version     "5.00"
#property indicator_chart_window
#property indicator_plots 0
#include <canvas\canvas.mqh>
input int  inpbars       = 50;
input int  inpmaxsymbols = 12;
input int  inppanelx     = 20;
input int  inppanely     = 40;
input int  inpcellsize   = 46;
.......
⚠ Limitations & Risk Warning
- This tool is provided for educational and testing purposes only.
- Past performance does not guarantee future results.
- Trading involves substantial risk of loss. Use on a demo account first.
- Results may vary depending on market conditions, broker, and settings.
- We recommend thorough backtesting and forward testing before using with real funds.