Vertical Horizontal Filter
This software component for MetaTrader 5 is built to enhance the capabilities of your trading environment. This technical indicator acts as a specialized analysis tool designed to visualize market data. It helps traders identify emerging trends, momentum shifts, and key support or resistance levels by plotting statistical calculations directly onto price charts.
How to Setup and Use Vertical Horizontal Filter
1. Installation: Place your file in the MQL/Indicators folder via "Open Data Folder" and restart your terminal.
2. Loading: Find the indicator in the Navigator, drag it onto your chart, and configure the input parameters in the popup window.
3. Customization: Press Ctrl+I to open the indicator list, select your tool, and click "Properties" to change colors, levels, or visual styles.
4. Updating: Replace the old file in the Indicators folder with the new version and restart the platform to apply changes.
Frequently Asked Questions
Q: Why is my indicator not showing? A: Verify the file is in the MQL/Indicators folder, or try right-clicking the "Indicators" tree in the Navigator and clicking "Refresh."
Q: Do custom indicators slow down the platform? A: Too many complex indicators can impact performance; remove unused ones via the "Indicator List" (Ctrl+I).
Q: Can I use MT4 indicators on MT5? A: No, MQL4 and MQL5 are distinct languages; ensure the indicator is compiled specifically for your platform version.
Description & Settings
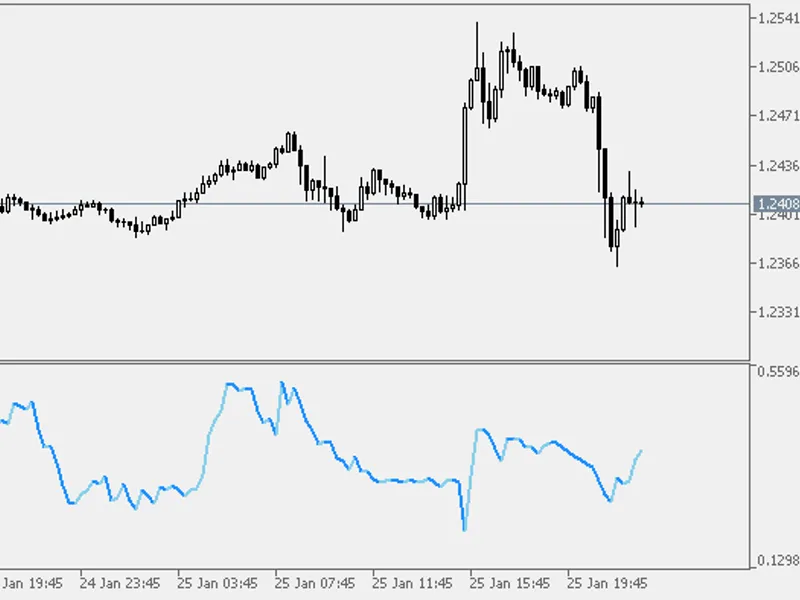
The Vertical Horizontal Filter ("VHF") determines whether prices are in a trending phase or a congestion phase. The VHF was first presented by Adam White in an article published in the August, 1991 issue of Futures Magazine.
Interpretation
Probably the biggest problem in technical analysis is determining if prices are trending or are in a trading-range. The VHF indicator attempts to determine the "trendiness" of prices to help you decide which indicators to use.
There are three major ways to interpret the VHF indicator:
You can use the VHF values themselves to determine the degree that prices are trending. The higher the VHF, the higher the degree of trending and the more you should be using trend-following indicators.
You can use the direction of the VHF to determine whether a trending or congestion phase is developing. A rising VHF indicates a developing trend; a falling VHF indicates that prices may be entering a congestion phase.
You can use the VHF as a contrarian indicator. Expect congestion periods to follow high VHF values; expect prices to trend following low VHF values. Recommendations
Accompany the VHF indicator with some "trending" in order to be able to determine if the trending indicator is indeed showing a trend or we are in a ranging phase.