Chandelier exit
This is a powerful addition to your MetaTrader 5 toolkit designed to optimize market analysis and performance. This technical indicator acts as a specialized analysis tool designed to visualize market data. It helps traders identify emerging trends, momentum shifts, and key support or resistance levels by plotting statistical calculations directly onto price charts.
How to Setup and Use Chandelier exit
1. Installation: Place your file in the MQL/Indicators folder via "Open Data Folder" and restart your terminal.
2. Loading: Find the indicator in the Navigator, drag it onto your chart, and configure the input parameters in the popup window.
3. Customization: Press Ctrl+I to open the indicator list, select your tool, and click "Properties" to change colors, levels, or visual styles.
4. Updating: Replace the old file in the Indicators folder with the new version and restart the platform to apply changes.
Frequently Asked Questions
Q: Why is my indicator not showing? A: Verify the file is in the MQL/Indicators folder, or try right-clicking the "Indicators" tree in the Navigator and clicking "Refresh."
Q: Do custom indicators slow down the platform? A: Too many complex indicators can impact performance; remove unused ones via the "Indicator List" (Ctrl+I).
Q: Can I use MT4 indicators on MT5? A: No, MQL4 and MQL5 are distinct languages; ensure the indicator is compiled specifically for your platform version.
Description & Settings
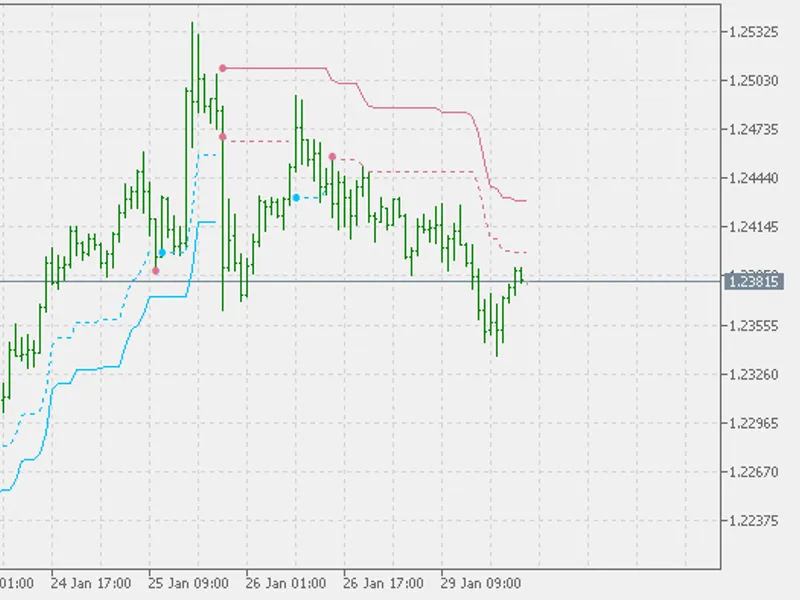
Developed by Charles Le Beau and featured in Alexander Elder's books, the Chandelier Exit sets a trailing stop-loss based on the Average True Range (ATR). The indicator is designed to keep traders in a trend and prevent an early exit as long as the trend extends. Typically, the Chandelier Exit will be above prices during a downtrend and below prices during an uptrend.
Calculation
The original Chandelier Exit formula consists of three parts: a period high or period low, the Average True Range (ATR) and a multiplier. Using the default setting of 22-periods on a daily chart, the Chandelier Exit will look for the highest high or lowest low of the last 22 days. Note that there are 22 trading days in a month. This parameter (22) will also be used to calculate the Average True Range.
Interpretation
The Chandelier Exit is basically a volatility-based system that identifies out-sized price movements. Le Beau defined volatility by using the Average True Range, which was developed by Welles Wilder, creator of RSI and the Average Directional Index. ATR uses the prior close, current high and current low to determine the True Range for a given period. After some smoothing, the daily True Range values evolve into the Average True Range for a given period of time.