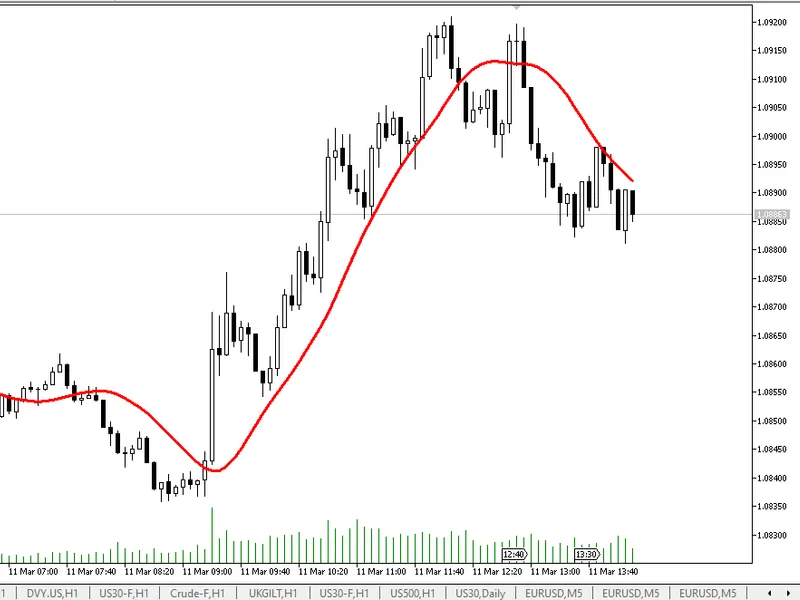
the t3 indicator is an advanced moving average developed by tim tillson that reduces lag while maintaining a smooth curve that filters market noise. unlike traditional moving avera...
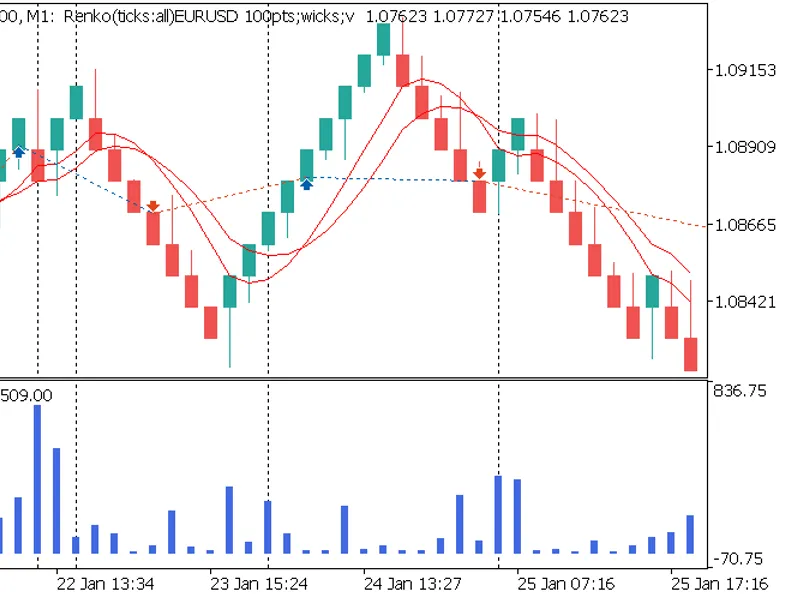
this indicator displays a subwindow with histogram of custom bars' durations in minutes. it's applicable for renko boxes, pnf, equivolume bars, and other custom charts, where bar d...
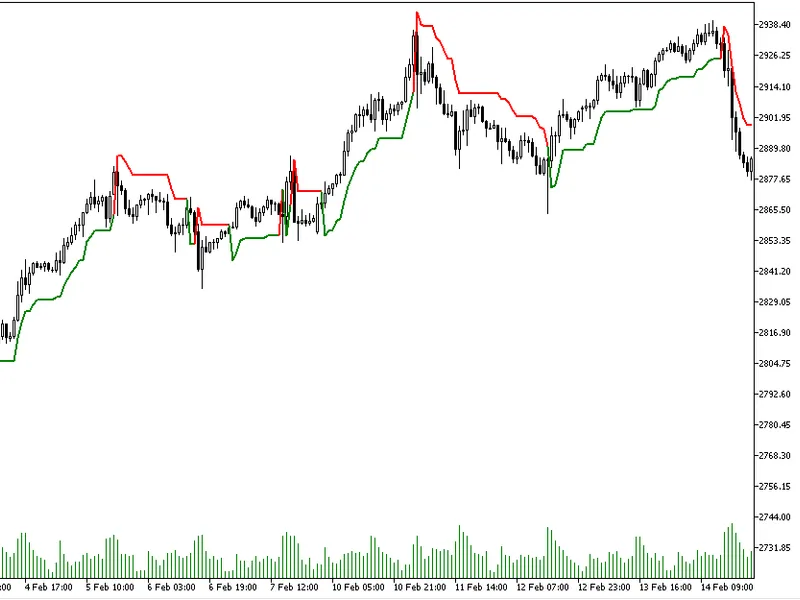
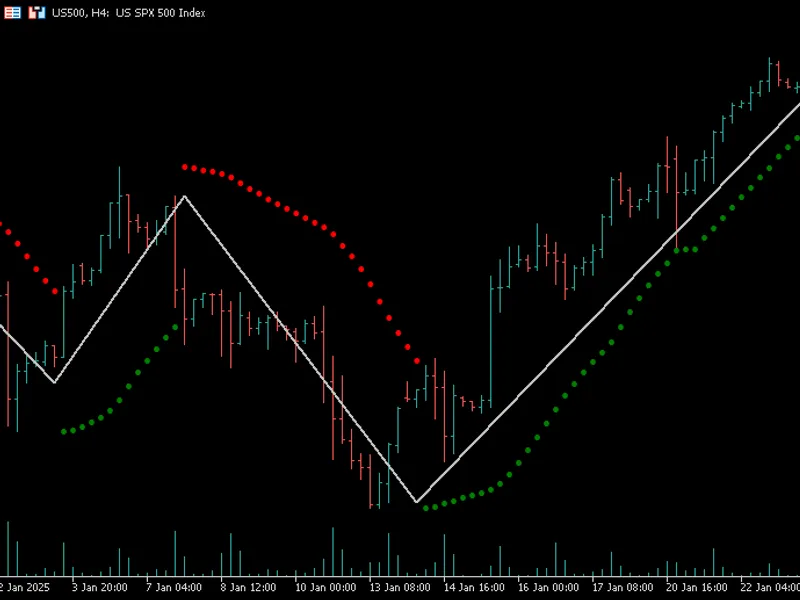
this supertrend indicator helps identify market trends based on average true range (atr) volatility. released under mit license for free and open-source use.core formula upper ban...
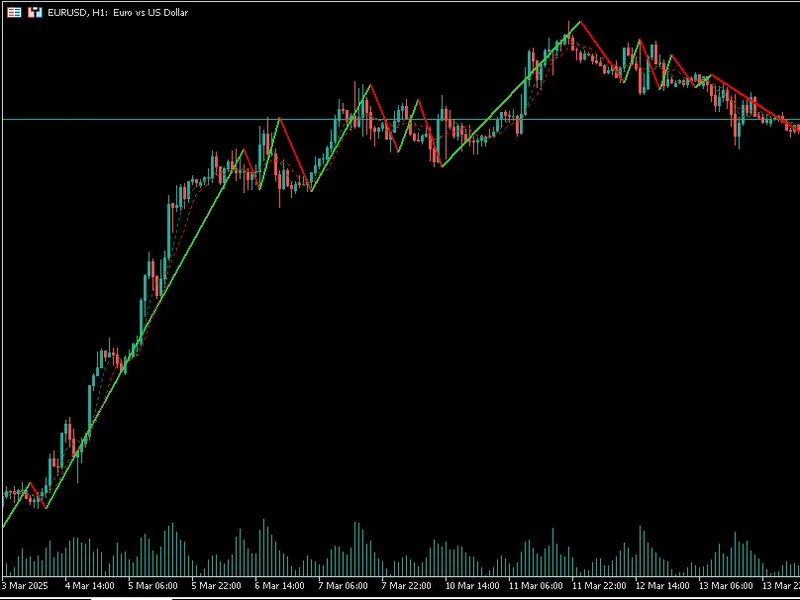
this is a static zigzag which connects the intersections of two moving average crossovers. it is another way to analyse moving averages.when the fast period moving average crosses ...
the green line represents the total amount of fvgs in uptrend (filled or unfilled) in the specified window_size. the red line represents the total amount of fvgs in downtrend (fil...
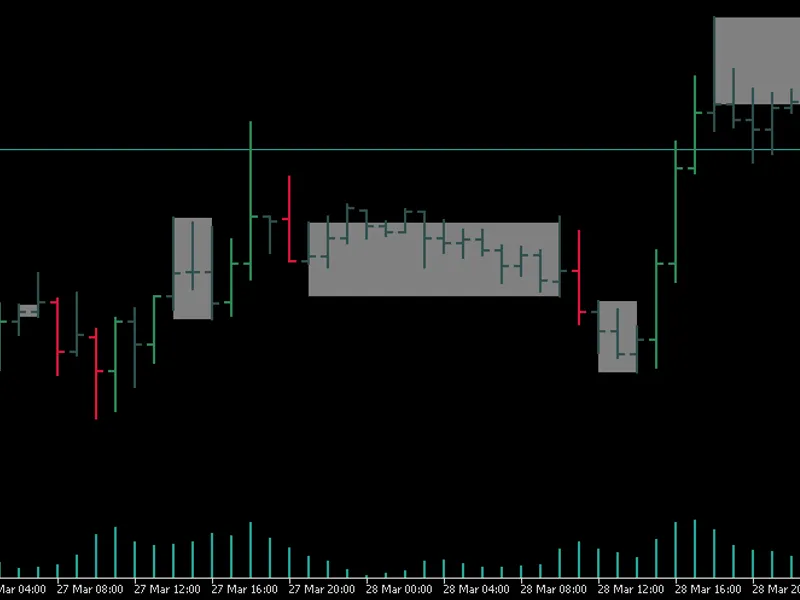
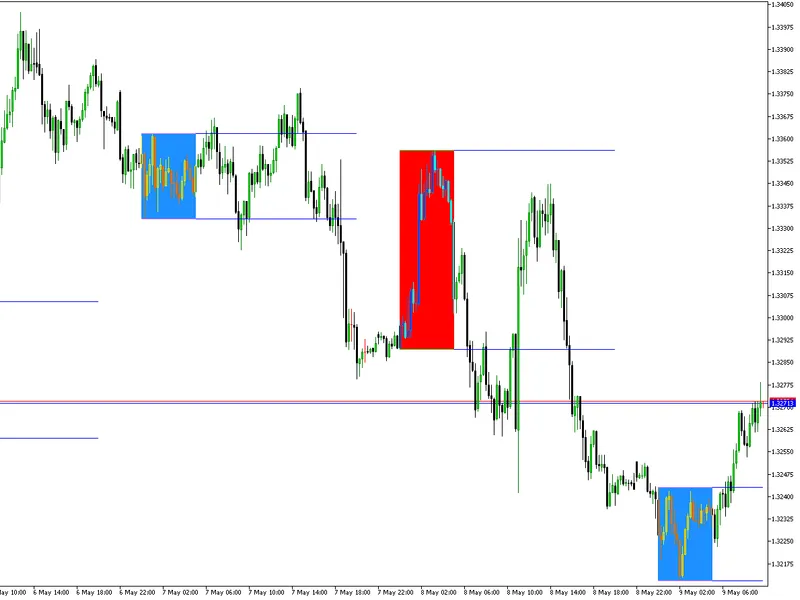
this is an effort to build an indicator that highlights a ranging market period with a standard object that uses a dynamic anchor point. the detection is non lagging, and has two m...
this indicator differs from the traditional zigzag you're already familiar with. the traditional zigzag serves a different purpose: it primarily highlights previous market swings a...
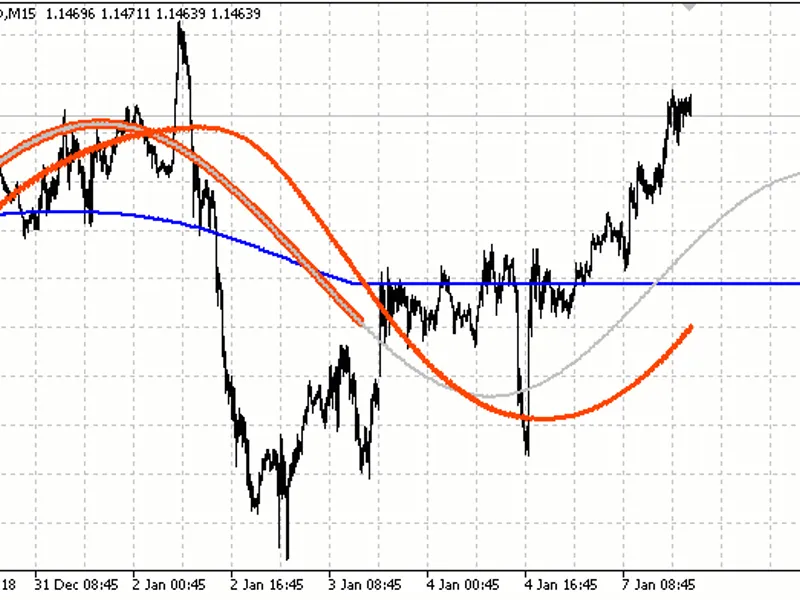
the indicator creates a sliding line based on interpolation by a 4 degree polynomial. the constructed line extrapolates with a sine wave and itsline_poweraxialor nearly constant,or...
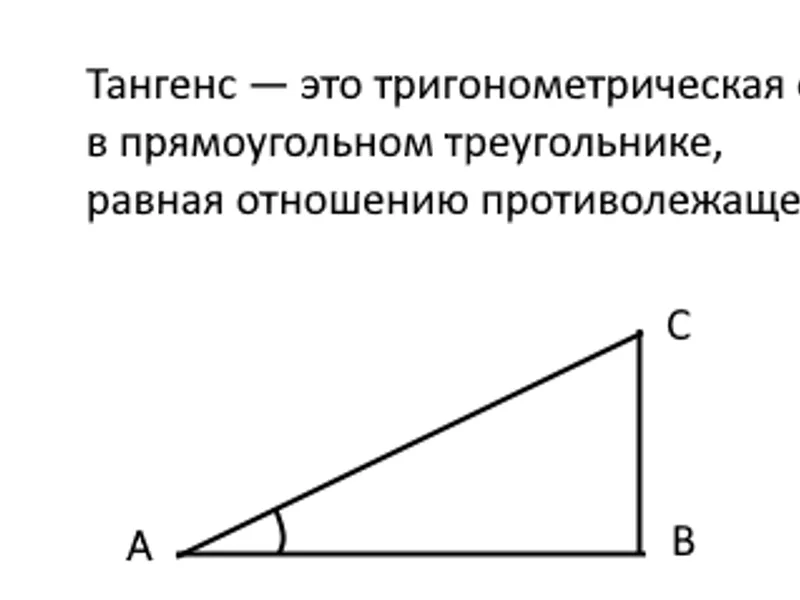
inspired by thethe indicator calculates the angle between the trend line and the horizontal. on the x axis - minute bars are taken, regardless of the timeframe, on the y axis - poi...
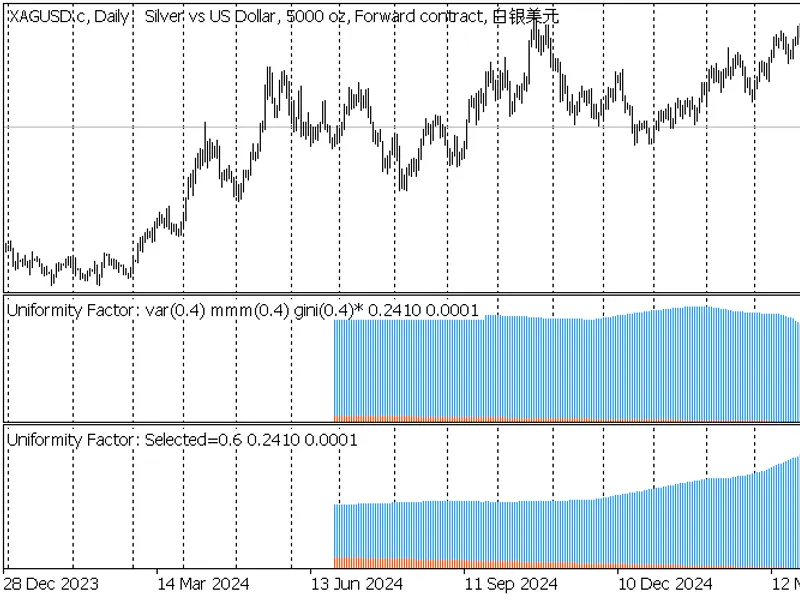
this is a simple analytical (non-signal, one-time calculated) indicator that allows you to test the hypothesis that price timeseries represent a "random walk", specifically gaussia...
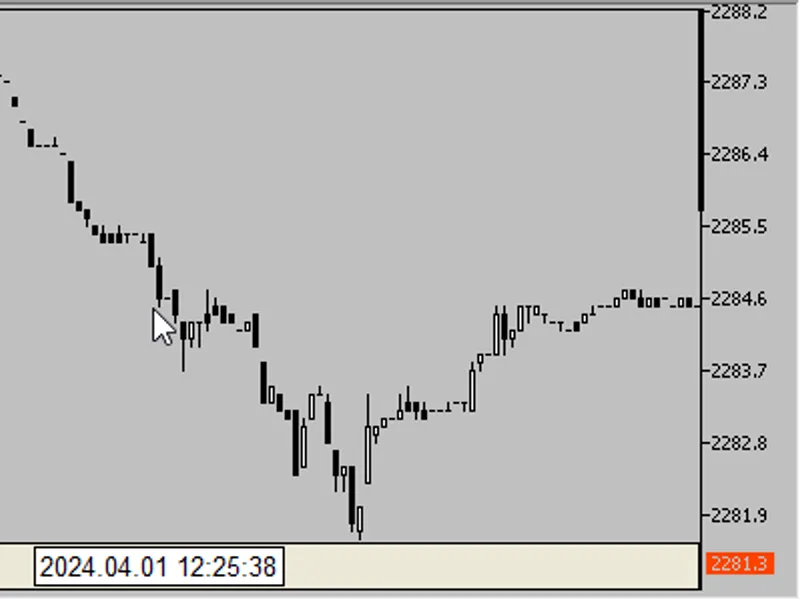
the indicator draws an arbitrary seconds timeframe on the chart.in the settings:number of days-if you set too many days, it may take a long time to calculate.timeframe in seconds.c...
this multi-symbol indicator shows the price changes of symbols from the market watch between two dates defined by vertical lines.this provides a convenient opportunity to evaluate ...
chande kroll stop indicator is an indicator for determining the level of stop loss setting. it represents two lines on the price chart. the red line represents the stop level for a...
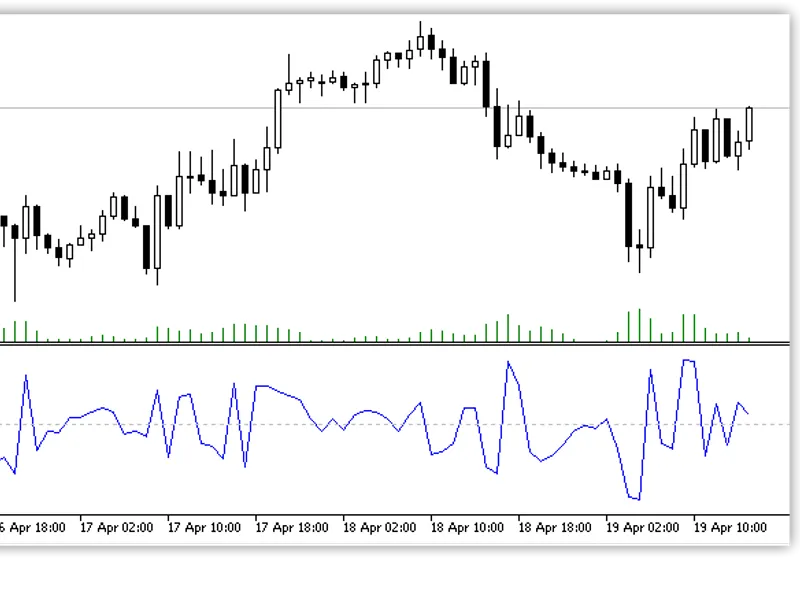
indicator name : kuskus starlightdescription : kuskus starlight is a technical indicator that functions as an oscillator, utilizing a fisher price transformation to assist traders ...
what exactly is it for? visual reference of your eas' performance: manually enter your strategy's known or expected historical maximum drawdown (e.g., from backtesting or previous...
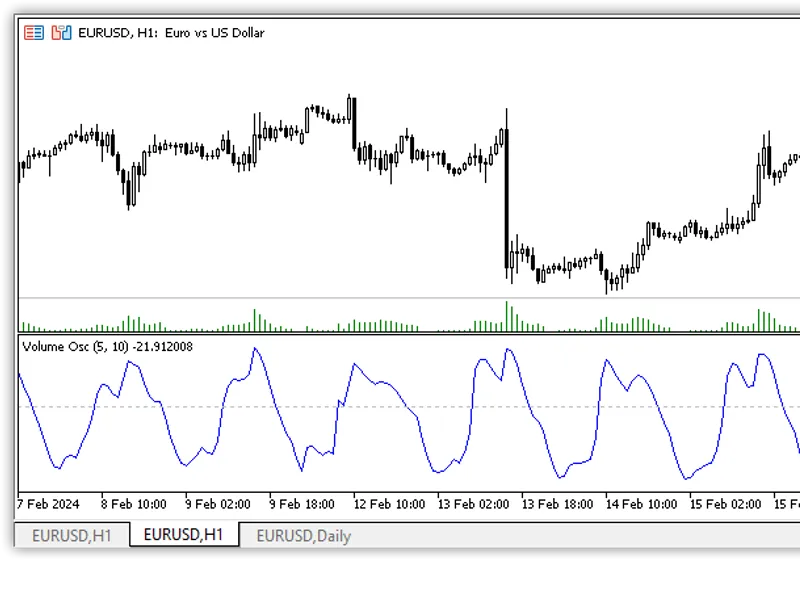
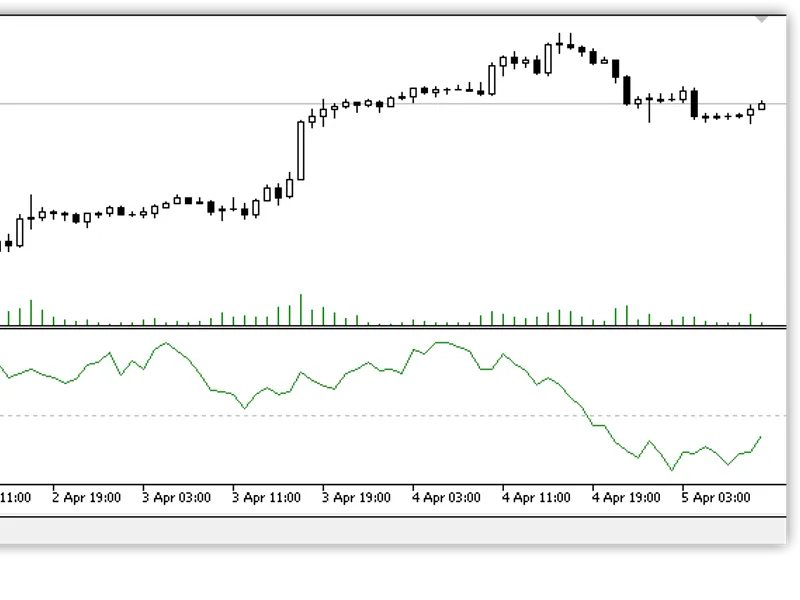
volume oscillator is the ratio of two moving averages calculated on volume.calculation:a rise or fall in price along with an increase in volume can potentially signal the strength ...
chaikin's cash flow (cmf) is a technical analysis indicator used to measure the volume of cash flow over a given period of time. cash flow volume (a concept also created by mark ch...
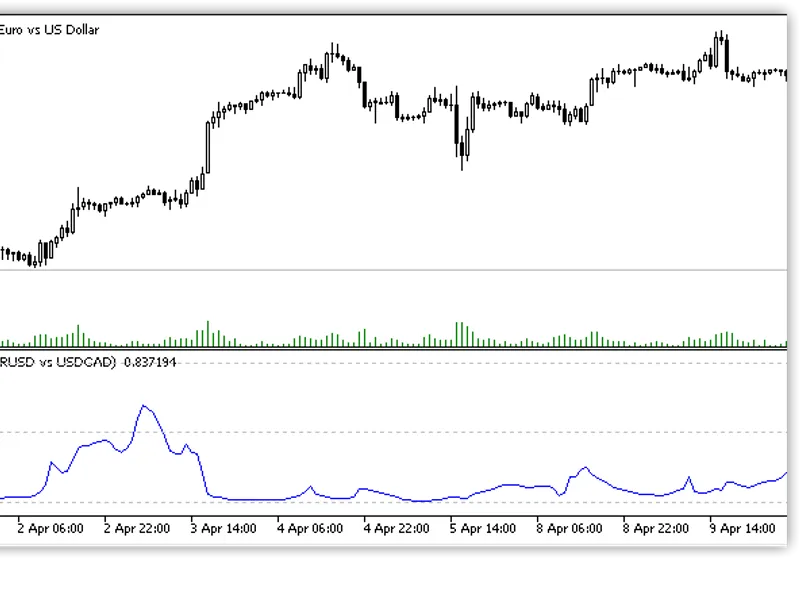
the correlation coefficient (cc) is used in statistics to measure the correlation between two sets of data. in the world of trading, data sets can be any financial instrument. simp...
the know sure thing (kst) indicator is an oscillator based on momentum represented by the rate of change (roc). it is four different-period rocs smoothed with simple moving average...
net volume indicator:net volume can be used to show where buyers and sellers are putting the most money at any given point in time. positive net volume can show that growth and buy...
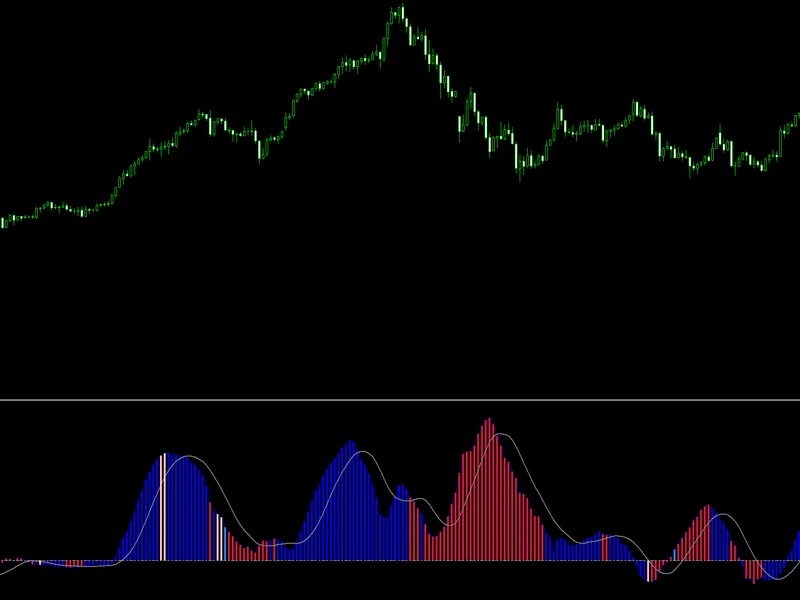
the smi ergodic oscillator indicator displays the difference between the and its exponentially smoothed signal line.it has three adjustable parameters:long length- primary smoothin...
volatility stopis a technical indicator used to place effective stop losses. it allows to achieve a balance between making profit from deals and controlling risks in the market. th...
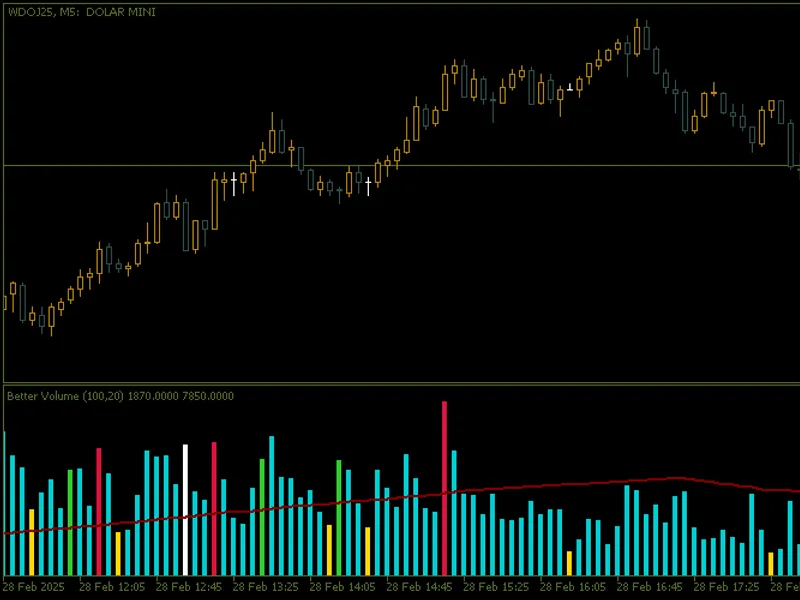
main features dynamic volume categorisation :the indicator classifies volume into various categories, assigning different colours to facilitate visual interpretation: buying climax...
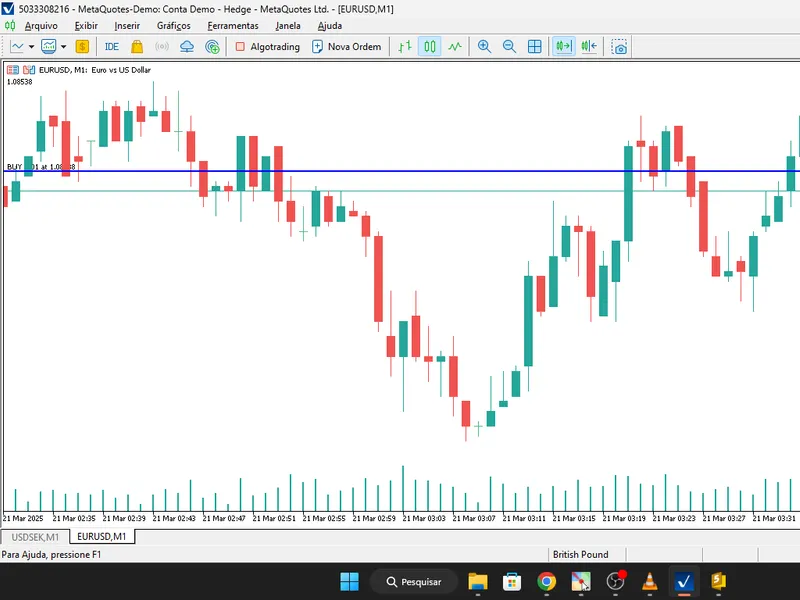
mql5 indicator for calculating the average price of a hedge accountintroduction this code was generated by chatgpt, but i made some adjustments and posted the video on youtube:in t...
spread is realised through the difference of quotes of two symbols. if symbols quotes move in reverse - the second symbol is put in reverse. in this case the spread is calculated t...
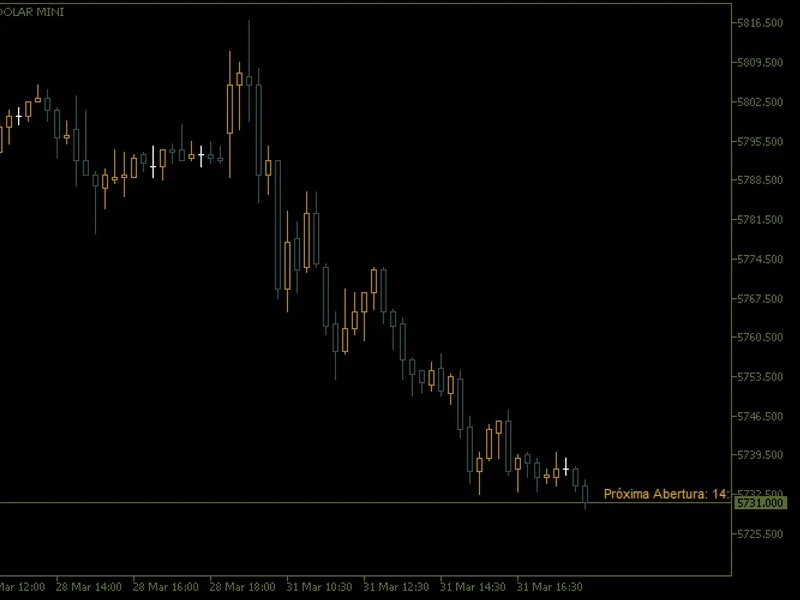
key features1 - flexible display modes:- commentary: displays the countdown directly in the top left corner of the chart. - chart edges: positions the stopwatch in any corner of th...
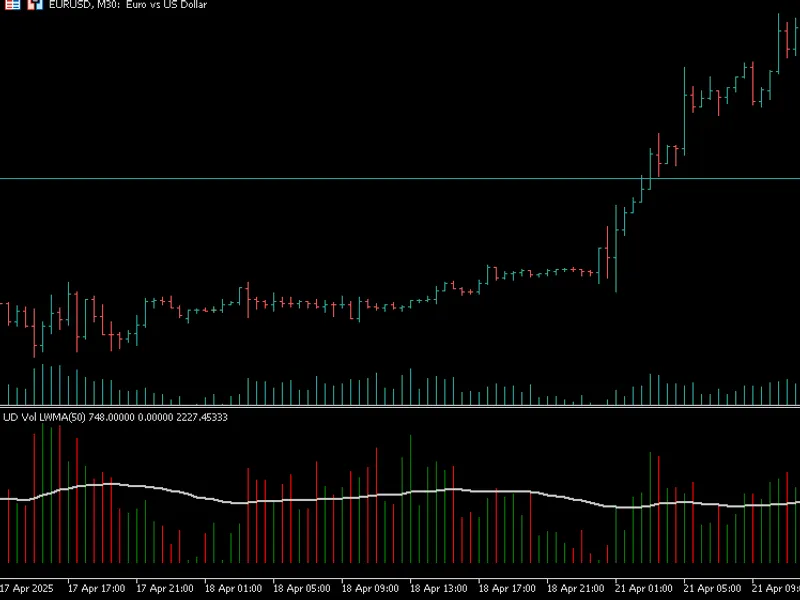
it's a classic indicator which plots a moving average on volume (tick volume) instead of price. the histogram bars that describe the volume are coloured based on the price bars.tic...
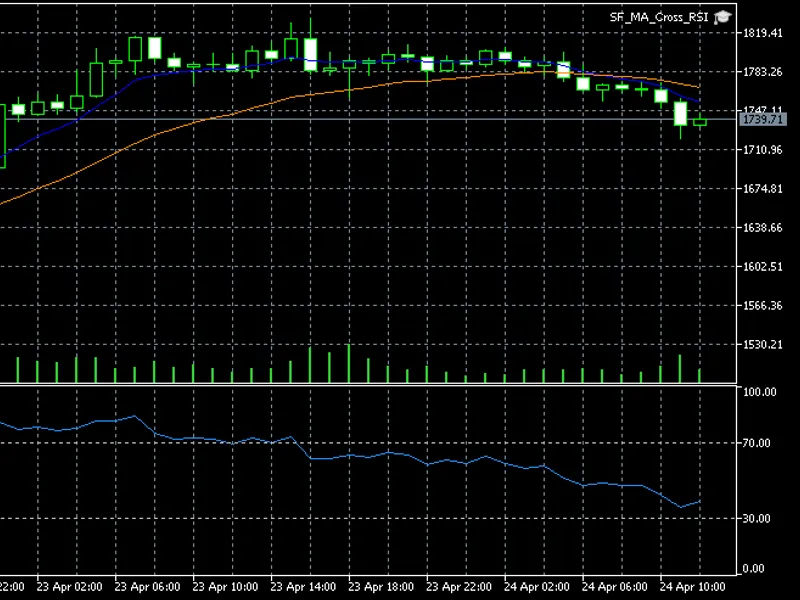
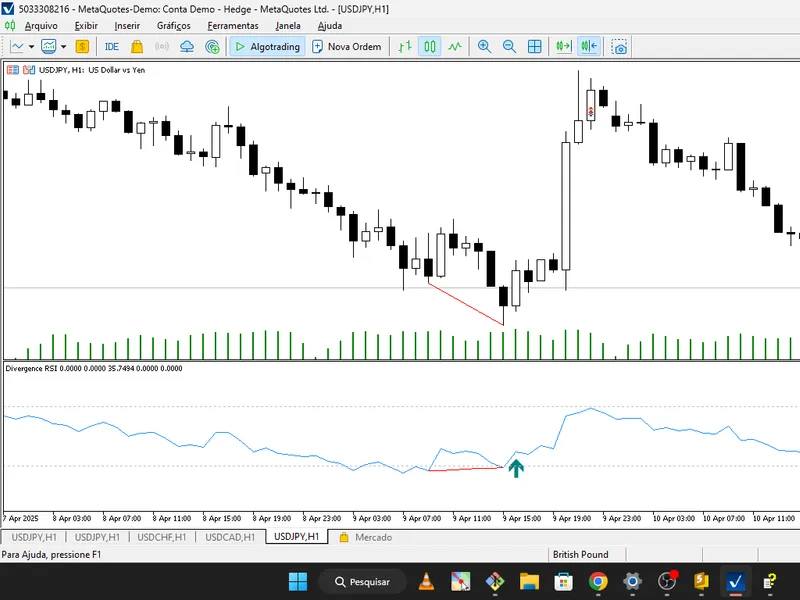
the custom ma cross with rsi indicator for mt5 is a versatile trading tool designed to help traders identify trend changes and filter entries using momentum. this indicator combine...
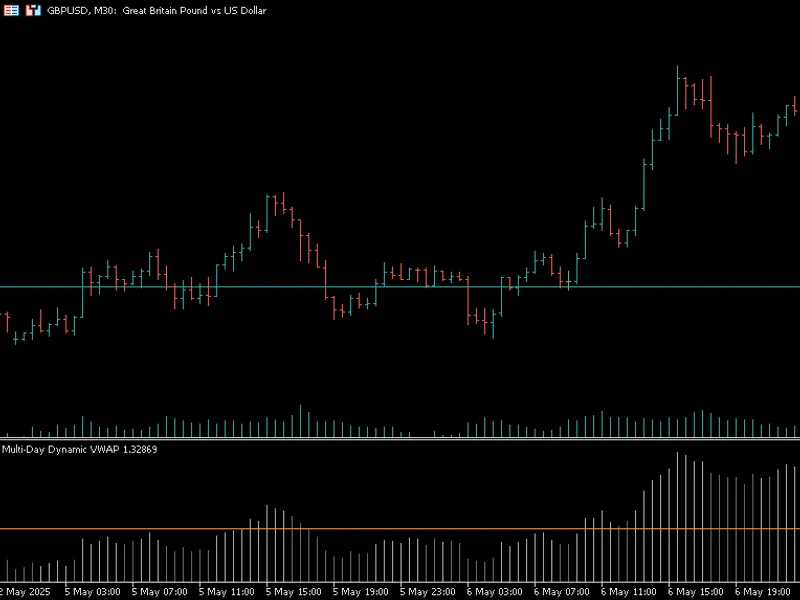
vwap represents the average price weighted by volumeover a selected time period. unlike simple averages, it tells you where the majority of volume has traded, and this is a crucial...
input:range start time : the starting time of the range creation range end time : the ending time of range creation trade end time : the time where the line of range zone high/low ...
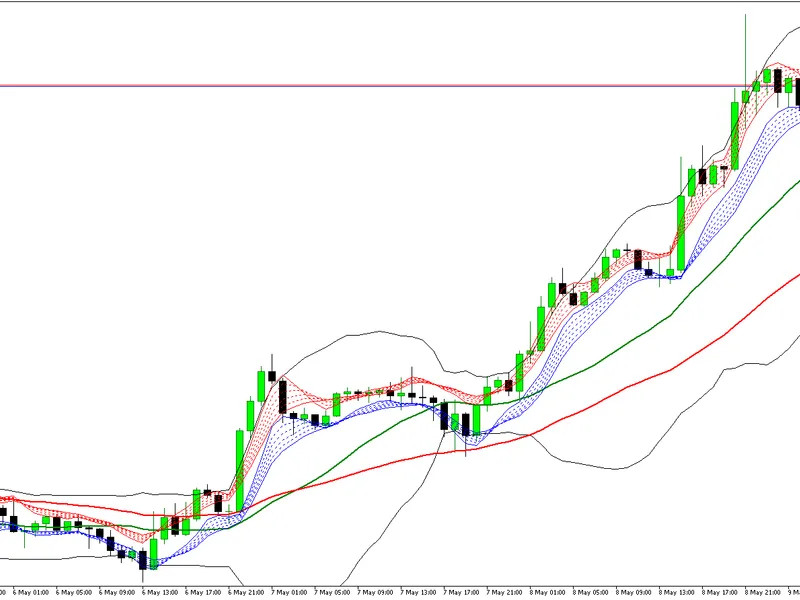
the bbma (bollinger bands moving average) trading strategy was developed by oma ally, a renowned malaysian trader. the strategy combines bollinger bands and moving averages to iden...
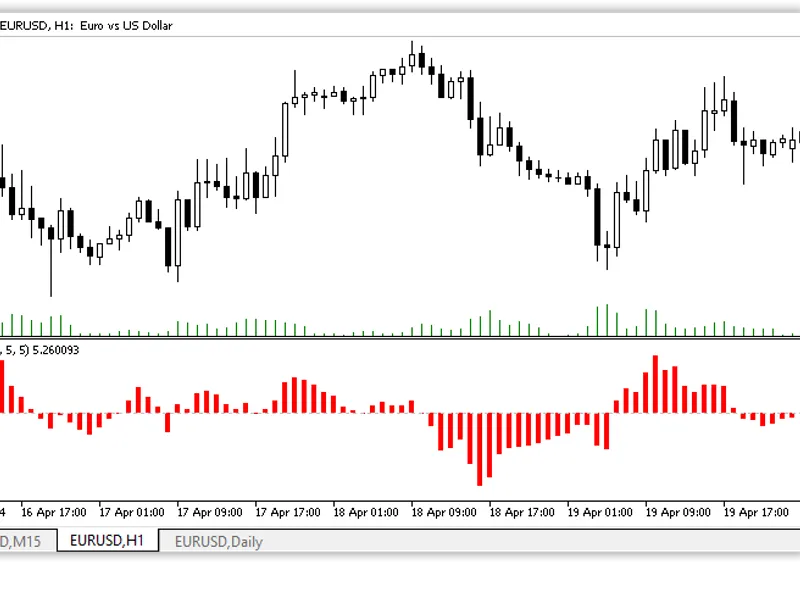
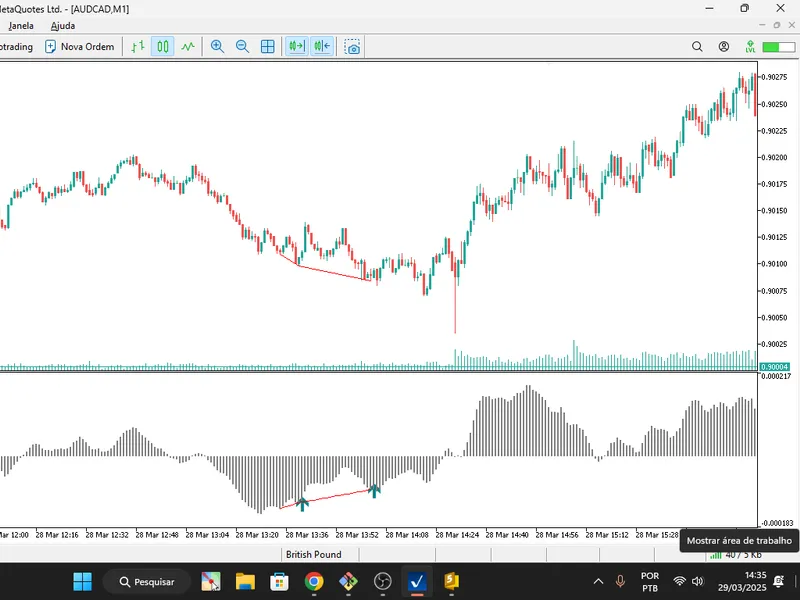
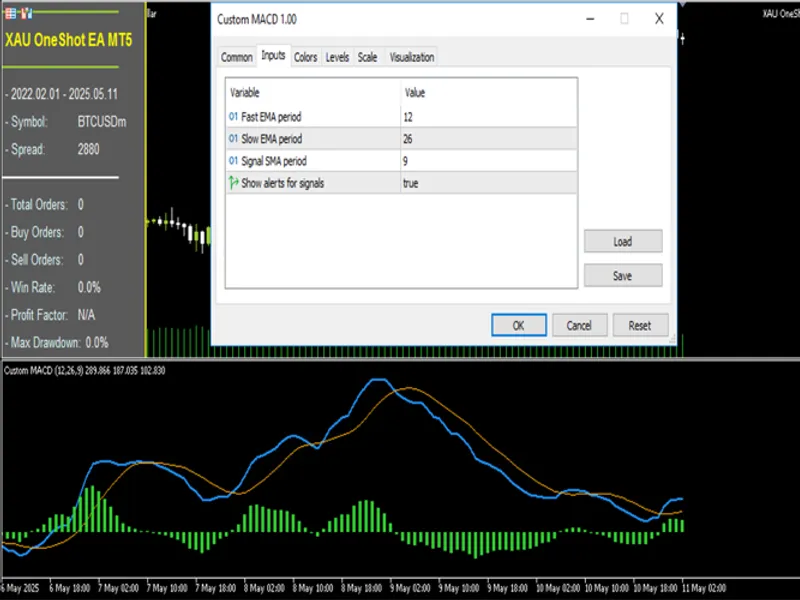
introduction how custom macd works custom macd operates based on the standard macd formula:macd line: the difference between the fast ema (default: 12) and slow ema (default: 26). ...
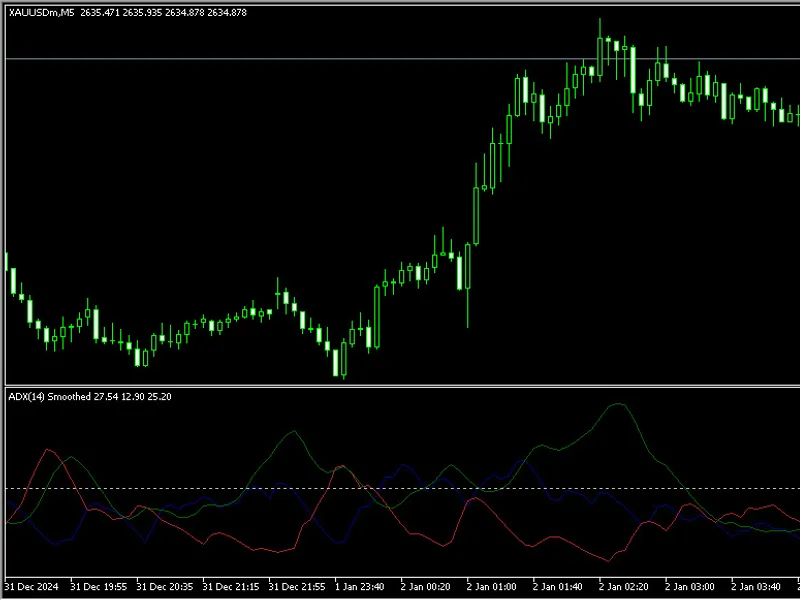
this adx smoothed indicator offers significant improvements over traditional implementations. key enhancements include:robust error prevention with comprehensive bounds checking to...
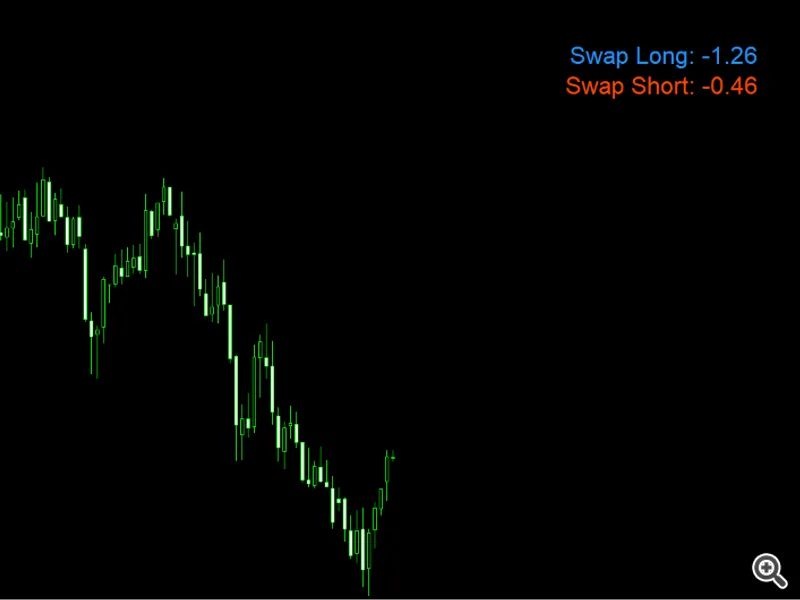
a simple utility for monitoring long and short swaps of a single symbol. if your broker-dealer's swaps are specified in points instead of account currency, this utility automatical...
features and functionality the indicator plots two lines on the chart: one for the high price and one for the low price, calculated based on user-defined inputs. its key features i...
what exactly is it for? visual reference of the performance of your eas: enter manually the known or expected historical maximum drawdown of your strategy (for example, the one ob...
main featurescandle filtering: the indicator allows you to display only those candles that meet a certain criterion:bullish: displays only bullish candles. bearish: displays only b...
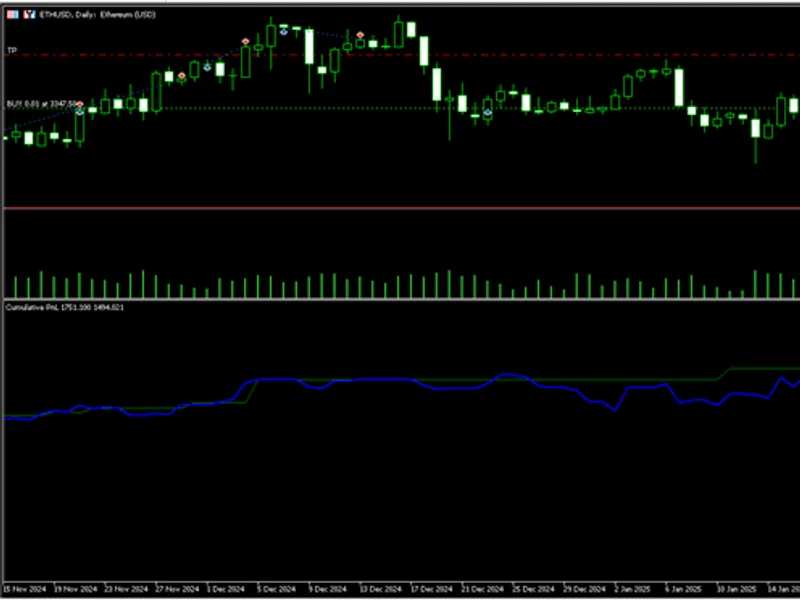
cumulative p&l indicatoroverviewthe cumulative p&l indicator displays your account's balance and equity evolution over time as two separate lines on a chart. it provides a ...
this indicator is as an evolution of the classic donchian channel.pivots are identified using a zigzag structure and graphical markers, with the pivots derived entirely from the be...
description:this indicator identifies bullish and bearish engulfing candlestick patternson the chart and optionally confirms them with volume. when the volume of the current candle...
this is a custom indicator for metatrader 5 whose sole purpose is to display a bmp image on the chart, centred on the screen. what is it for? it is used to display a static image (...
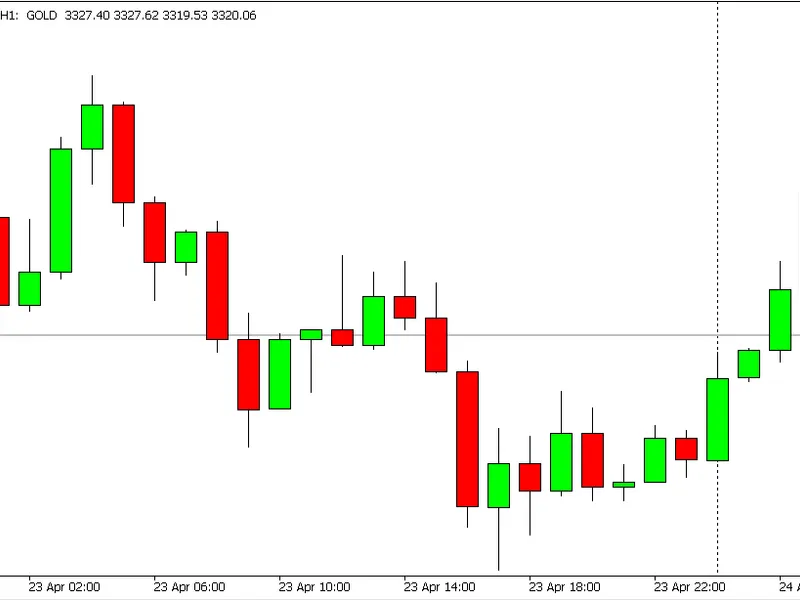
draw the wicks (thin lines): draw a vertical line from the lowest price to the highest price of each candle (this is called a "wick"). draw the body of the candle: draw a rectangle...