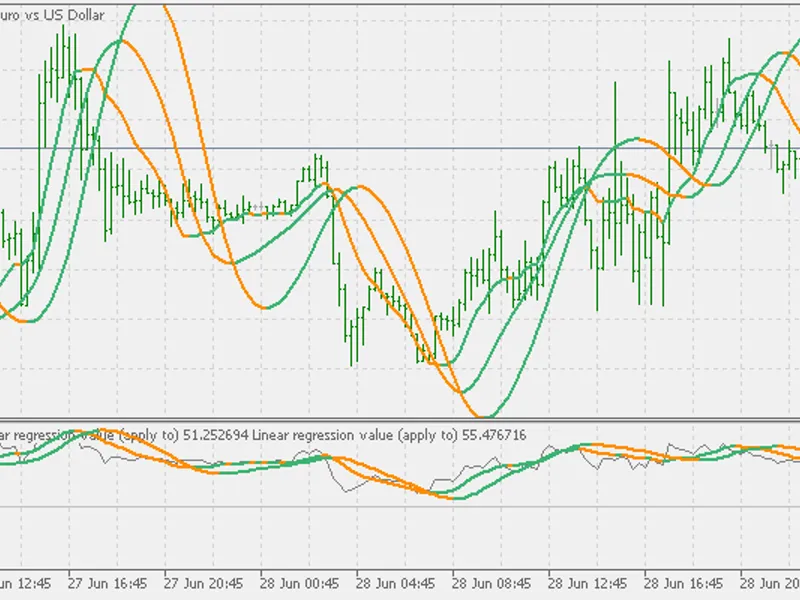
in the "good old days" coders were trying to optimize all the code that could be optimized. one such example was the optimization of liner regression calculation. coder that was co...
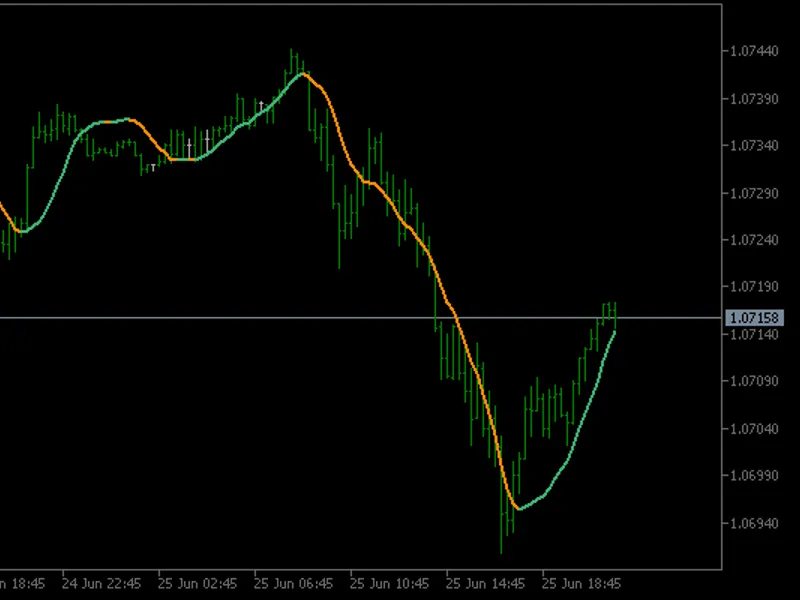
this indicator uses the calculating method described in details here : . please check that post for more detailsthe same function from the above link is used to calculate this slop...
this indicator uses the calculating method described in details here : . please check that post for more detailsthe same function from the above link is used to calculate this line...
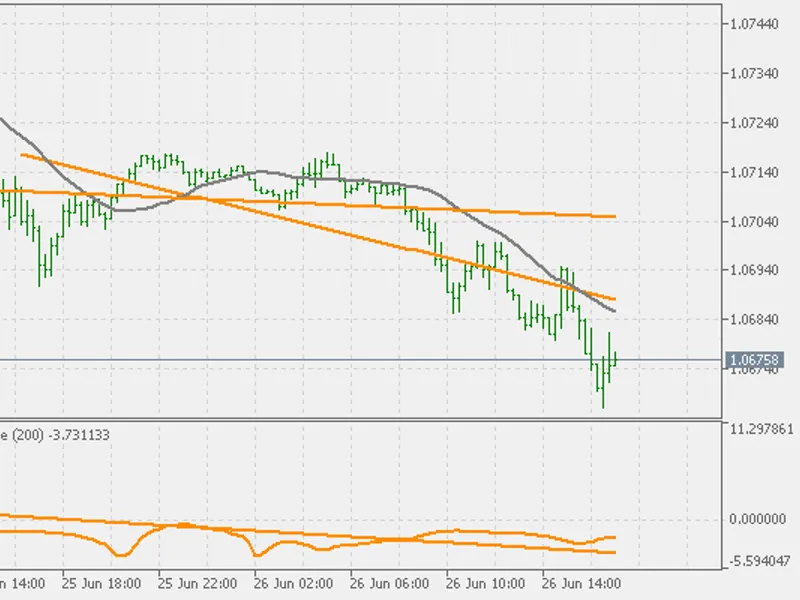
not all indicators are suitable to have an option to be applied to another indicator data via mt5 designed / allowed options. linear regression line (original that uses "simple" pr...
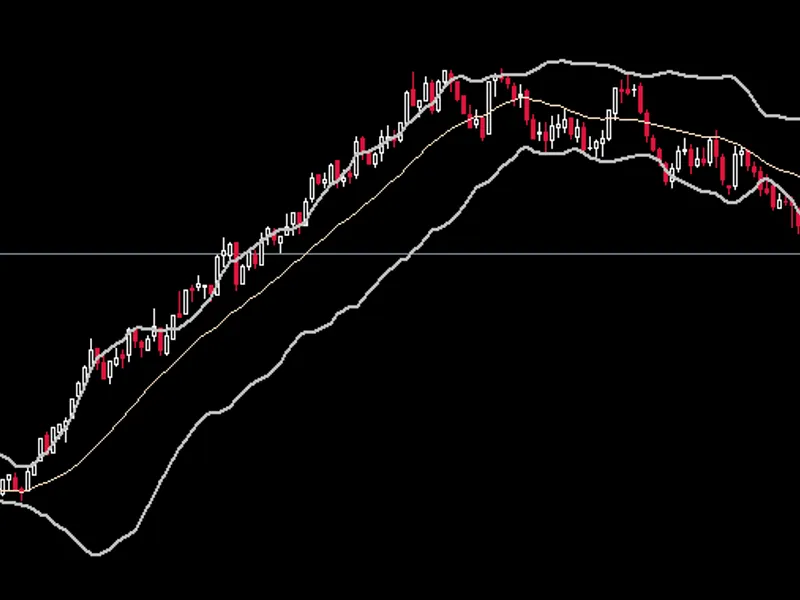
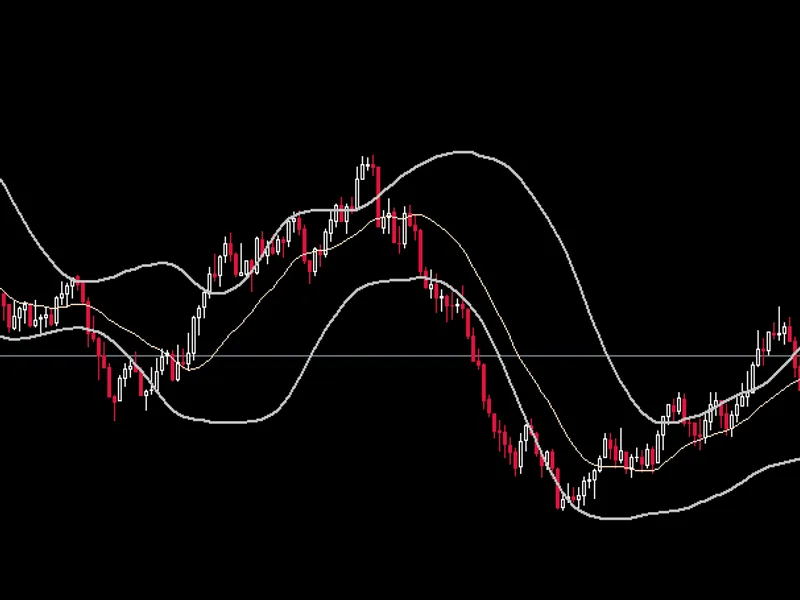
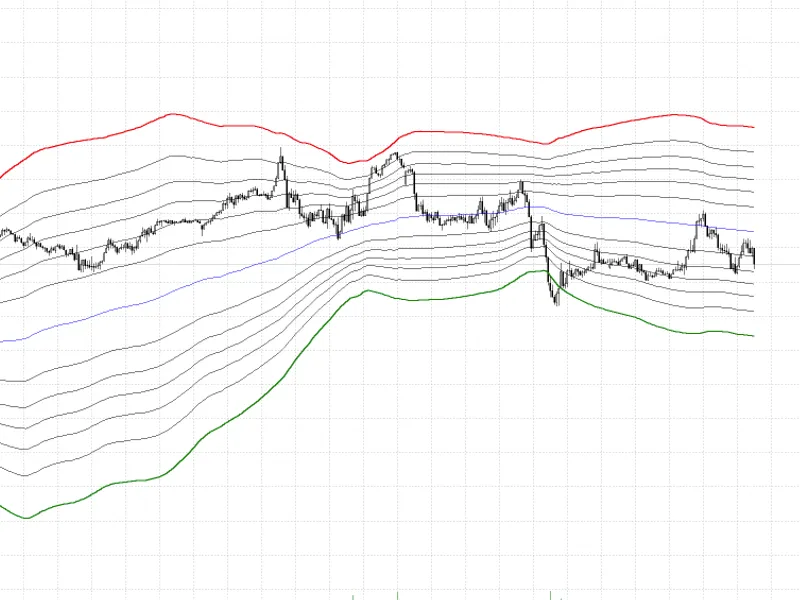
the premise of this bollinger bands indicator is that the outer bands can be individually controlled via smoothing. changing the smoothing period on the upper band does not have to...
another offshoot of the bollinger bands. the concept of post smoothing on the outer bands is to smooth the upper and lower band individually after the standard deviation calculatio...
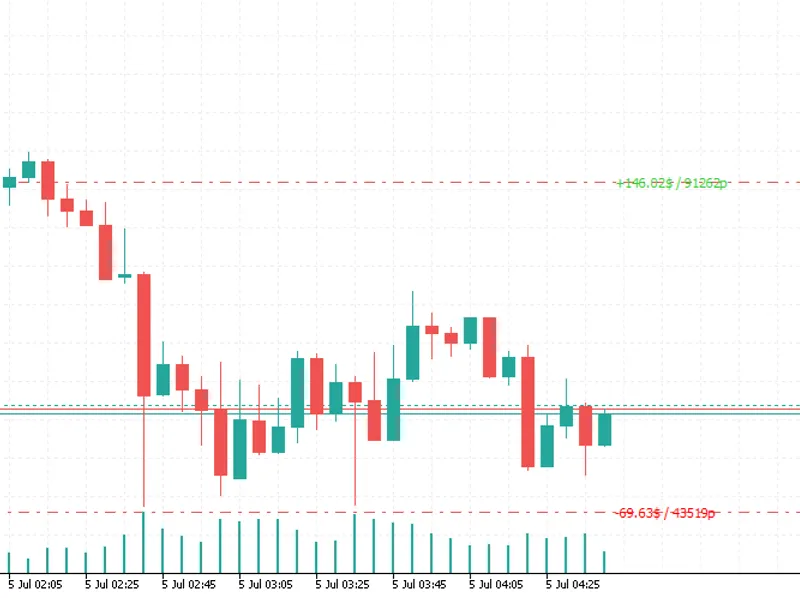
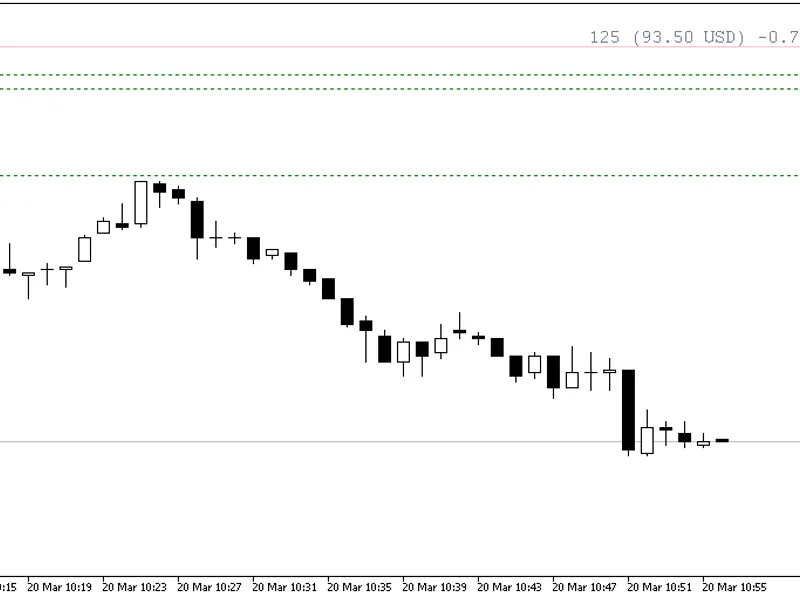
indicator displays the value of defined stop loss and or take profit in the deposit currency. converted fromnote: it calculates an estimated value based on a simple calculation and...
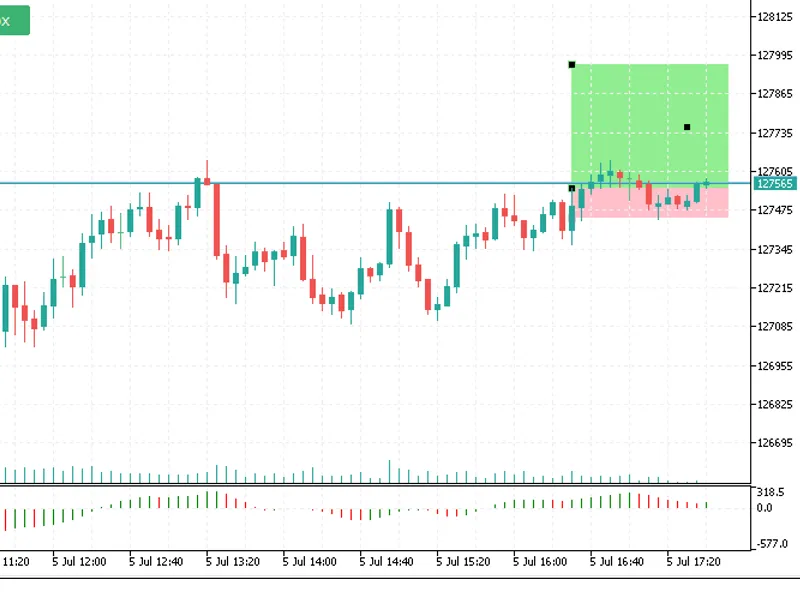
this indicator creates automatically a risk/reward box on you all opened chart base on high, low price with the old candles. converted fromyou can use it easily to drag and change ...
ma modified dpo facilitate controlling all parameters of ma (ma period , ma mode , ma applied price) to change required ma curve to horizontal line and can easily used as support o...
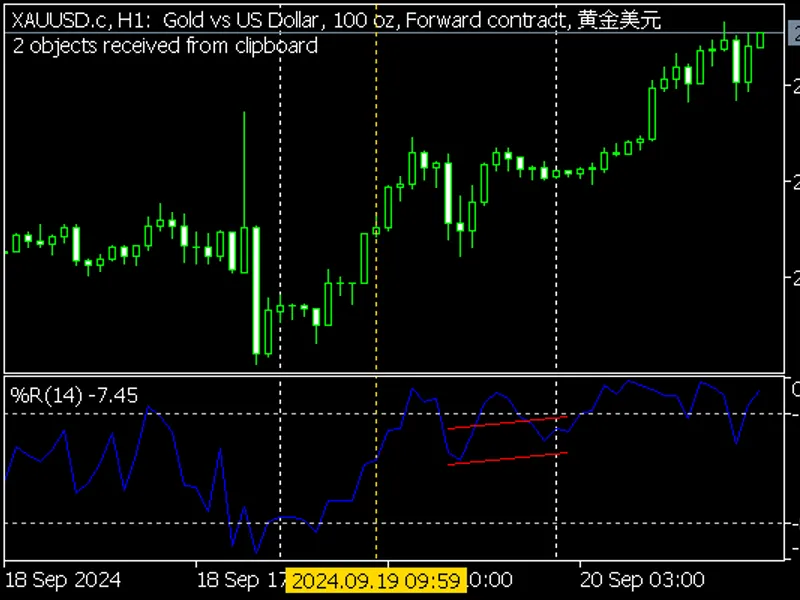
this code demonstrates how you can modify the objects in an indicator without having the source code. there are some indicators that don't use buffers, they are only using objects....
higher confidence in candle implication rises with body to range percentage which shall be higher than or equal to 50%, therefore indicator colors these candles while leave other c...
swing high/low identifierthe swing high/low identifier is a custom metatrader 5 (mt5) indicator designed to highlight significant swing points on your chart. this indicator identif...
this indicator will help visualize the bid and ask prices, making it easier to decide on trade entries and exits.a custom bid and ask line is created which is labelled and visually...
the high and low line indicatoris a straightforward yet powerful tool designed to plot the highest and lowest price levels of a selected symbol directly on the chart. this indicato...
fair value gap (fvg) in trading refers to a price inefficiency or imbalance that occurs when there is a significant gap between the opening, high, low, and closing prices of three ...
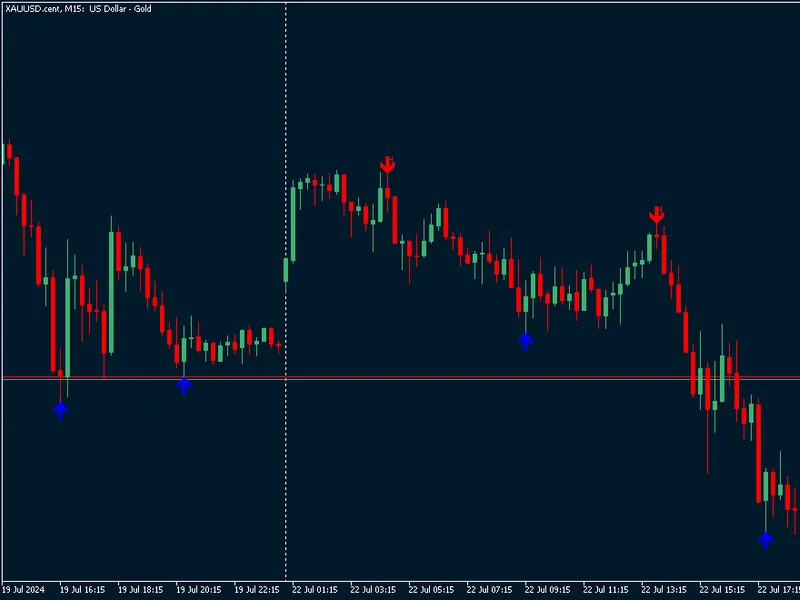
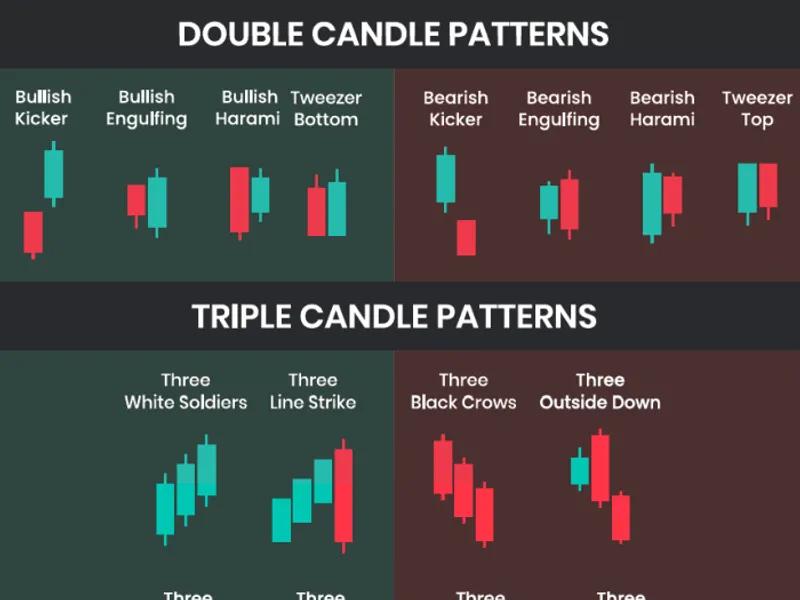
this is an indicator that helps identify engulfing candle patterns.the red arrow represents a bearish engulfing, while the green arrow represents a bullish engulfing.if you want to...
if you want to create your own trading bot that integrates with this indicator, please contact me.i will help you create an optimized trading bot tailored specifically for you....
rsi condition:the relative strength index (rsi) for the current period is below a specified low threshold (rsilow). this indicates oversold conditions. candlestick pattern:it chec...
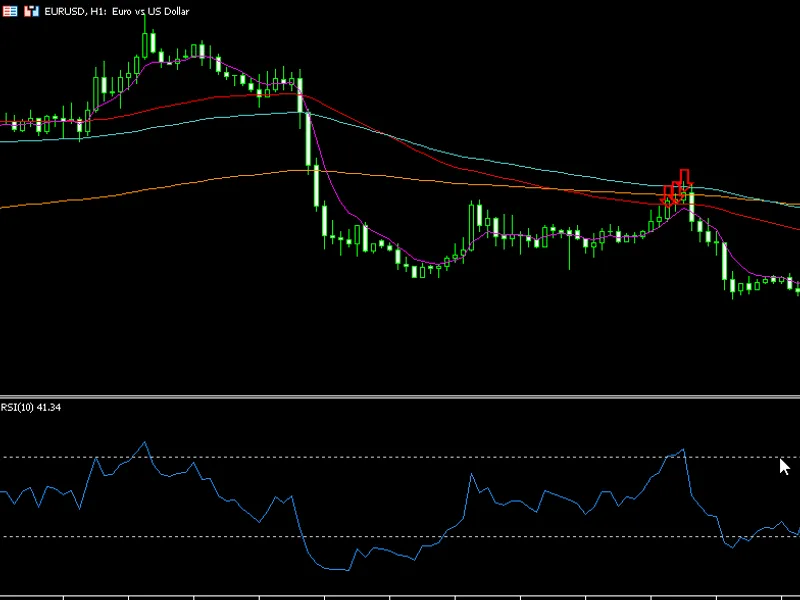
this mt5 alert is designed to identify potential buying opportunities based on several technical indicators and price action patterns. here's how it works: buy conditions 1. rsi co...
mt5 alert indicatorplease add ema moving averages 60/100/200 & rsi period 10 levels 30/70 to your chart.this indicator alert on a trend reversal strategy were- ema 60 > 100&...
this indicator alerts on manually drawn trendline -must have both lower and upper trend line drawnalerts when price closes above upper trendlinealerts when price closes below lower...
have you ever needed to copy and paste some graphical objects between open charts? i think you have. surprisingly, metatrader does not provide "copy & paste" feature for object...
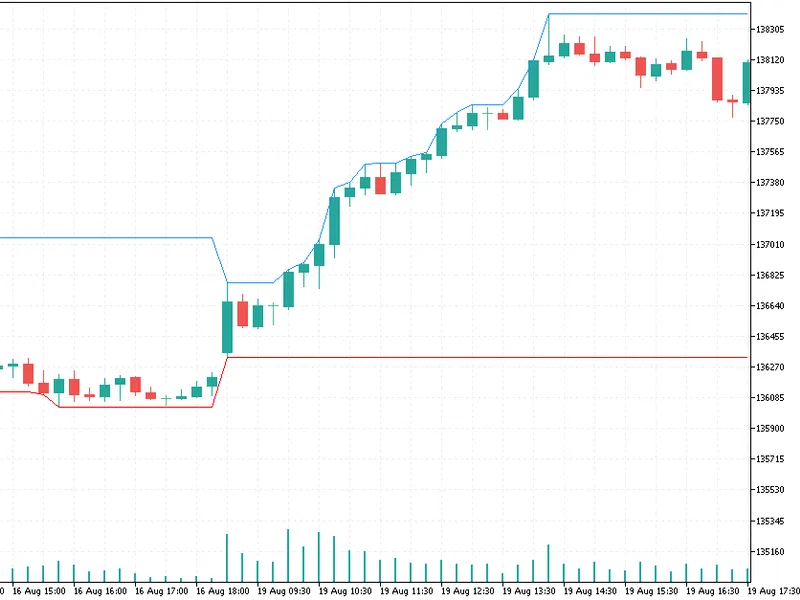
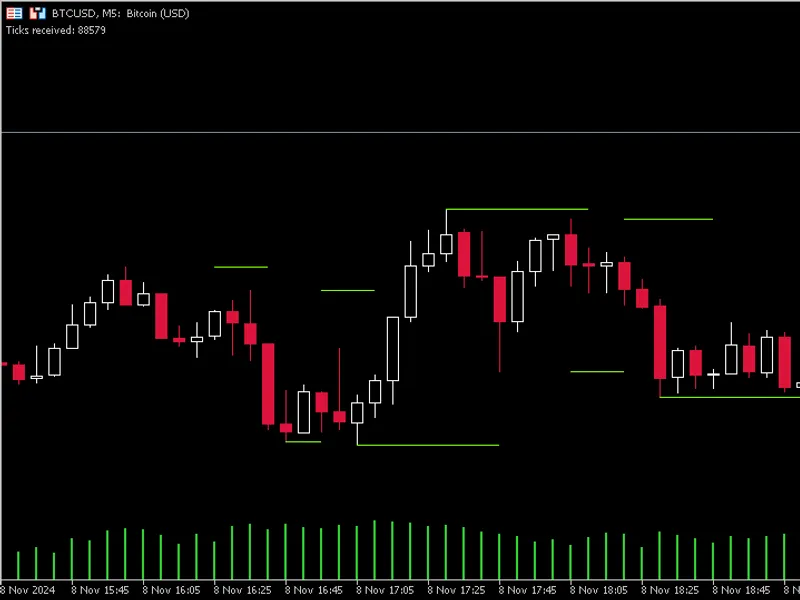
indicator description: ptb.mq5 overview: the ptb.mq5 indicator is designed for use in the metatrader 5 trading platform. it calculates and displays short-term and long-term high an...
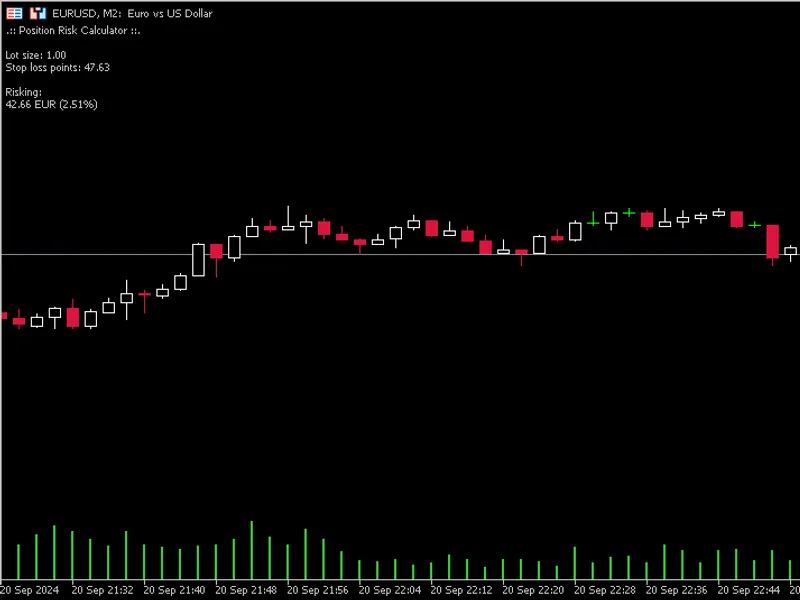
this is a tool to calculate position risk from a lot size and stop loss level.click on the chart to set a virtual stop loss, and it will calculate the risk in percentage as well as...
this is a tool to calculate the lot size from a risk percentage and stop loss level. click on the chart to set a virtual stop loss, and it will calculate the lot size for the risk ...
perfect seconds chart indicator allows you to convert minute candles of live data into secondsremove this line of code from oninit and oncalculate in case of you find indicator not...
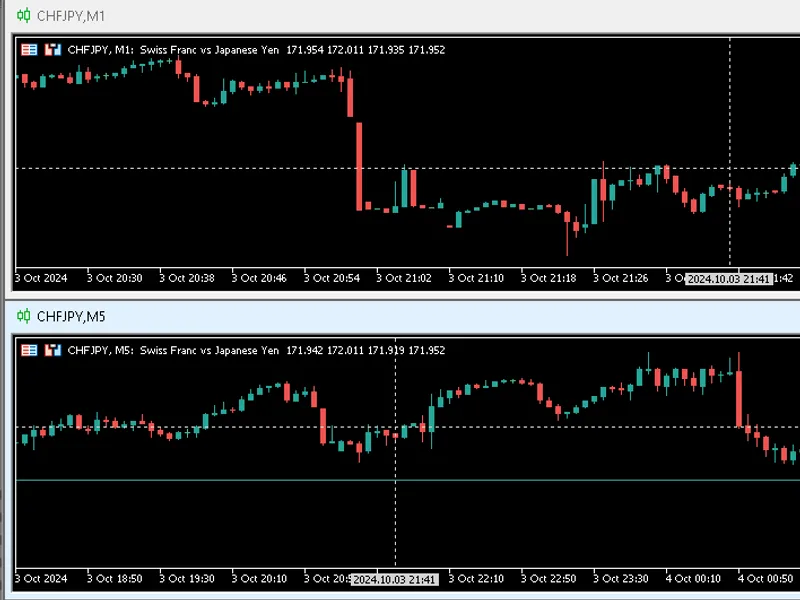
useful for multi timeframe charts to locate candle of interest.it converts optionally server time to local time shown as tooltip.press [ctrl] or [shift] key while moving mouse on a...
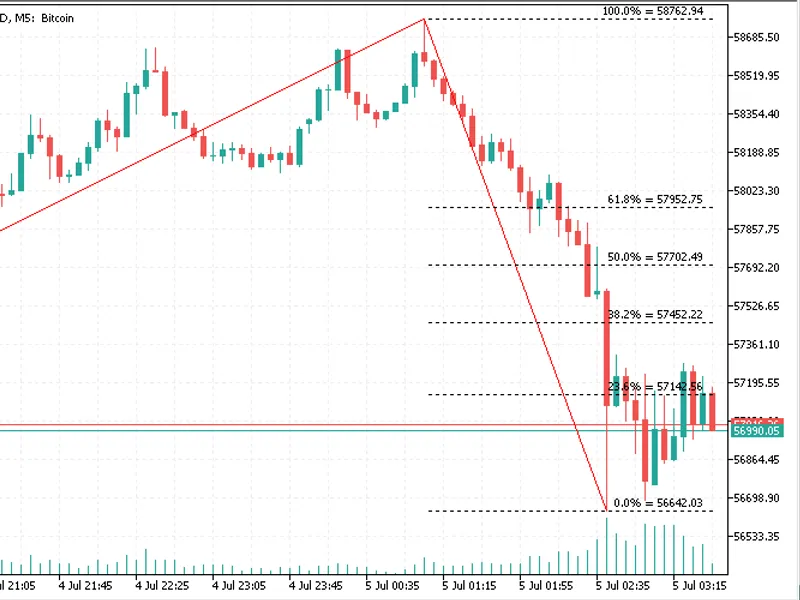
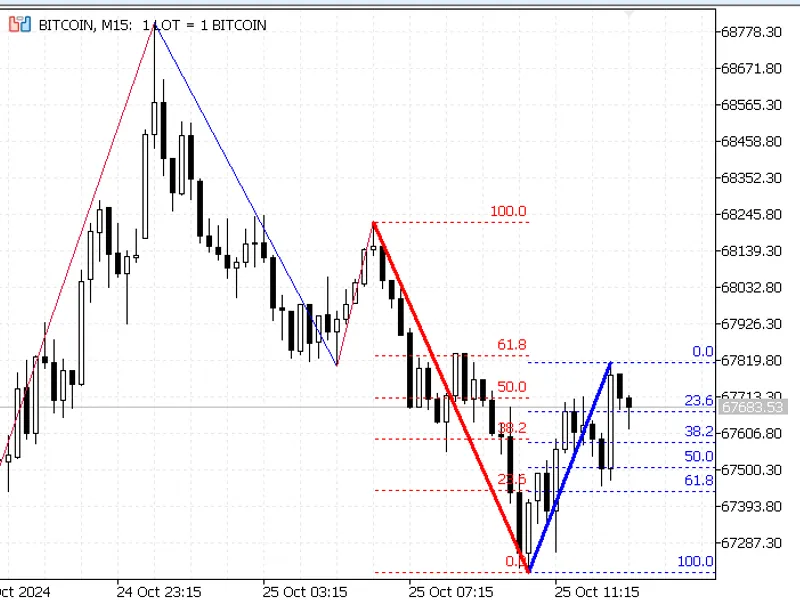
features: automatic fibonacci levels: the indicator dynamically draws fibonacci retracement lines based on recent zigzag highs and lows, giving a clear view of potential reversal p...
the indicator weekdays displays day of week, week of year, day of year or bar index in the data window, and optionally in labels on the chart. as usual, the information in the data...
the hammer indicator identifies key candlestick formations, specifically green and red hammers as well as inverted hammers, on a metatrader 5 chart. it is designed to highlight pot...
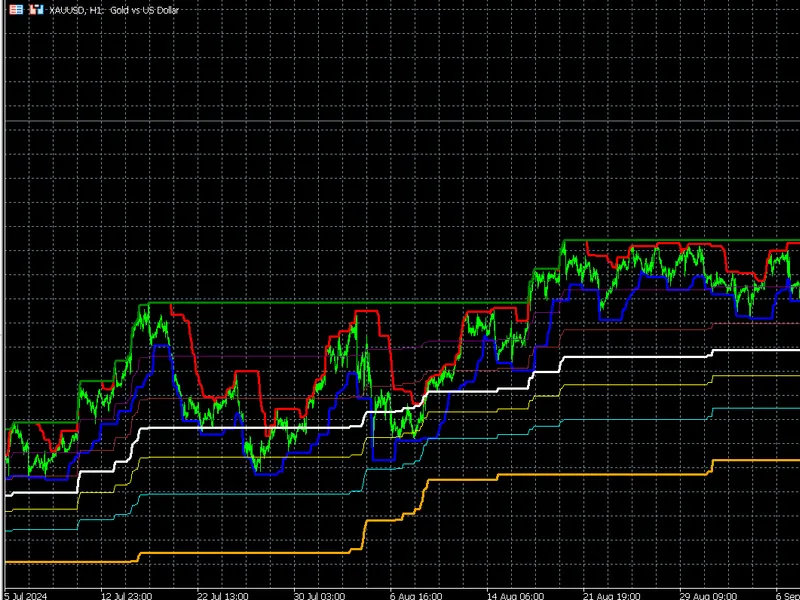
an indicator to mark extremums with lines. a period input is used to determine highest highs and lowest lows for that period. in this indicator, it's not only highs and lows (ohlc)...
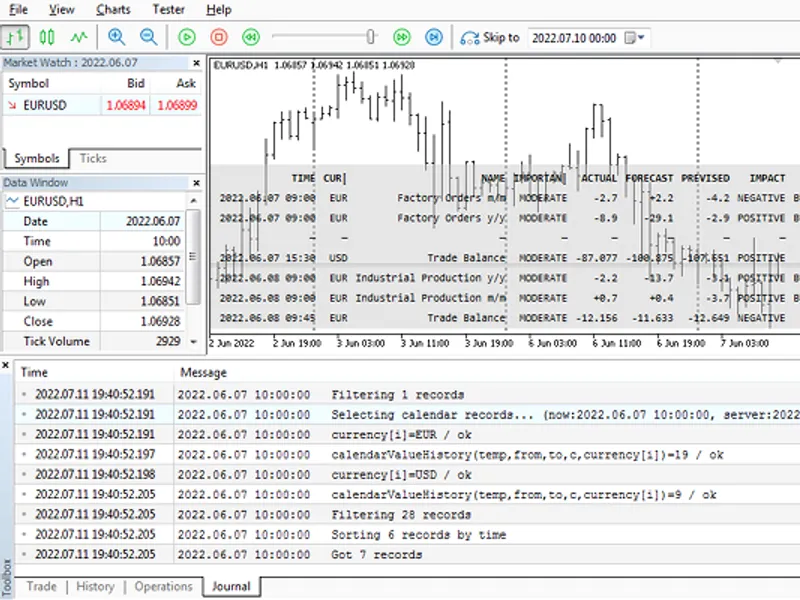
to make a long story short: the built-in economic calendar of metatrader 5 is not (completely) synchronized with historical quotes. quotes are marked with timestamps in accordance ...
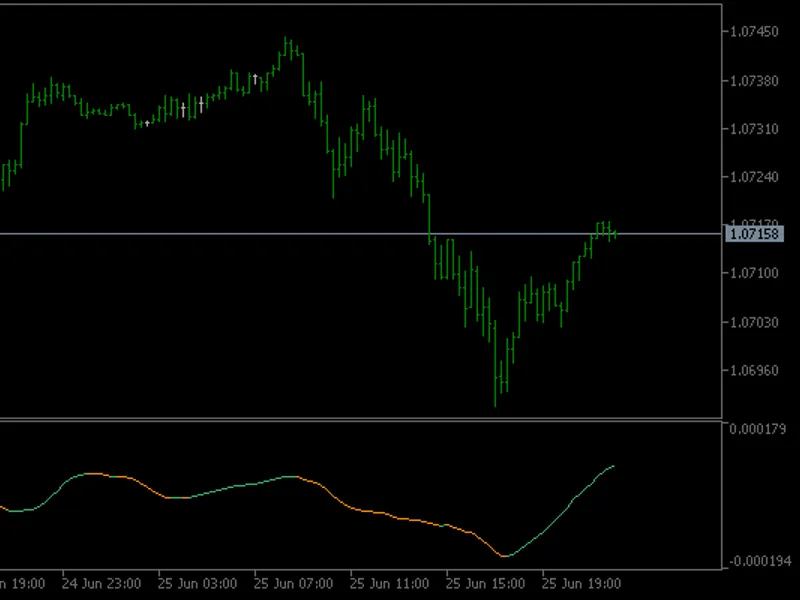
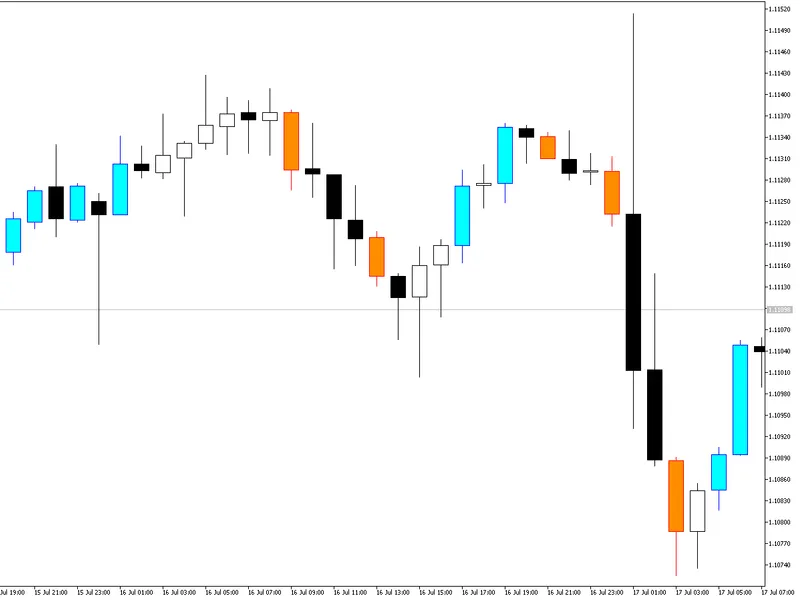
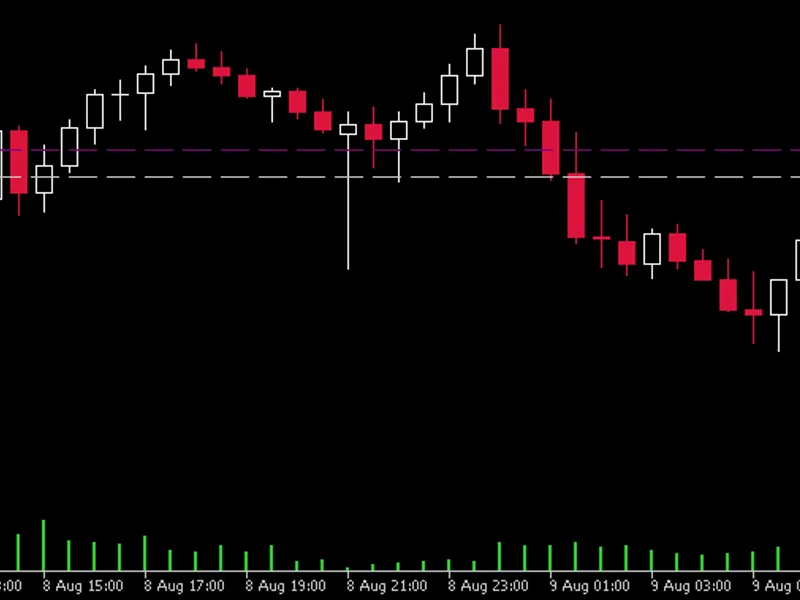
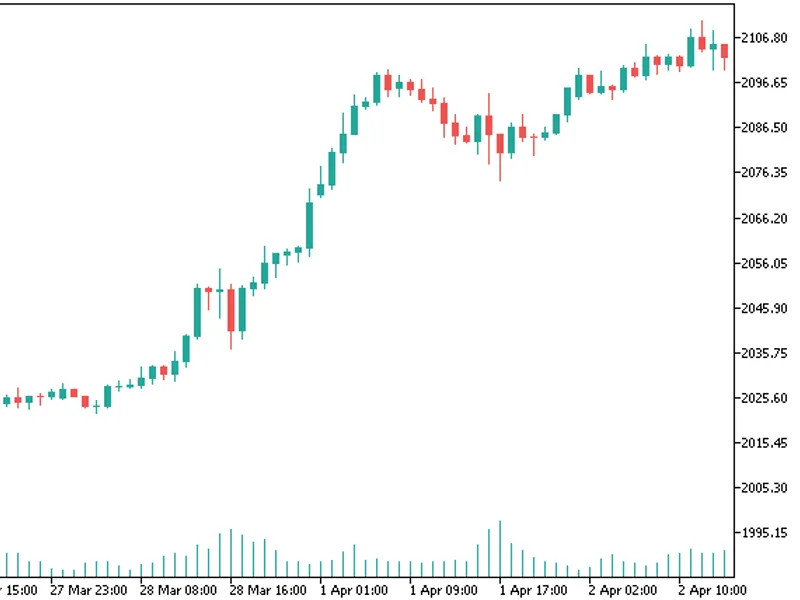
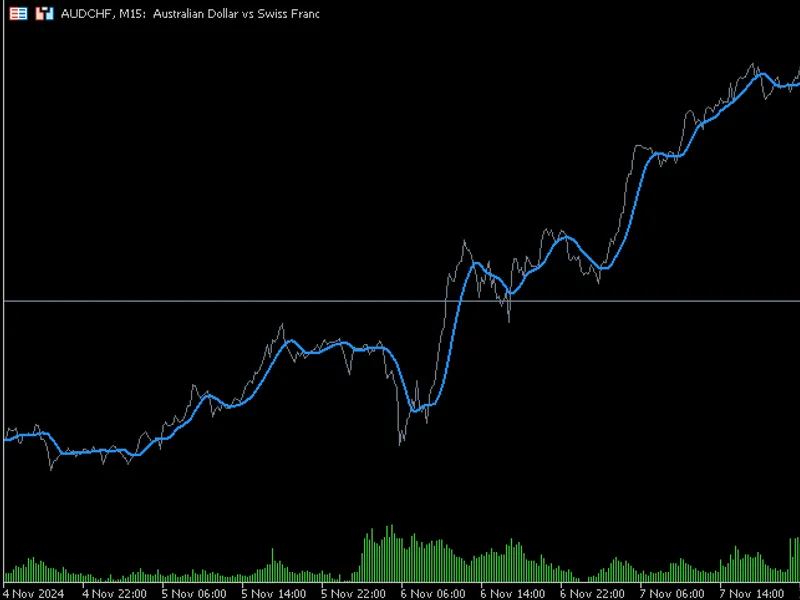
a simple indicator to make a smoother line chart while also using tick volume to determine the market direction.the basic idea is to give you the true direction of where the market...
features: automatically calculates fibonacci levels on bollinger bands. provides a unique perspective for breakout and reversal trades. fully compatible with metatrader 5. perfect ...
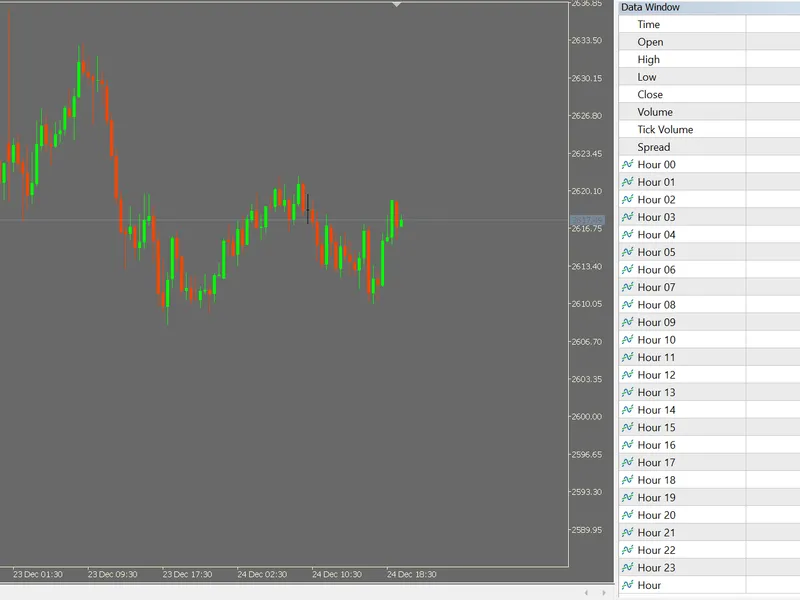
purpose users may collect data for modelling. time dummies are frequently used in economic modelling. the simple indicator below, which can easily be expanded upon, provides each h...
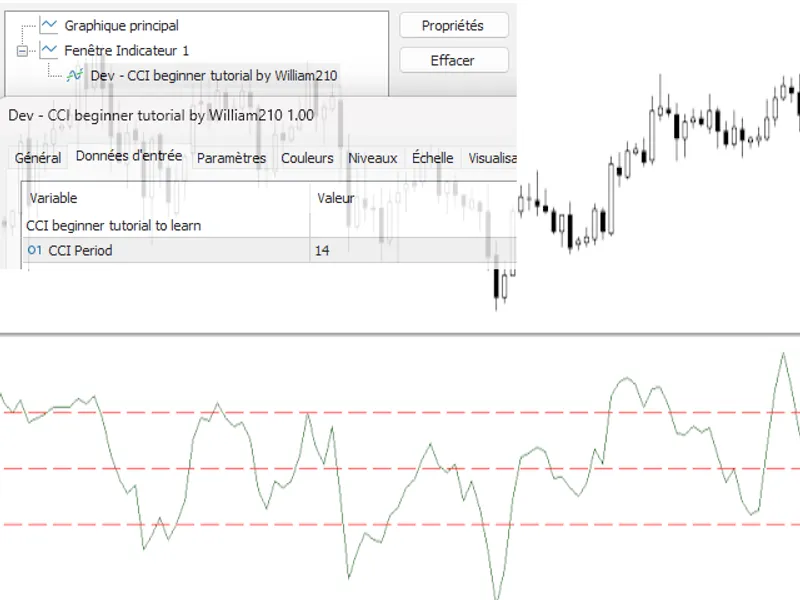
settings and parameters general parametersmomentum periodthe number of candles used to calculate momentum.recommended value: 14(the higher the value, the smoother the curve, but wi...
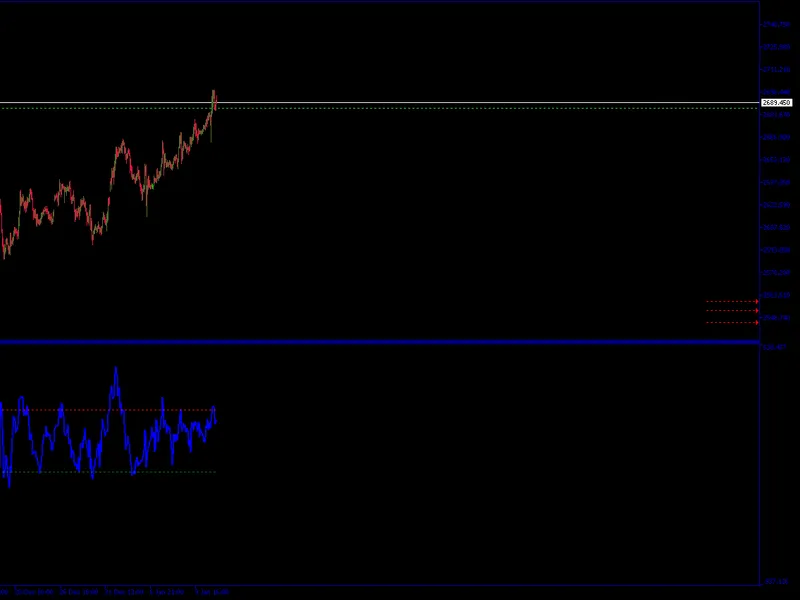
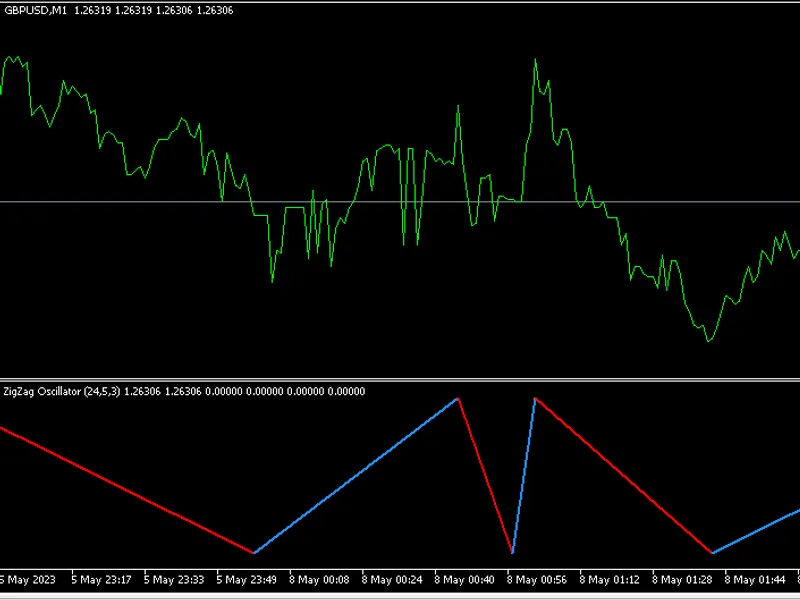
here are some differences and advancements:- the zigzag has two modes "oscillator" and "highlow". the oscillator mode will show a visual oscillation of the zigzag swings, even thou...
input parameters showbodysize(default = false) — if true, a candle's body size will also be shown.havepipettes(default = false) — if true, the indicator will assume that the curren...
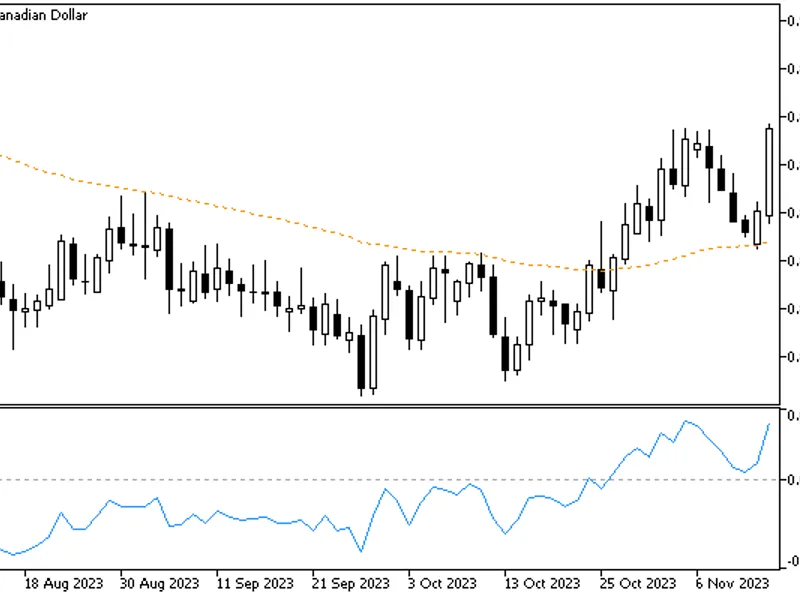
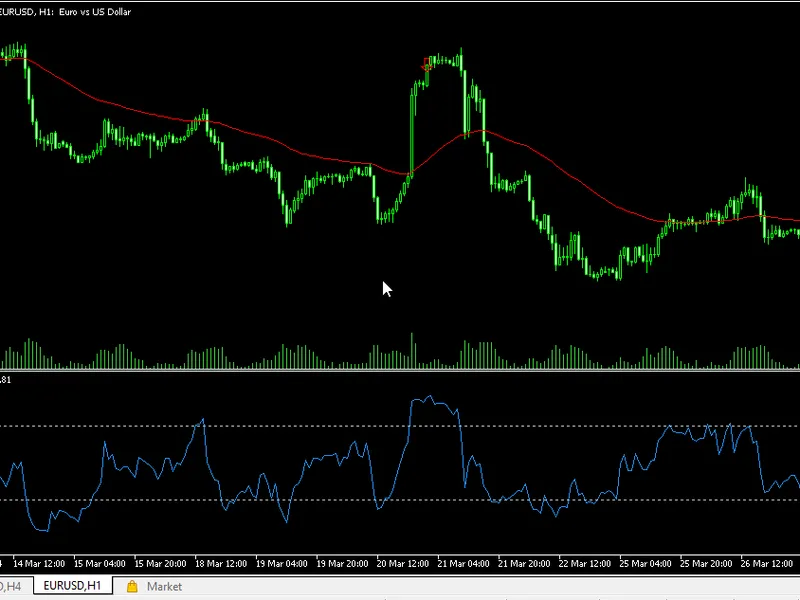
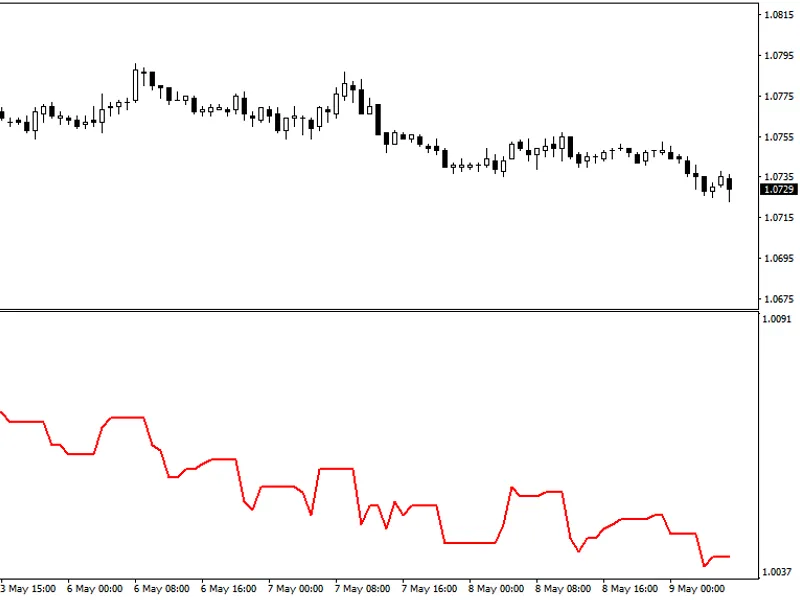
negative volume index (nvi)is a free technical indicator for advanced chart analysis in mt4, mt5 platforms. it is based on tick volume (can be substituted with real volume in mt5) ...
breakeven line indicatoris a metatrader indicator that calculates breakeven level based on all open positions and displays it on your chart as a horizontal line. additionally, it w...
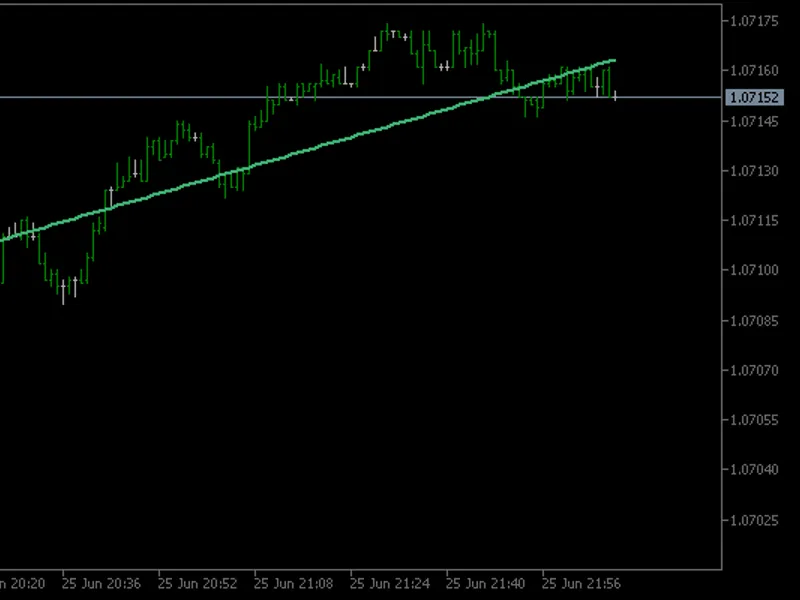
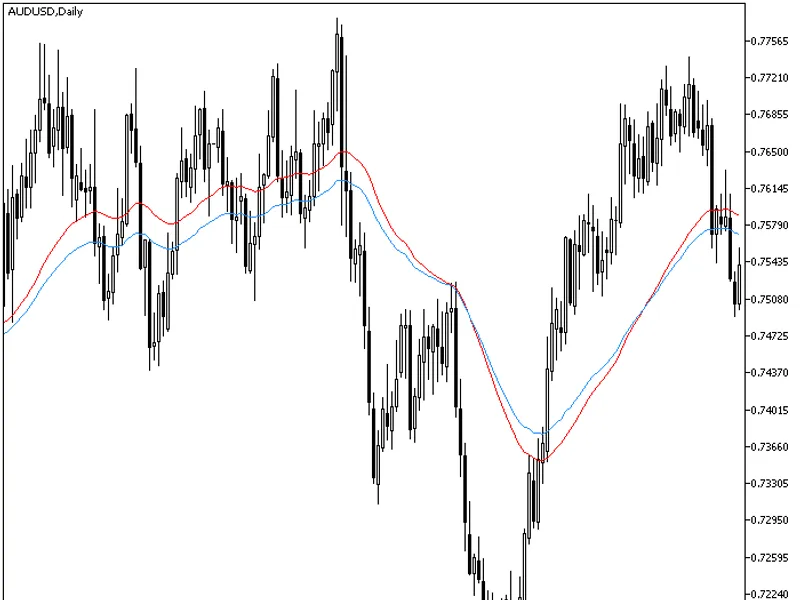
input parameters ma_period (default = 50) — a period of the 3rd generation moving average. ma_sampling_period (default = 220) — a sampling period of the 3rd generation moving avera...
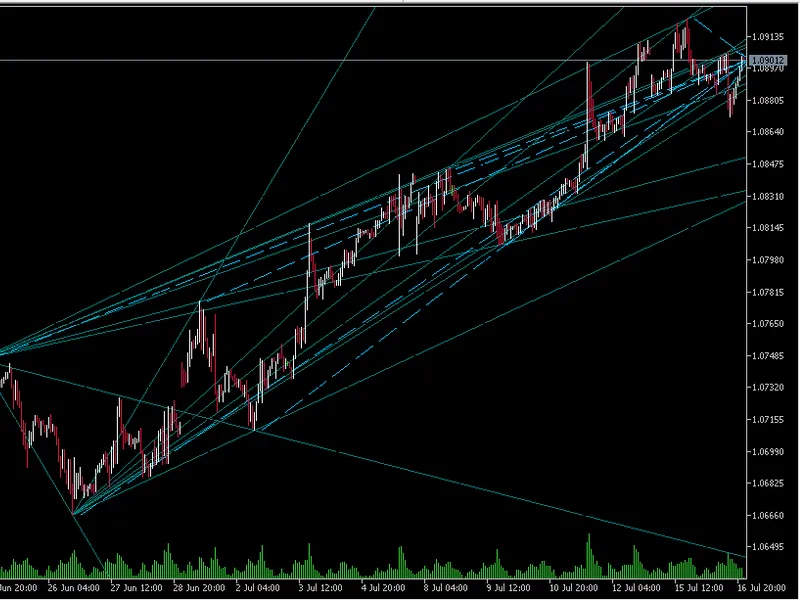
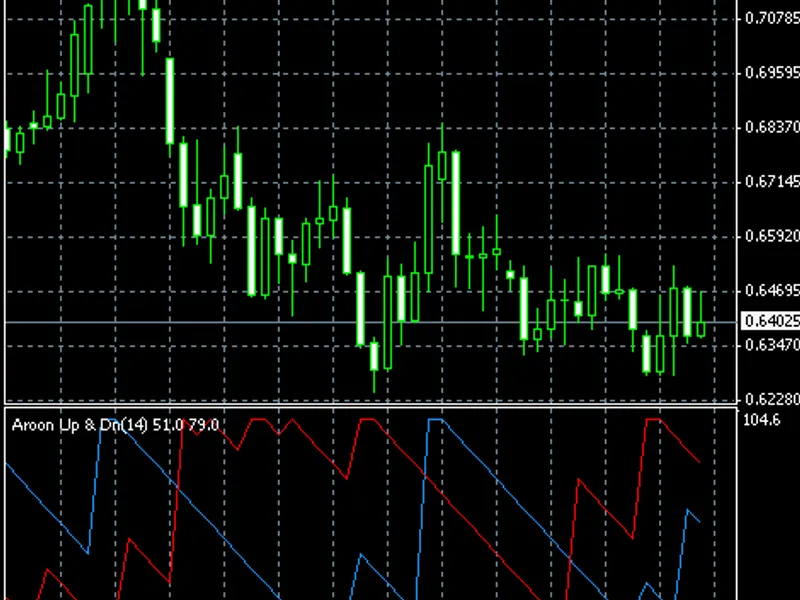
input parameters aroonperiod (default = 14) — the period in chart bars for the indicator to look up for the bottoms and the tops. as with many other indicators, the higher is the p...