
negative volume index indicator
Info
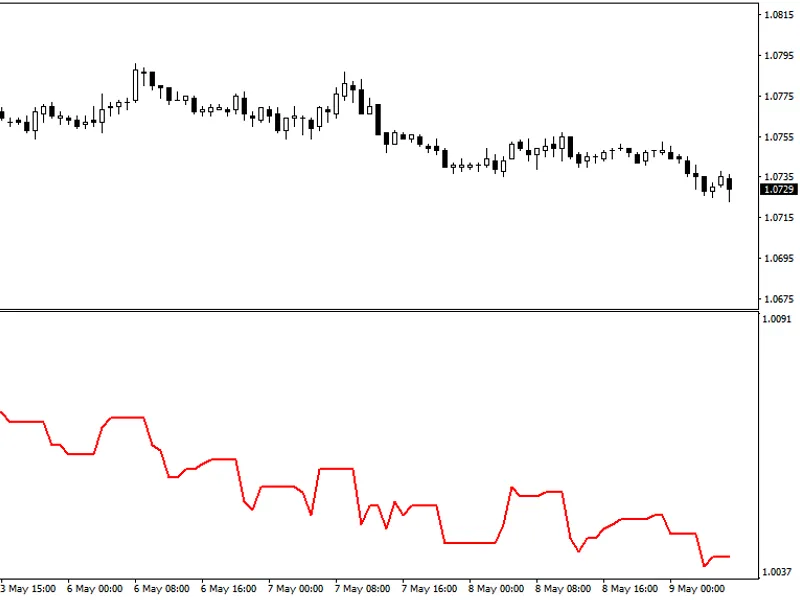
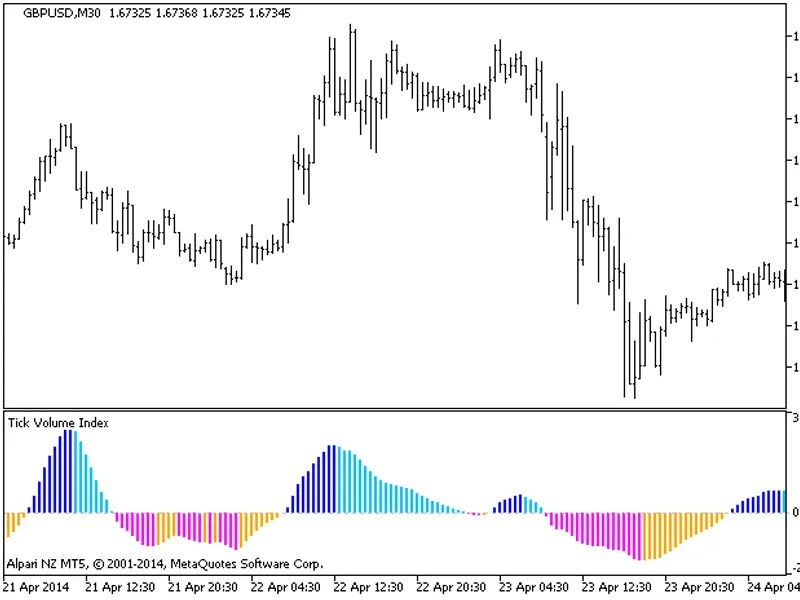
The negative volume index indicator is a Indicator for MetaTrader 5 that negative volume index (nvi)is a free technical indicator for advanced chart analysis in mt4, mt5 platforms. it is based on tick volume (can be substituted with real volume in mt5) and has two useful features added:support for multi-timeframe (mtf) operation.
Usage
This tool is typically used for enhancing chart analysis and decision making.
Platform
This Indicator works exclusively on MetaTrader 5 (both build 600+ and newer versions).
Setup
Place the downloaded file in MQL5/Indicators folder via File ? Open Data Folder in MetaTrader 5.
How to Install and Use negative volume index indicator
1. Installation: Place your file in the MQL/Indicators folder via "Open Data Folder" and restart your terminal.
2. Loading: Find the indicator in the Navigator, drag it onto your chart, and configure the input parameters in the popup window.
3. Customization: Press Ctrl+I to open the indicator list, select your tool, and click "Properties" to change colors, levels, or visual styles.
4. Updating: Replace the old file in the Indicators folder with the new version and restart the platform to apply changes.
Frequently Asked Questions
Q: Why is my indicator not showing? A: Verify the file is in the MQL/Indicators folder, or try right-clicking the "Indicators" tree in the Navigator and clicking "Refresh."
Q: Do custom indicators slow down the platform? A: Too many complex indicators can impact performance; remove unused ones via the "Indicator List" (Ctrl+I).
Q: Can I use MT4 indicators on MT5? A: No, MQL4 and MQL5 are distinct languages; ensure the indicator is compiled specifically for your platform version.
What this tool does
negative volume index (nvi)is a free technical indicator for advanced chart analysis in mt4, mt5 platforms.
Typical Use Case
This Indicator excels in automated trading and technical analysis on MetaTrader 5.
Compatible Platform & Setup
This Indicator works on MetaTrader 5. Place the file in the MQL5/Indicators folder and restart the terminal.
Description & Settings
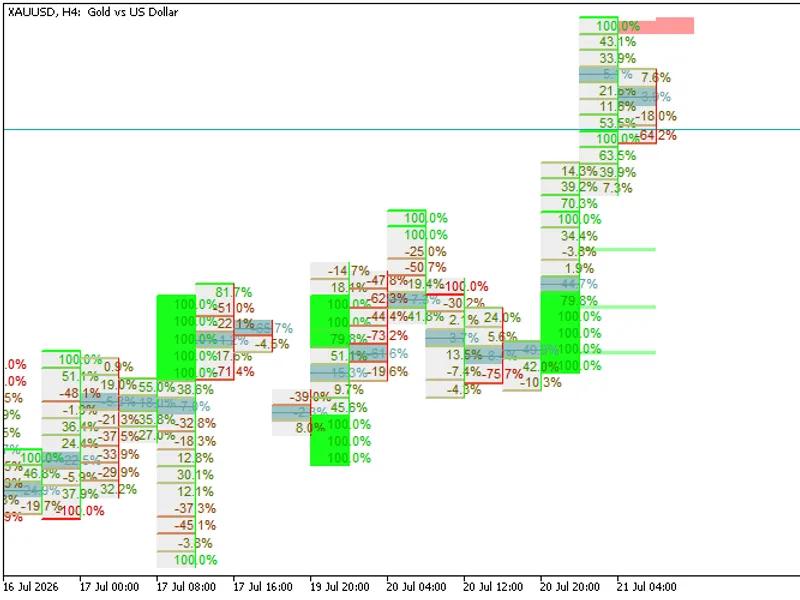
Related: Footprint X Ray: Advanced Order Flow and Volume Delta Analysis - another powerful indicator for MetaTrader 5 traders.
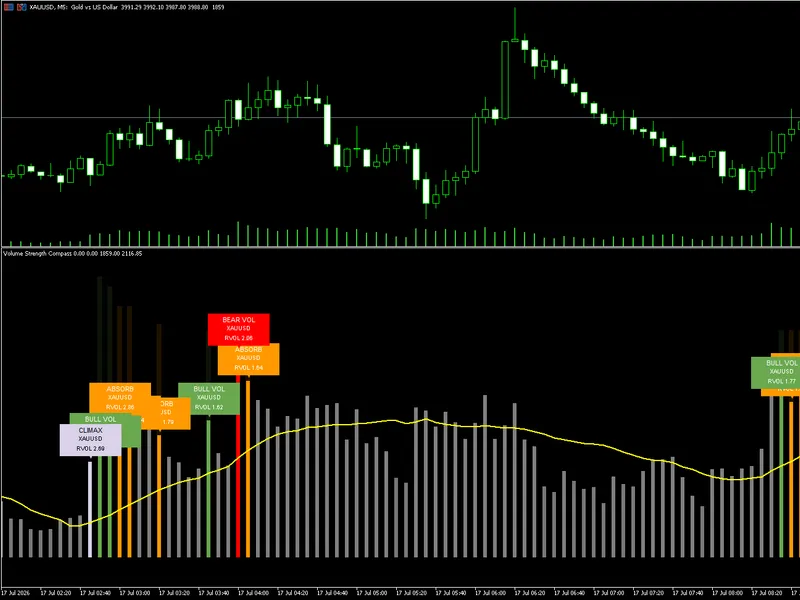
Also recommended: Volume Strength Compass by Bhanu Code Lab - similar indicator with strong performance on MetaTrader 5.
negative volume index (nvi)is a free technical indicator for advanced chart analysis in mt4, mt5 platforms. it is based on tick volume (can be substituted with real volume in mt5) and has two useful features added:
support for multi-timeframe (mtf) operation.
can be switched to show positive volume index.
the negative volume index is shown in a separate chart window below the main chart and doesn't use any standard or custom indicators in its code. this implementation of nvi is available for the mt4, mt5 platforms.
what is negative volume index (nvi) indicator?
negative volume index (nvi) indicator is a rather old technical indicator that was developed by paul l. dysart in the first half of the 20th century and improved by norman g. fosback in 1976. it is composed of one oscillating line in the separate indicator window. the line rises or declines only for bars where volume is less than the preceding bar's volume.
how to use negative volume index (nvi) indicator? classic nvi strategy
the classic interpretation of negative volume index is that the trend's confirmation by a subsequent movement of the nvi signals the trend's strength. the idea is that a strong trend will continue even on falling volumes. a cross with its moving average can be considered as a trend confirmation.
as with other ma crossover strategies, this one is susceptible to produce false or lagging signals.
nvi divergence strategy
another option is to look at the divergence between the price and its negative volume index to spot trend reversal. here, the price chart is making new higher highs while the nvi is demonstrating a lower low. a long-term downtrend ensues:
unfortunately, such signals aren't always clear or accurate. as with other , it makes sense to use additional confirmations before entering or exiting a trade.
higher timeframe perspective
considering that the volume on higher timeframe bars can significantly vary from that on the lower timeframe bars, the resulting nvi curve might offer a different picture of the market situation.
positive volume index (pvi)
the negative volume index indicator can be switched to calculate and display positive volume index instead. this lets traders see the price changes accompanied by a rising volume. the resulting curve isn't much different from the price chart:
consequently, pvi is considered less informative than nvi.
nvi input parameters
indicator shift
(default = 0) — the horizontal shift in bars for indicator curve. can be positive (to shift right) or negative (to shift left).
timeframe
(default = current) — the timeframe to calculate the nvi line on. if you set it to a timeframe that is higher than the current one, the indicator will display a higher timeframe nvi on the current chart. the parameter is ignored if set to a timeframe that is lower than the current one.
positive volume index?
(default = false) — if true, the indicator will use calculate the positive volume index (pvi) instead of the negative volume index (nvi).
volumetype
(default = volume_tick) — the type of volume to use in calculations — tick volume or real volume. this parameter is available only in mt5.
You may also like: institutional harmonic volumetric gravity center indicator - excellent alternative for indicator users on MetaTrader 5.
Source Code
#property copyright "RobotFX"
#property version   "2.01"
#property strict
#property description "Educational code - RobotFX www.robotfx.org"
#property description "Educational code - RobotFX www.robotfx.org"
#property description "Educational code - RobotFX www.robotfx.org"
#property description "Educational code - RobotFX www.robotfx.org"
#property indicator_separate_window
#property indicator_buffers 2
#property indicator_plots 1
.......
⚠ Limitations & Risk Warning
- This tool is provided for educational and testing purposes only.
- Past performance does not guarantee future results.
- Trading involves substantial risk of loss. Use on a demo account first.
- Results may vary depending on market conditions, broker, and settings.
- We recommend thorough backtesting and forward testing before using with real funds.