PT B
This software component for MetaTrader 5 is built to enhance the capabilities of your trading environment. This technical indicator acts as a specialized analysis tool designed to visualize market data. It helps traders identify emerging trends, momentum shifts, and key support or resistance levels by plotting statistical calculations directly onto price charts.
How to Setup and Use PT B
1. Installation: Place your file in the MQL/Indicators folder via "Open Data Folder" and restart your terminal.
2. Loading: Find the indicator in the Navigator, drag it onto your chart, and configure the input parameters in the popup window.
3. Customization: Press Ctrl+I to open the indicator list, select your tool, and click "Properties" to change colors, levels, or visual styles.
4. Updating: Replace the old file in the Indicators folder with the new version and restart the platform to apply changes.
Frequently Asked Questions
Q: Why is my indicator not showing? A: Verify the file is in the MQL/Indicators folder, or try right-clicking the "Indicators" tree in the Navigator and clicking "Refresh."
Q: Do custom indicators slow down the platform? A: Too many complex indicators can impact performance; remove unused ones via the "Indicator List" (Ctrl+I).
Q: Can I use MT4 indicators on MT5? A: No, MQL4 and MQL5 are distinct languages; ensure the indicator is compiled specifically for your platform version.
Description & Settings
Indicator Description: PTB.mq5
Overview:
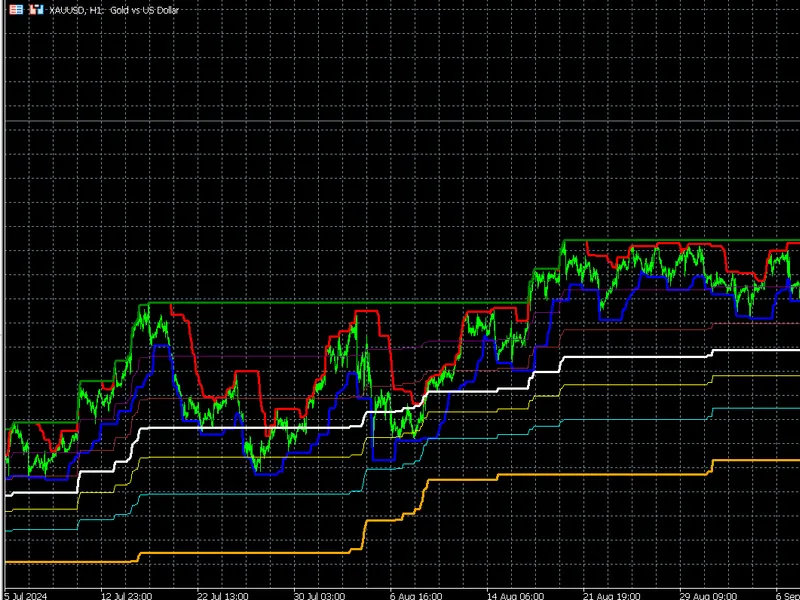
The PTB.mq5 indicator is designed for use in the MetaTrader 5 trading platform. It calculates and displays short-term and long-term high and low levels, along with Fibonacci retracement levels based on these extremes.
Features:
-
Short-Term High and Low:
The indicator computes the highest and lowest prices over a user-defined short length, which can help traders identify immediate support and resistance levels. -
Long-Term High and Low:
It also calculates the highest and lowest prices over a longer period, providing insights into broader market trends. -
Fibonacci Levels:
The indicator plots important Fibonacci retracement levels (23.6%, 38.2%, 50%, 61.8%, and 78.6%) based on the long-term high and low, which are widely used by traders to identify potential reversal points in the market.
Input Parameters:
- shortLength: The number of candles to consider for calculating short-term high and low. - longLength: The number of candles to consider for calculating long-term high and low.
Visual Representation:
- The indicator uses distinct colors and widths for different plotted lines: -
Short High
: Red (width: 3) -
Short Low
: Blue (width: 3) -
Long High
: Green (width: 3) -
Long Low
: Orange (width: 3) -
Fibonacci Levels:
- 78.6%: Purple (width: 1) - 23.6%: Aqua (width: 1) - 38.2%: Yellow (width: 1) - 61.8%: Brown (width: 1) - 50%: White (width: 3)
Calculation Logic:
- The indicator iterates over the price data to compute the highest and lowest values for both short and long periods. - It then calculates the Fibonacci levels based on the difference between the long-term high and low.