
better volume
Info
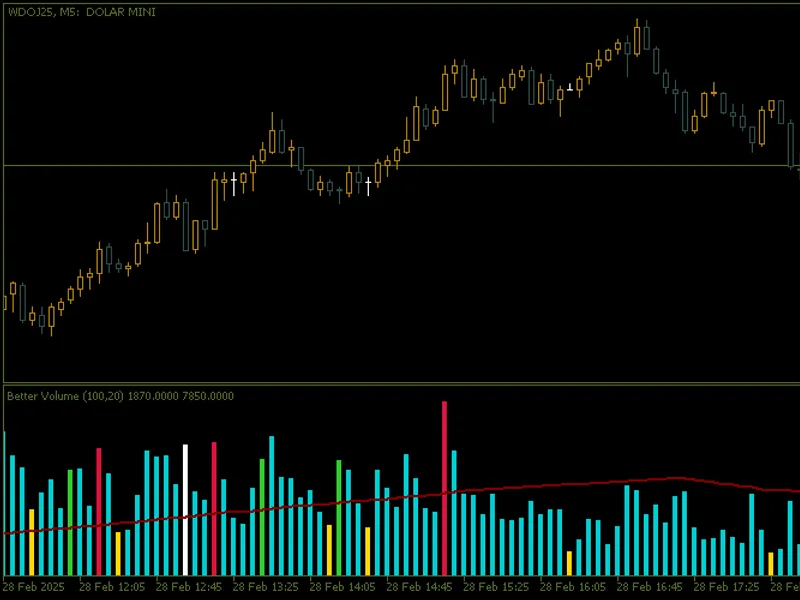
The better volume is a Indicator for MetaTrader 5 that main features dynamic volume categorisation :the indicator classifies volume into various categories, assigning different colours to facilitate visual interpretation: buying climax ( clrcrimson ): identifies moments when volume is extremely high and the price is rising. selling climax ( clrlimegreen ): signals moments of strong selling pressure with high volume.
Usage
This tool is typically used for enhancing chart analysis and decision making.
Platform
This Indicator works exclusively on MetaTrader 5 (both build 600+ and newer versions).
Setup
Place the downloaded file in MQL5/Indicators folder via File ? Open Data Folder in MetaTrader 5.
How to Install and Use better volume
1. Installation: Place your file in the MQL/Indicators folder via "Open Data Folder" and restart your terminal.
2. Loading: Find the indicator in the Navigator, drag it onto your chart, and configure the input parameters in the popup window.
3. Customization: Press Ctrl+I to open the indicator list, select your tool, and click "Properties" to change colors, levels, or visual styles.
4. Updating: Replace the old file in the Indicators folder with the new version and restart the platform to apply changes.
Frequently Asked Questions
Q: Why is my indicator not showing? A: Verify the file is in the MQL/Indicators folder, or try right-clicking the "Indicators" tree in the Navigator and clicking "Refresh."
Q: Do custom indicators slow down the platform? A: Too many complex indicators can impact performance; remove unused ones via the "Indicator List" (Ctrl+I).
Q: Can I use MT4 indicators on MT5? A: No, MQL4 and MQL5 are distinct languages; ensure the indicator is compiled specifically for your platform version.
What this tool does
main features dynamic volume categorisation :the indicator classifies volume into various categories, assigning different colours to facilitate visual interpretation: buying climax ( clrcrimson ): identifies moments when volume is extremely high and the price is rising.
Typical Use Case
This Indicator excels in automated trading and technical analysis on MetaTrader 5.
Compatible Platform & Setup
This Indicator works on MetaTrader 5. Place the file in the MQL5/Indicators folder and restart the terminal.
Description & Settings
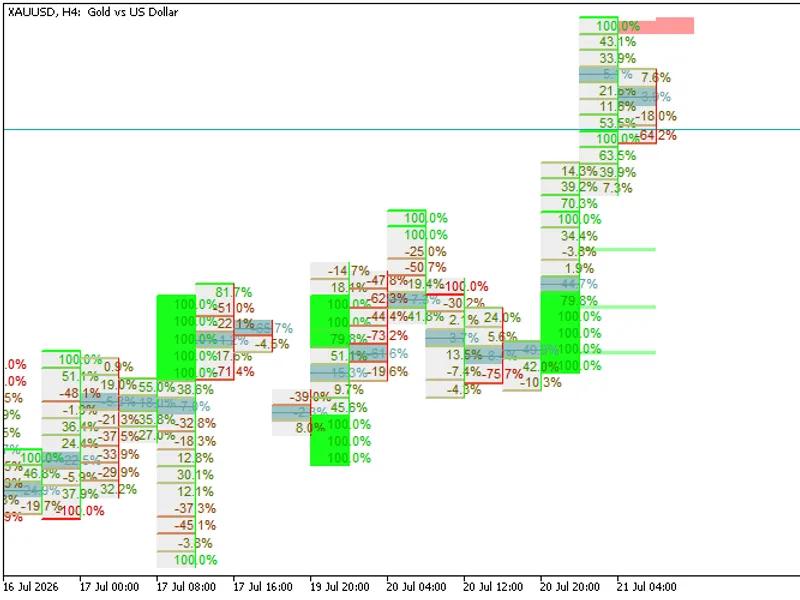
Related: Footprint X Ray: Advanced Order Flow and Volume Delta Analysis - another powerful indicator for MetaTrader 5 traders.
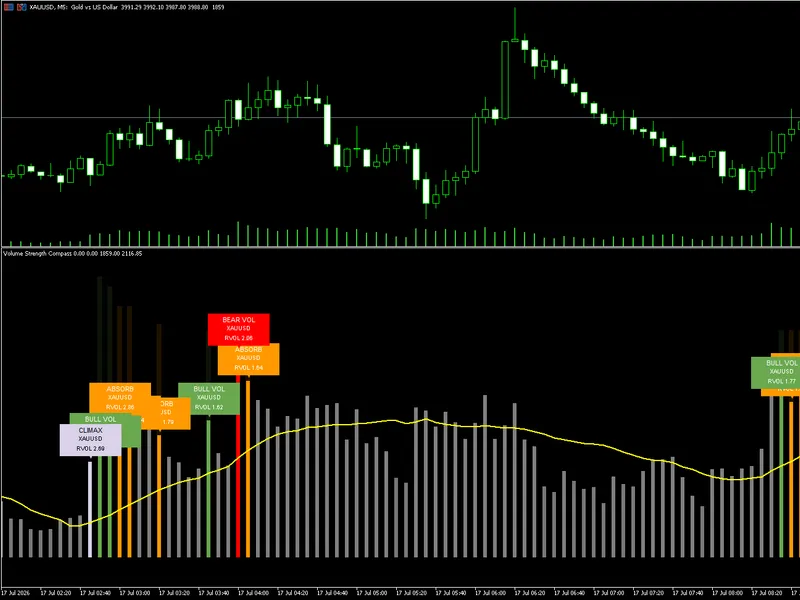
Also recommended: Volume Strength Compass by Bhanu Code Lab - similar indicator with strong performance on MetaTrader 5.
main featuresdynamic volume categorisation
:
the indicator classifies volume into various categories, assigning different colours to facilitate visual interpretation:
buying climax
( clrcrimson ): identifies moments when volume is extremely high and the price is rising.
selling climax
( clrlimegreen ): signals moments of strong selling pressure with high volume.
churn
( clrgold ): detects high volatility without a clear price direction.
climax churn
( clrmagenta ): combines buy/sell climax with churn, indicating extreme volatility.
weak candle
( clrdarkturquoise ): identifies candles with minimal volume in the lookback window.
volume balance
( clrwhitesmoke ): represents standard volume, with no specific characteristics that classify it in other categories. this colour is used as a "base colour" when none of the above patterns are detected.
moving average volume
:
a smoothed moving average line ( clrmaroon ) is displayed to help identify trends in volume over time.
advanced customisation
:
moving average period
: adjust the moving average period to adapt the indicator to your trading style.
lookback window
: set up the lookback window to compare the current volume with recent values.
volume type
: choose between real volume ( volume_real ) or tick volume ( volume_tick ) to suit the characteristics of the asset being analysed.
clear visual interface
:
a coloured histogram ( draw_color_histogram ) displays the volume categories in an intuitive way, allowing for quick and efficient analysis.
flexibility for different timeframes
:
the indicator works on any timeframe, from intraday charts to weekly or monthly charts.
how to interpret the signals
buy/sell climax
: indicates moments of strong accumulation or distribution, suggesting possible trend reversals or continuations.
churn
: signalling high volatility without a clear direction, indicating uncertainty in the market.
weak candles
: shows moments of low activity in the market, often associated with consolidations or periods of indecision.
volume balance
: represents normal market behaviour, without significant anomalies. it is useful for identifying areas of stability.
configuration and use
better volume
is easy to set up and use:
add the indicator to your chart in metatrader 5.
adjust the parameters as necessary:
moving average period
: sets the smoothness of the moving average line.
lookback window
: determines the number of candles used for comparisons.
volume type
: choose between real volume or tick volume.
observe the signals generated by the histogram and the moving average line to make informed decisions.
why use better volume?
volume flow analysis
: better understand the behaviour of market participants based on volume.
pattern identification
: detect buy/sell climaxes, churn and other important patterns that can influence your trading decisions.
ease of use
: the intuitive visual interface and customisation options make the indicator accessible to both beginners and experienced traders.
application example
use the indicator to confirm entry/exit signals in volume-based strategies.
You may also like: institutional harmonic volumetric gravity center indicator - excellent alternative for indicator users on MetaTrader 5.
Source Code
/.......
⚠ Limitations & Risk Warning
- This tool is provided for educational and testing purposes only.
- Past performance does not guarantee future results.
- Trading involves substantial risk of loss. Use on a demo account first.
- Results may vary depending on market conditions, broker, and settings.
- We recommend thorough backtesting and forward testing before using with real funds.