Candle Filter
This tool for MetaTrader 5 is specifically engineered to streamline your trading operations. This technical indicator acts as a specialized analysis tool designed to visualize market data. It helps traders identify emerging trends, momentum shifts, and key support or resistance levels by plotting statistical calculations directly onto price charts.
How to Setup and Use Candle Filter
1. Installation: Place your file in the MQL/Indicators folder via "Open Data Folder" and restart your terminal.
2. Loading: Find the indicator in the Navigator, drag it onto your chart, and configure the input parameters in the popup window.
3. Customization: Press Ctrl+I to open the indicator list, select your tool, and click "Properties" to change colors, levels, or visual styles.
4. Updating: Replace the old file in the Indicators folder with the new version and restart the platform to apply changes.
Frequently Asked Questions
Q: Why is my indicator not showing? A: Verify the file is in the MQL/Indicators folder, or try right-clicking the "Indicators" tree in the Navigator and clicking "Refresh."
Q: Do custom indicators slow down the platform? A: Too many complex indicators can impact performance; remove unused ones via the "Indicator List" (Ctrl+I).
Q: Can I use MT4 indicators on MT5? A: No, MQL4 and MQL5 are distinct languages; ensure the indicator is compiled specifically for your platform version.
Description & Settings
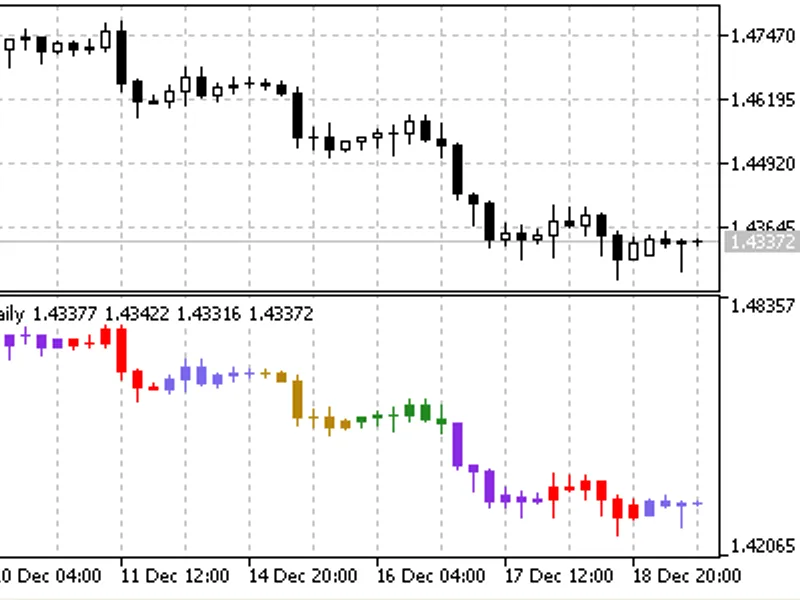
The indicator allows you to display only those candles that meet a certain criterion:
Bullish: Displays only bullish candles.
Bearish: Displays only bearish candles.
Doji: Displays only Doji candles.
All: Displays all candles with their respective colours. Doji candle detection:
The detection of Doji candles is based on a configurable threshold (`InpDojiThreshold`), which defines the ratio between the body of the candle and its total range. This guarantees accuracy in identifying neutral candles.
Candle filtering: Colour customisation:
The trader can define custom colours for each type of candle:
- Bullish: Default colour is green (`clrForestGreen`). - Bearish: Default colour is dark red (`clrDarkRed`). - Doji: Default colour is gold (`clrGold`). - Bottom: Default colour is black (`clrBlack`).
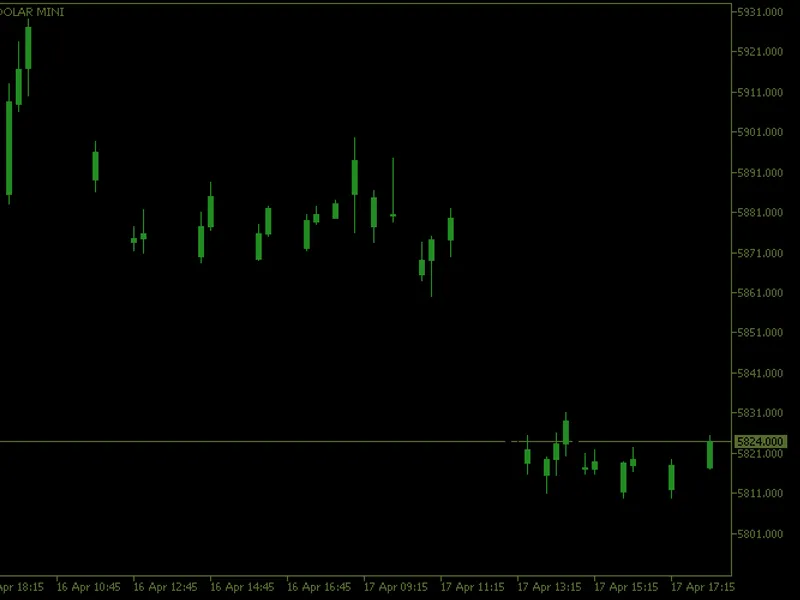
Chart cleaning:
The indicator removes unnecessary visual elements from the chart, such as grids, volumes and period separators, to facilitate visual analysis.
How it works:
1. initialisation (`OnInit`):
Buffers are mapped to store OHLC values (open, high, low, close) and the corresponding colours. Custom colours are assigned to the indicator's colour indices. The chart is cleaned up by removing unnecessary visual elements.
2. Main Calculation (`OnCalculate`)
For each candle on the chart, the indicator checks whether it meets the selected criterion (`InpCandleShow`). Candles that do not meet the criterion are displayed in background colour (`InpBackgroundColor`). Candles that meet the criterion are displayed with custom colours.
3. Deinitialisation (`OnDeinit`):
When the indicator is removed, the original chart settings are restored, ensuring that the trading environment returns to its initial state.
Usage examples:
Trend Analysis: Set `InpCandleShow` to `ShowBullish` or `ShowBearish` to focus only on candles that indicate an uptrend or downtrend.
Identifying Neutral Zones:
Use `ShowDoji` to highlight neutral candles and identify possible reversal or consolidation points.
Full Visualisation: Choose `ShowAllCandle` to display all candles with their respective colours, allowing an overview of market behaviour. Improvements Implemented:
Accurate Doji Detection: The use of a configurable threshold (`InpDojiThreshold`) ensures that only truly neutral candles are classified as Doji.
Full Customisation: The trader has complete control over the colours and background of the chart.
Automatic Cleaning: The indicator automatically removes unnecessary visual elements, improving the readability of the chart.