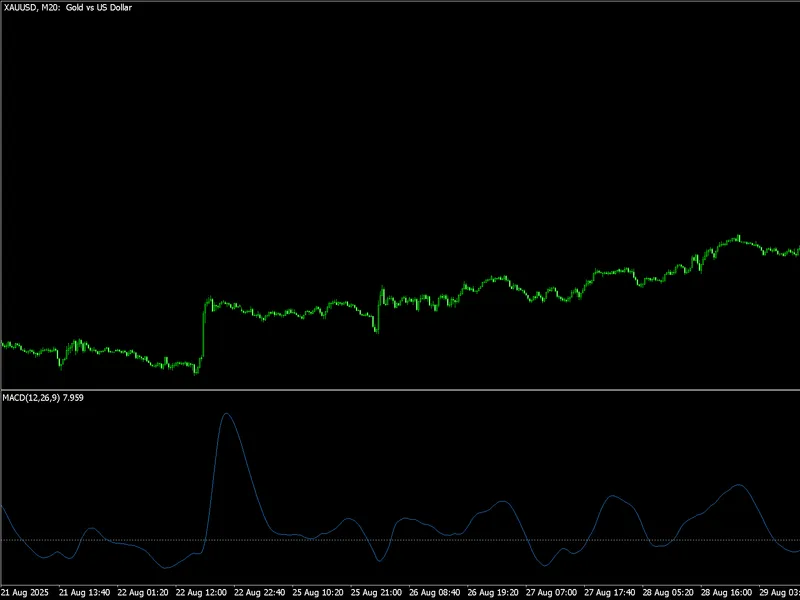
the signal line of the macd (moving average convergence/divergence) indicator is often used as a momentum filter in auto trading algorithms.enable buy logic only when the signal li...
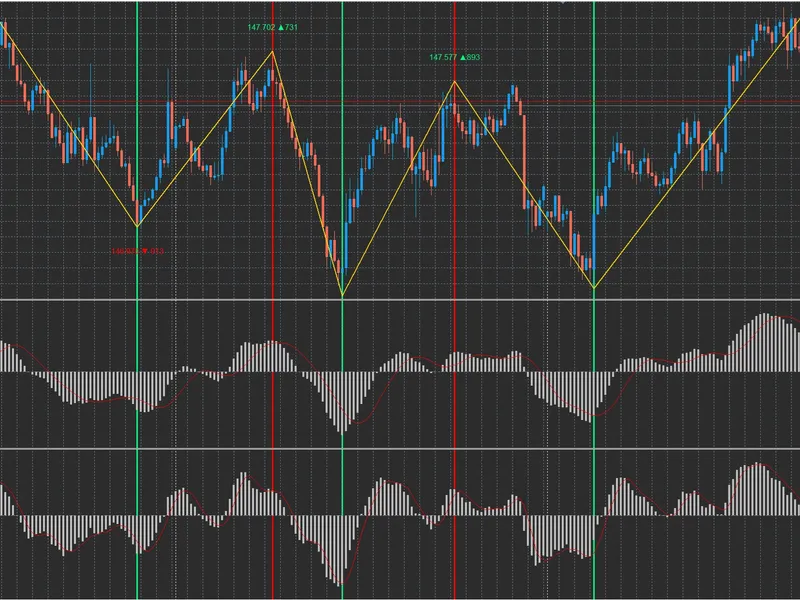
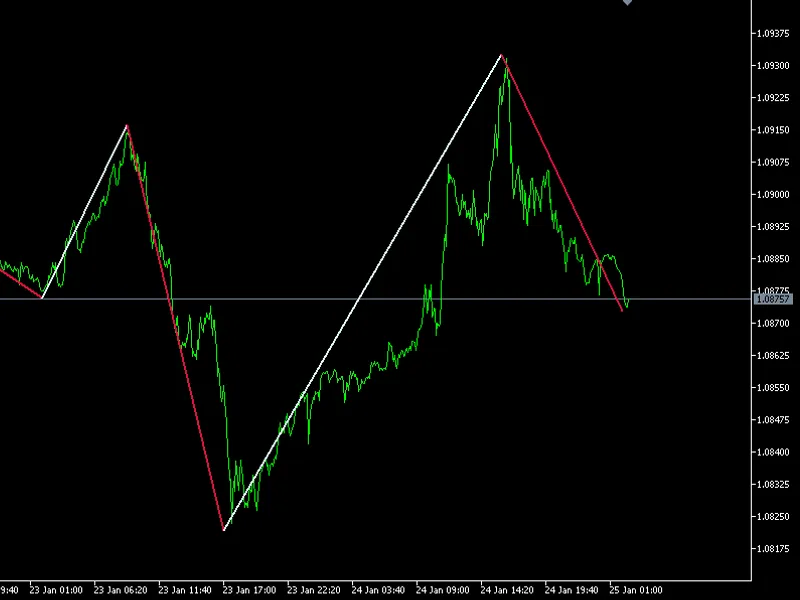
purpose this is not just a regular zigzag. it has been designed as aprecise visual reference toolto helpbalanceor analyzeother indicators, whether on the main chart or in sub-windo...
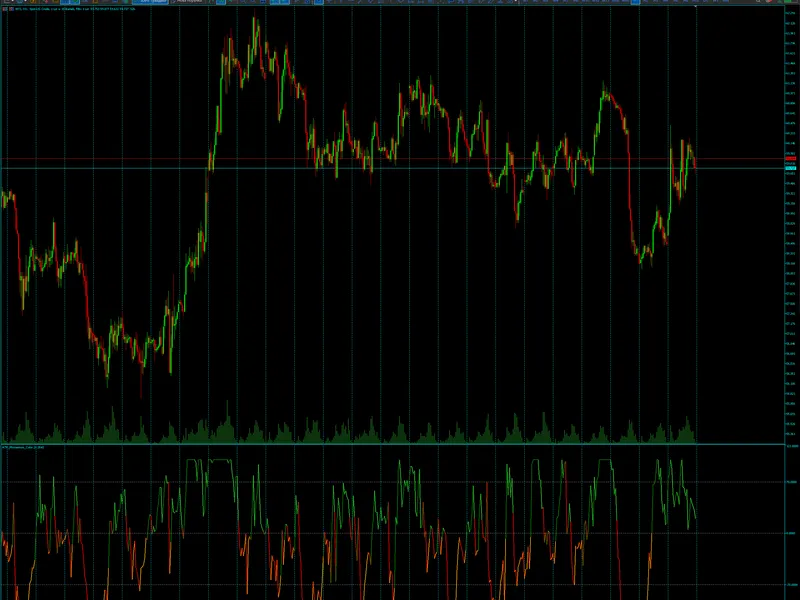
arsi calculation & usage: subtract 50 from rsi → take absolute value → divide by 100 or 50 (setting: divide rsi value by) → gives arsi(percentage-like). bands adjustment:lower...
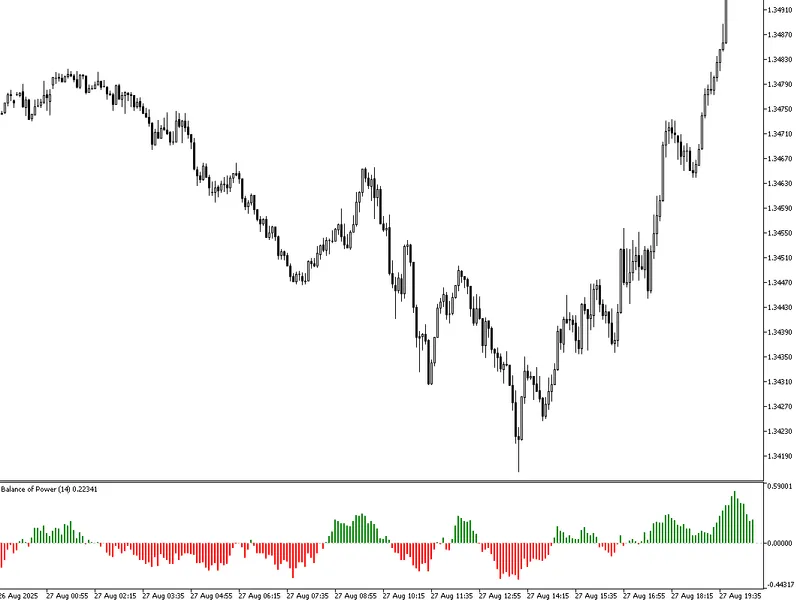
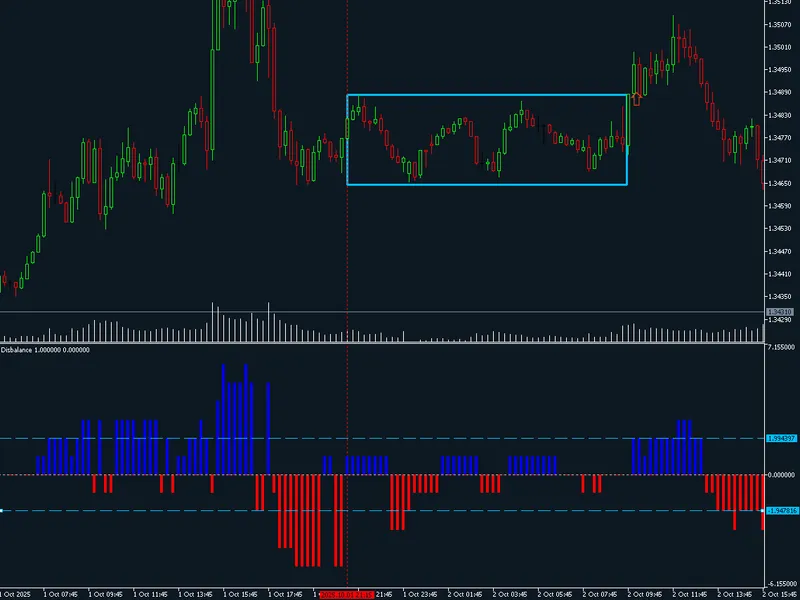
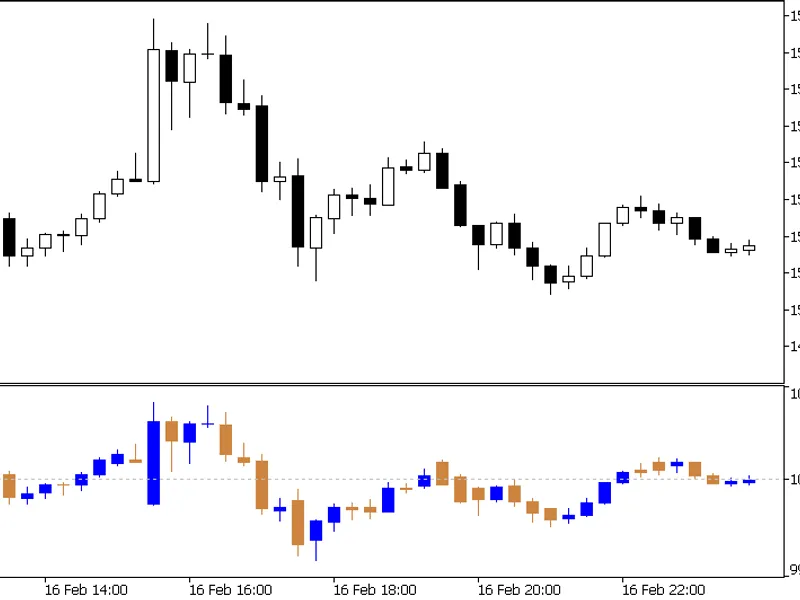
this indicator visually shows who is in control of the market:buyers (bulls), when the close is close to the high; sellers (bears), when the close is close to the low.the basis of...
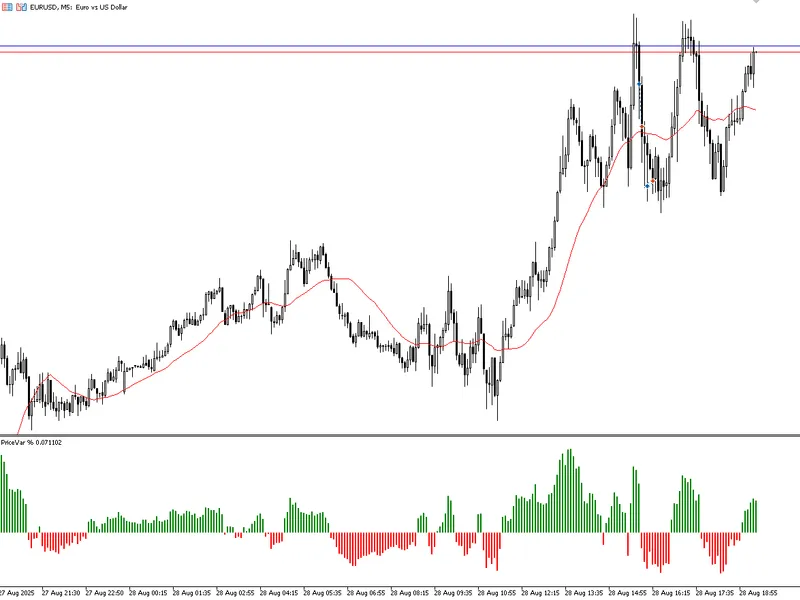
pricevar%is an indicator designed to measure the percentage difference between the price and a moving average, highlighting the strength of the market movement in relation to a ref...
features: customizable rsi levels (default: 75 for overbought, 25 for oversold) multi-timeframe support (m1 to mn1) dual alert system: pop-up alerts and push notifications to mt5 ...
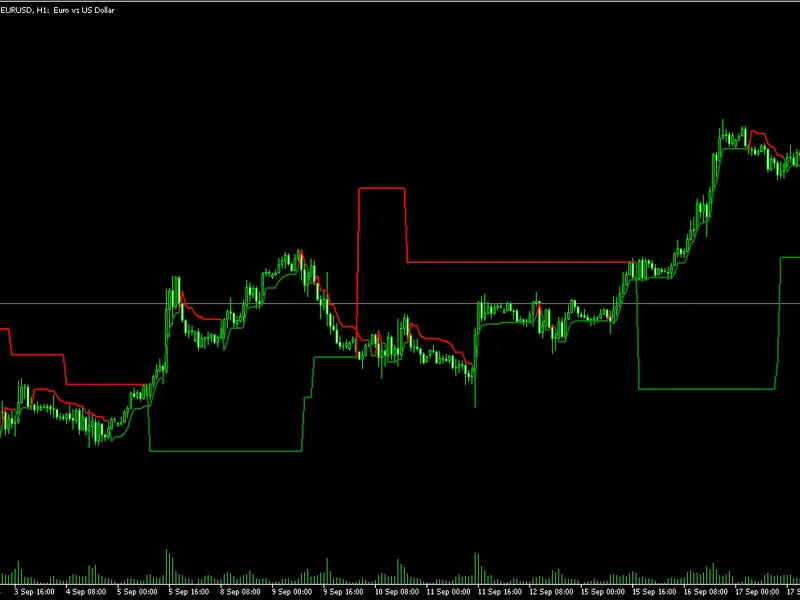
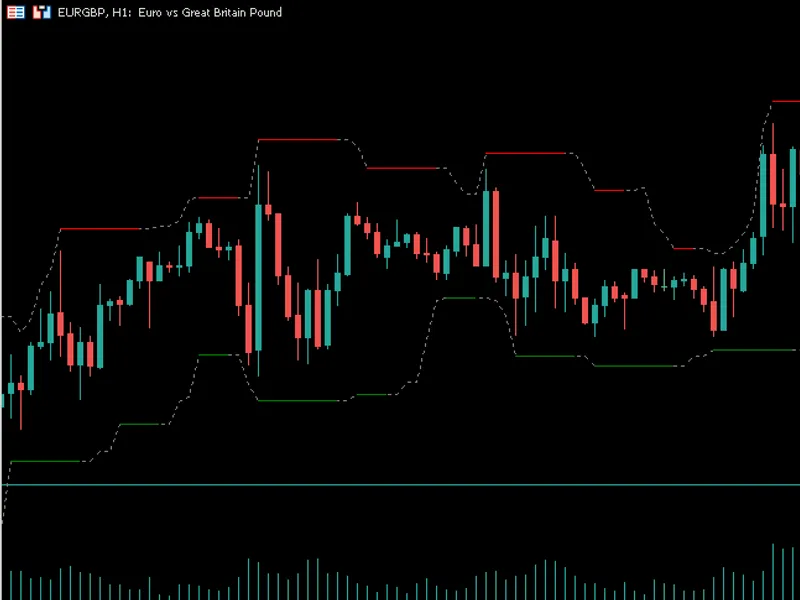
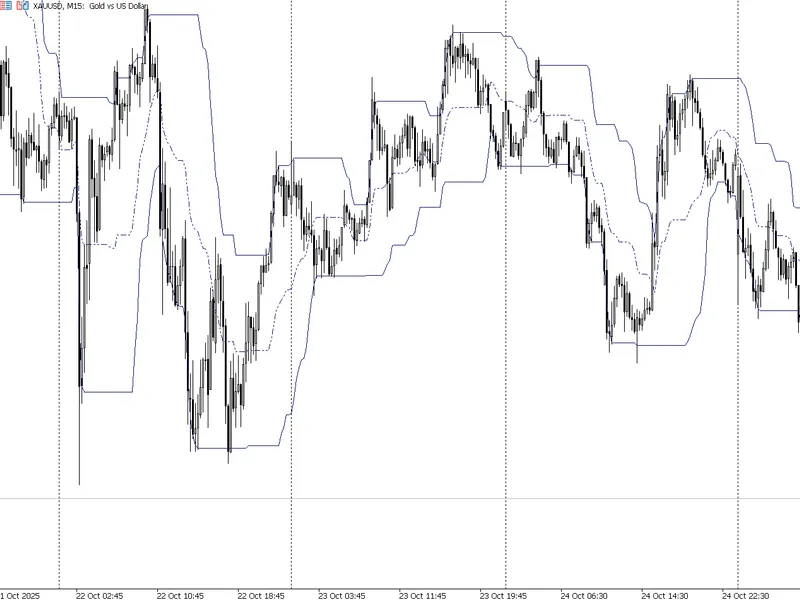
this is an experimental indicator i made which is similar to the donchian channel, but it is volatility-aware. the lines reflect extreme highs and lows offset by the atr value at t...
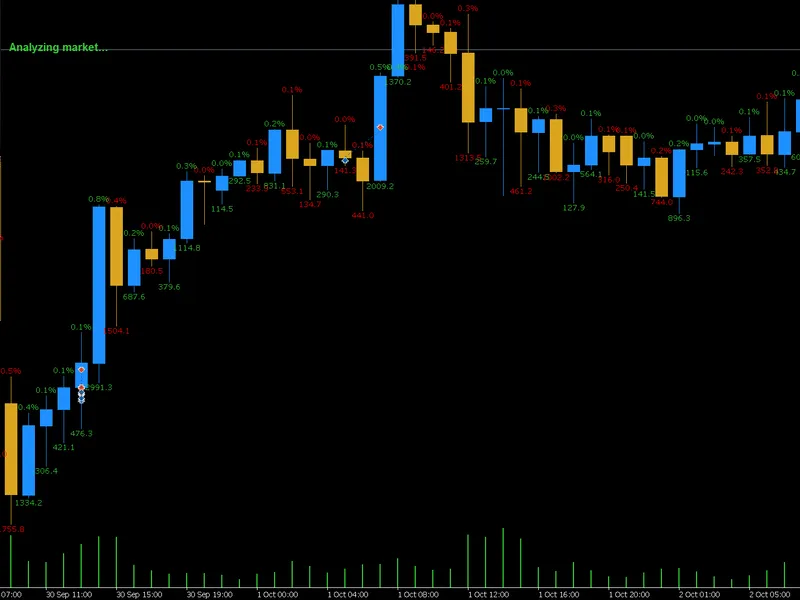
key features: dual display:automatically calculates and shows price changes in both pips(below the candle) and percentage(above the candle). two measurement modes: close-to-close ...
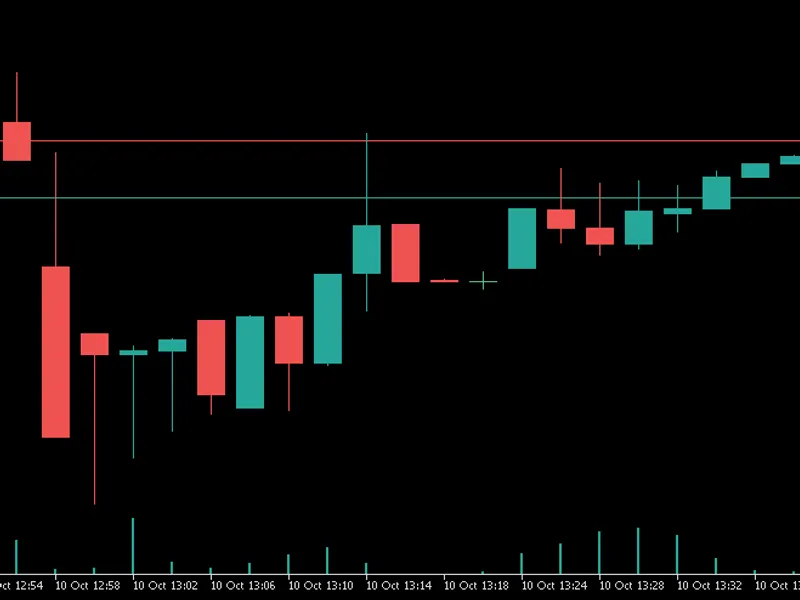
this is a candlestick chart which connects the high of the candle to the ask price if it is currently higher than the current high. the bid price is argued to always be the same as...
this is another ohlc candlestick chart which finds the highest ask price and lowest bid price on each bar. it uses the high price of the candle to record the highest ask price in t...
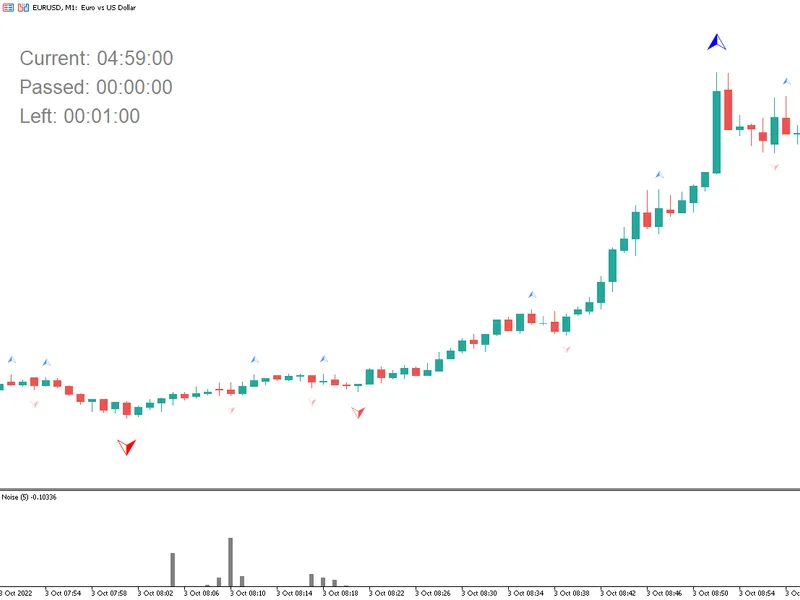
two types of display mode have been added for easy perception: as a comment in the upper left corner of the graph, or as a graphical object.features: font selection font size. you...
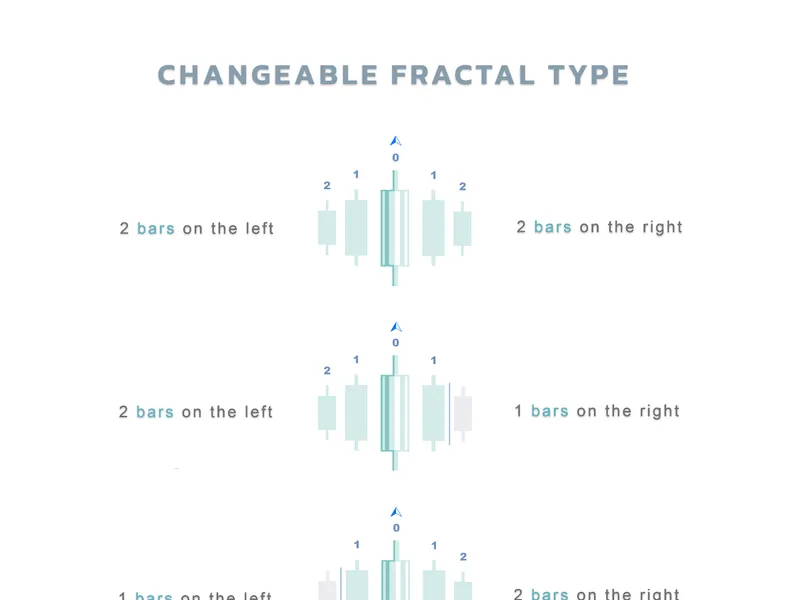
in this fractal indicator you can set an arbitrary number of bars both to the left and to the right of the centre bar to allow you to build different types of fractals....
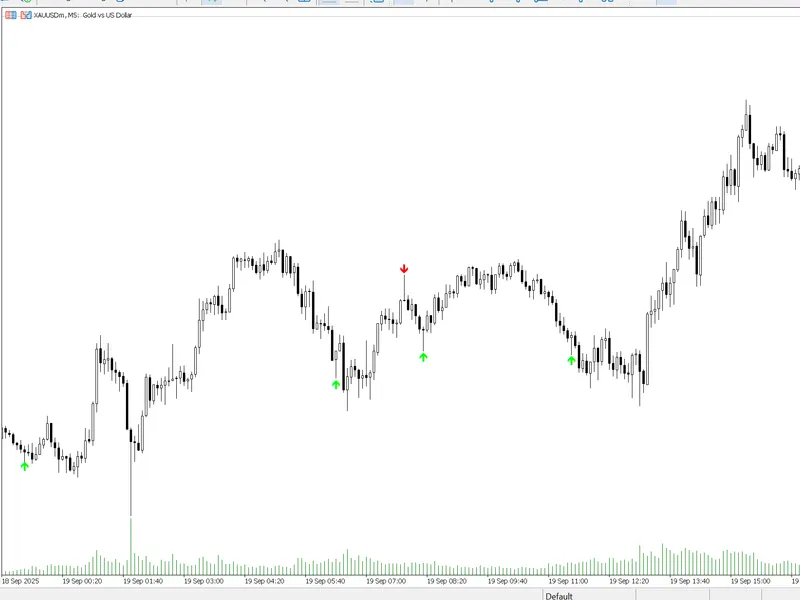
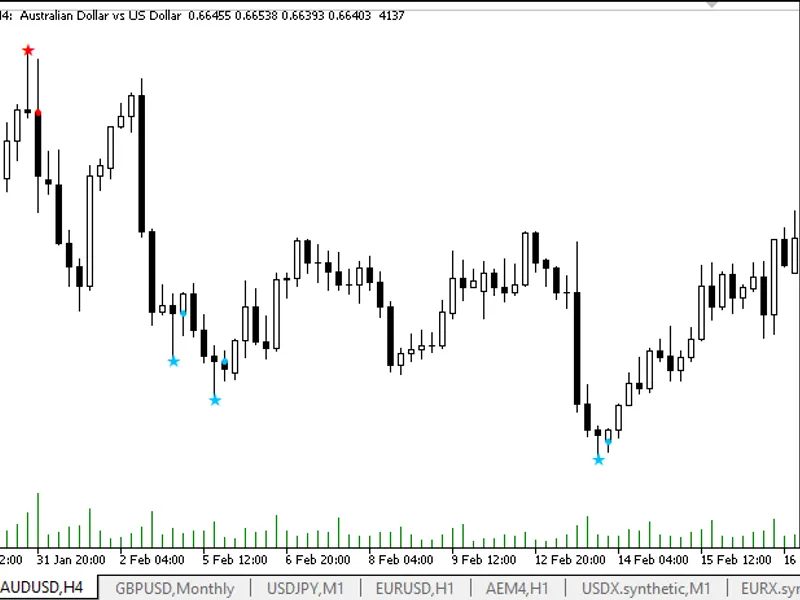
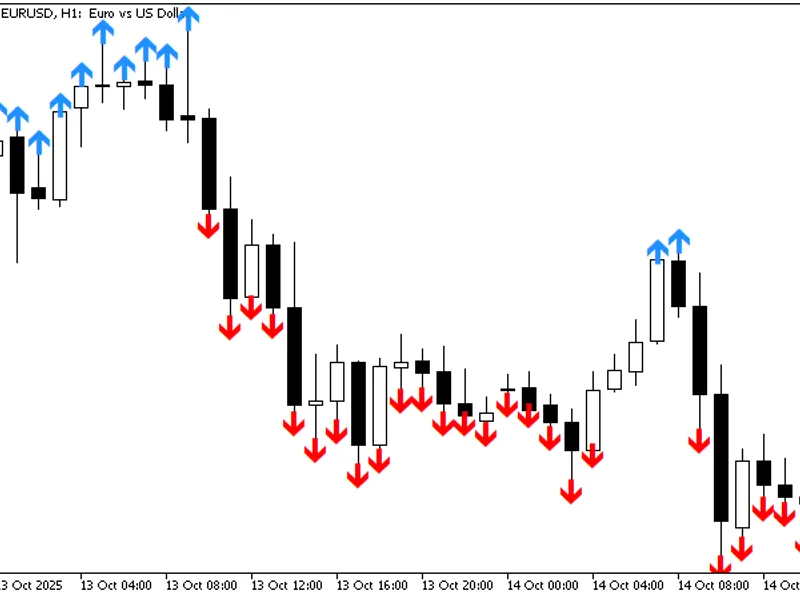
a pin bar is a candlestick with a small body and a long shadow, which often indicates a possible price reversal. the indicator searches the chart for price action pin bar patterns ...
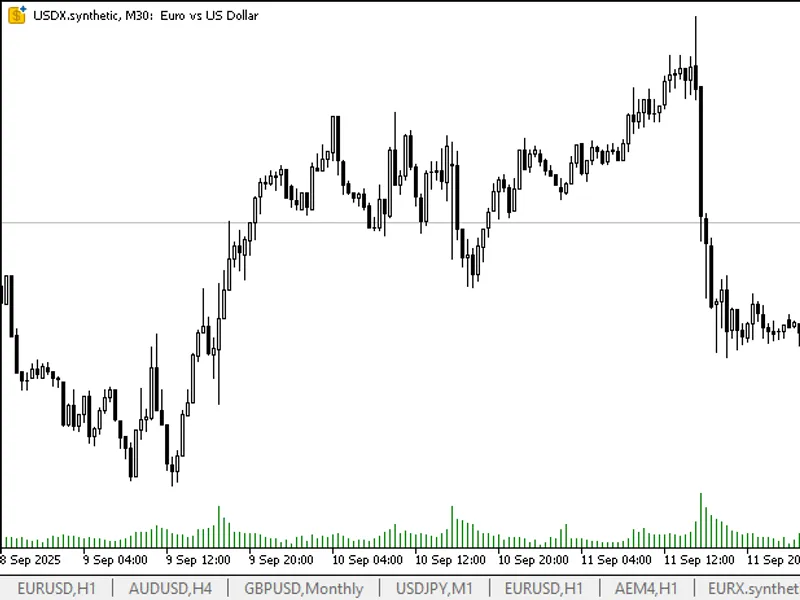
theus dollar index (usdx, dxy)is a measure of the value of the us dollar relative to a basket of six major world currencies. it is calculated as a weighted geometric mean of the do...
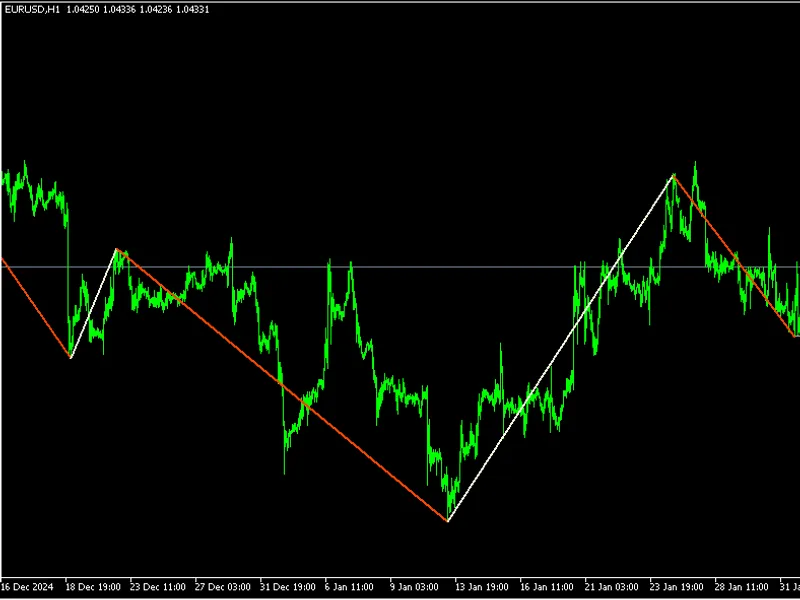
this is simply the classic repaint zigzag but with a timeframe input so that you can view the higher timeframe zigzag on a lower timeframe chart. nothing more nothing less.edit:v1....
this indicator calculate count of one direction movement in selected period. that a bit similar to renko charts, but also include both direction movement into account. the indicato...
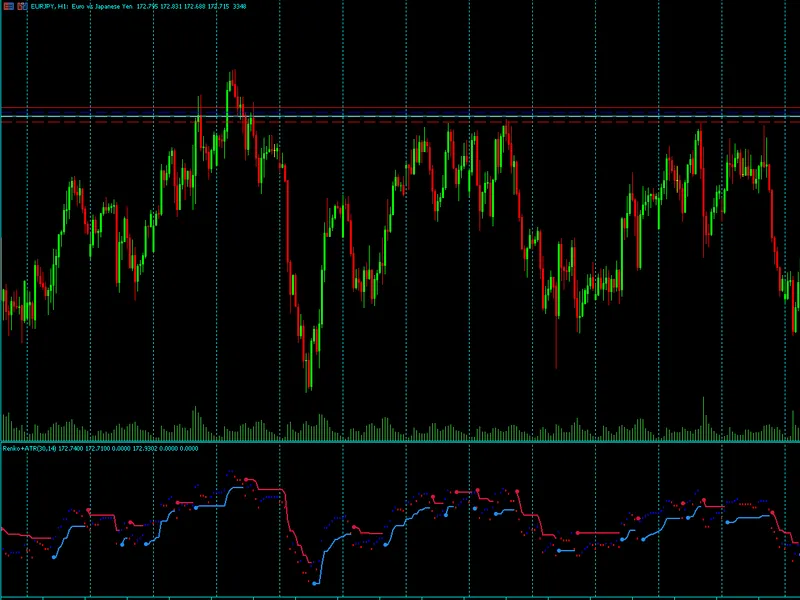
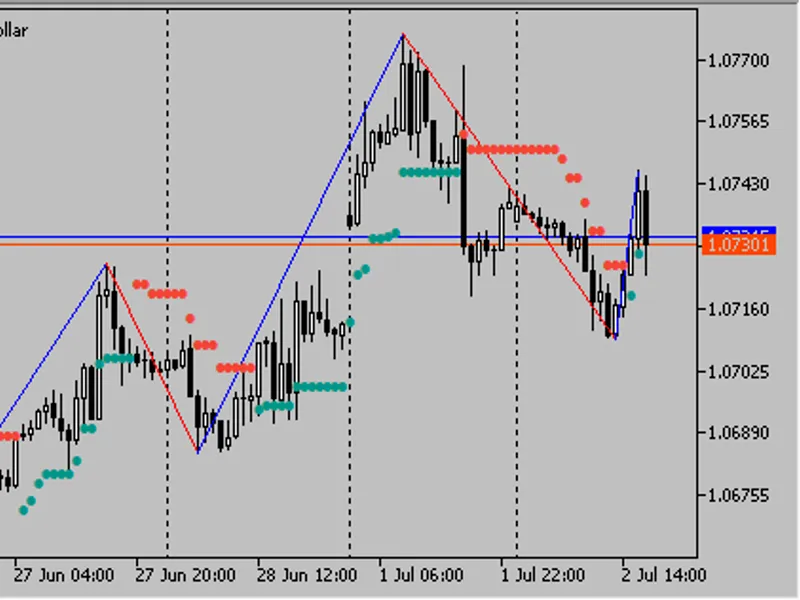
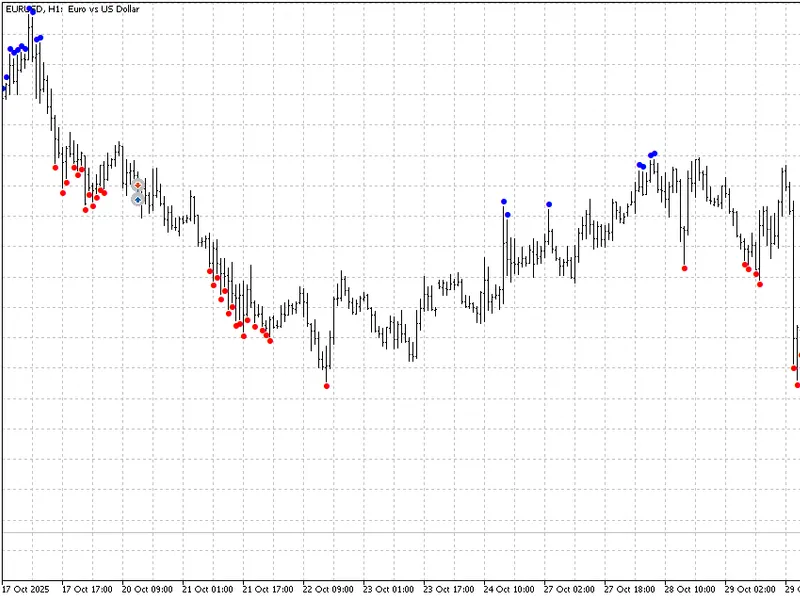
i liked the indicator, so i made zigzag based on it.the display of points from volatility stop can be disabled in the indicator settings.the indicator is recalculated at the openin...
1. definition:the macd histogram (macd-h) is the bar chart component of the macd indicator, representing the differencebetween the macd line and the signal line. formula: macd hist...
bollinger bands squeeze - the calm before the stormthe bollinger bands squeeze is one of the most powerful and sought-after signals when using the bollinger bands indicator. it sig...
good morning.if this code malfunctions for whatever reasons, forgetting or mql5 upgrades, let me know so i can correct it, thank youyou can find all my multi timeframe indicator co...
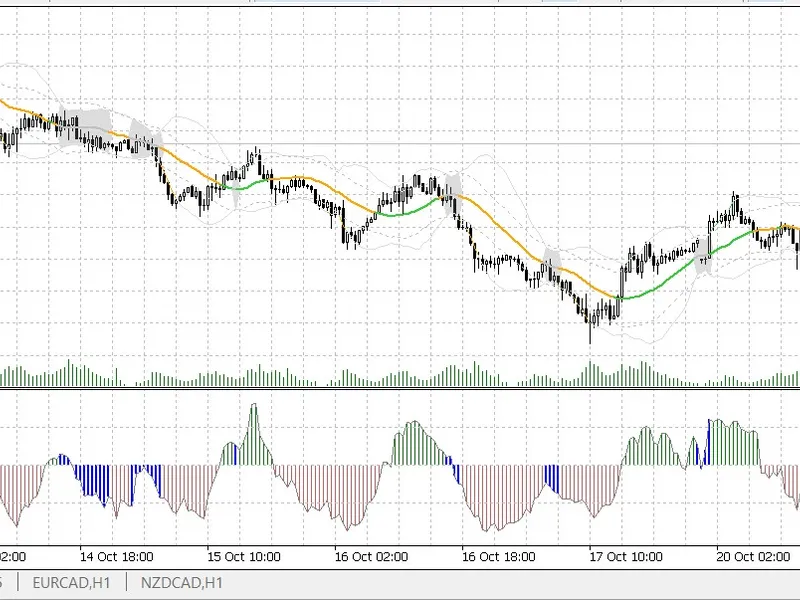
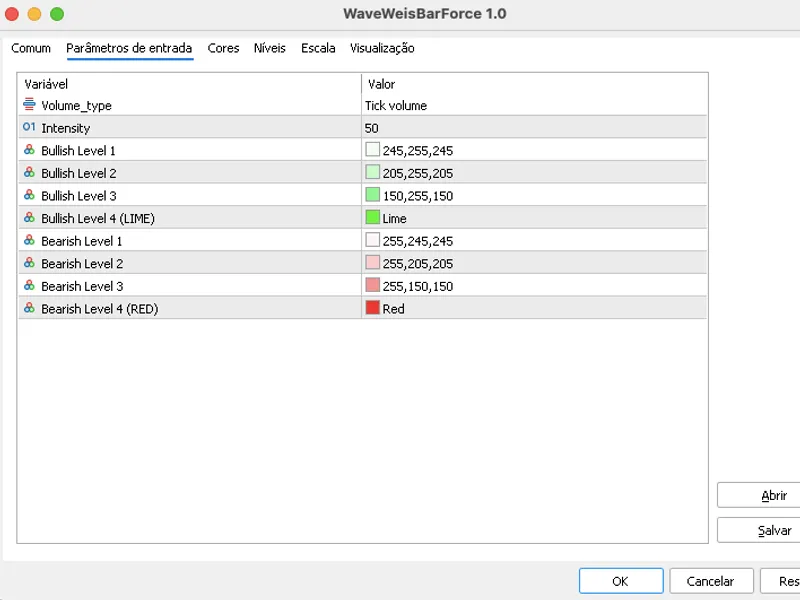
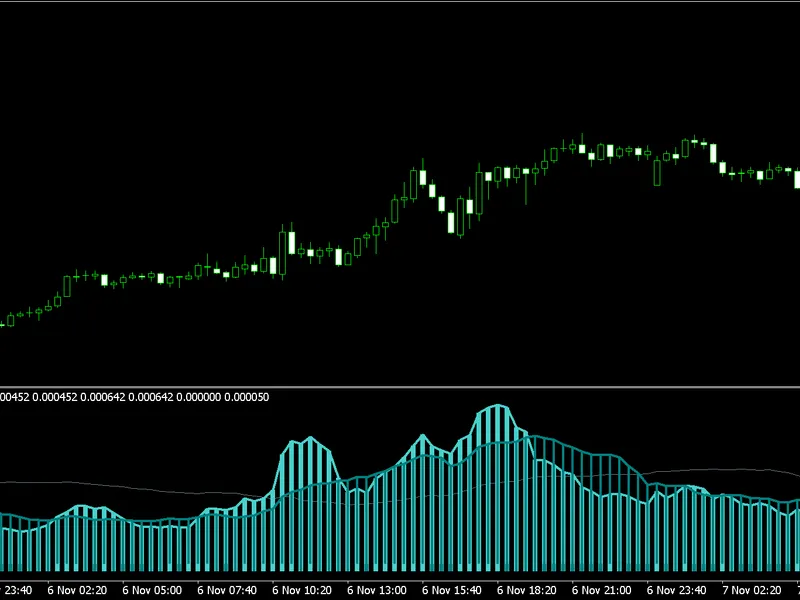
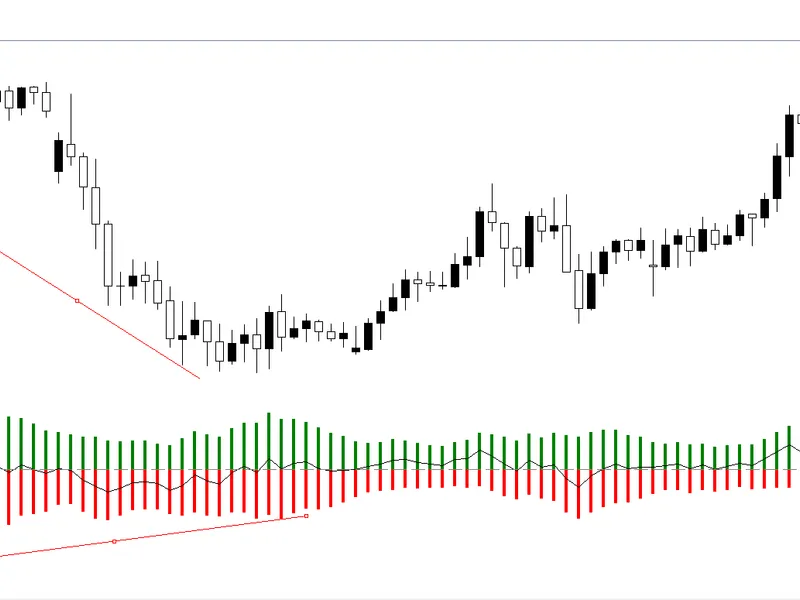
waveweisbarforce - accumulated wave volume (weis) waveweisbarforceis an indicator that applies the logic of volume waves (weis) to identify accumulations and changes in market dire...
a simple and effective signal indicator for metatrader 5. this indicator combines two classic tools, the rsi and a moving average (ma), to identify trend-following signals. it is d...
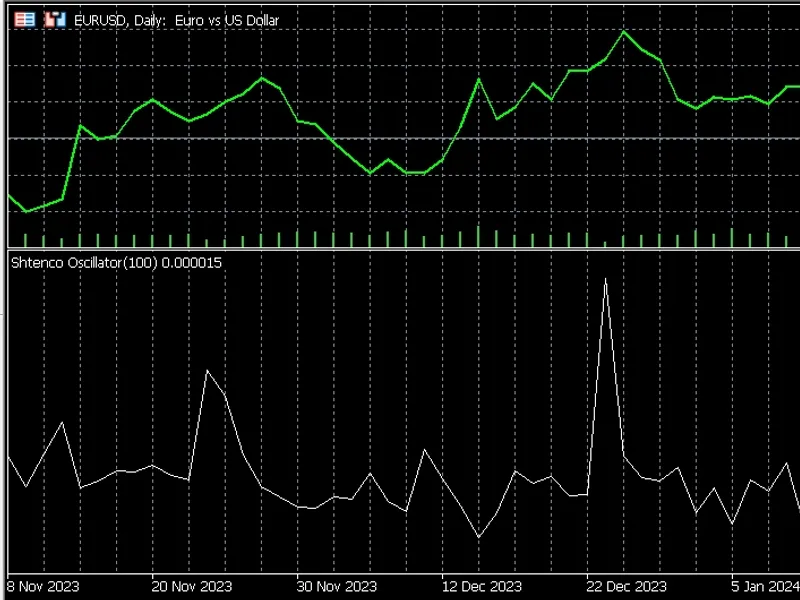
the idea is simple - and it is one variation of dividing price by volume. a simple moving average is taken as the price. i have not found any serious value of the sign for forecast...
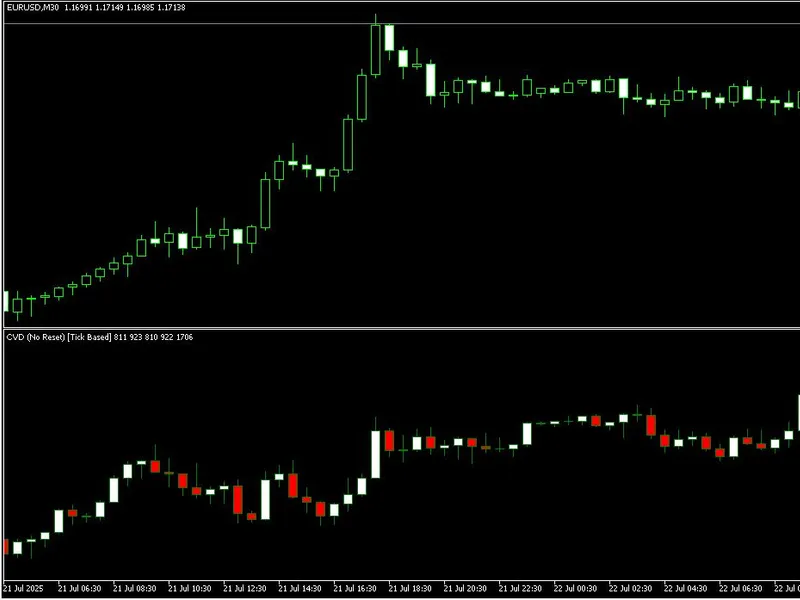
lightweight, open-source cvd indicator for metatrader 5. it visualizes net buying vs selling pressure as cvd candles in a separate window — a simple start for volume and order flow...
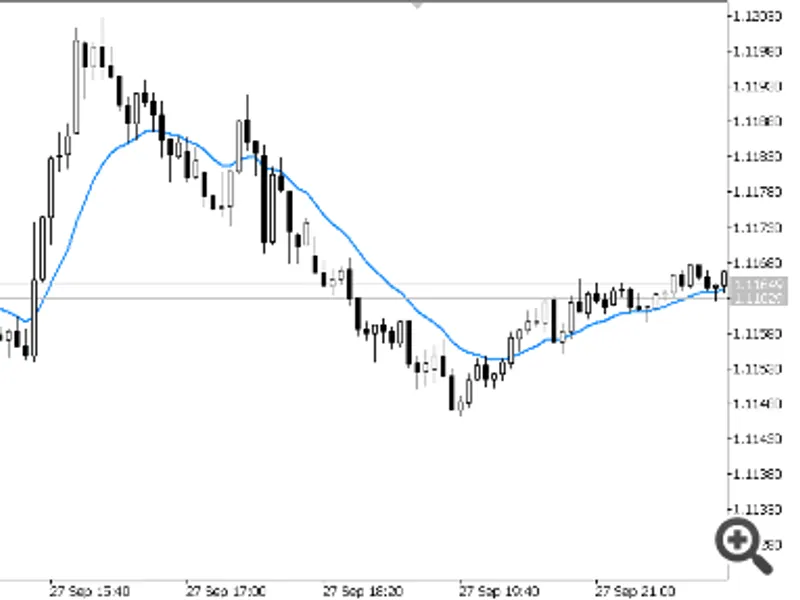
this free custom indicator calculates and displays the exponential moving average (ema) directly on the metatrader 5 chart. the ema is one of the most widely used technical tools f...
in this zigzag, a new swing point is confirmed when price moves beyond the volatility threshold. the volatility is defined as current standard deviation × multiplier. instead of sc...
this indicator is a volatility filter based on:a fast atr (average true range), a middle atr, and a slow atr. the indicator does notpredict directional bias of price.the indicator ...
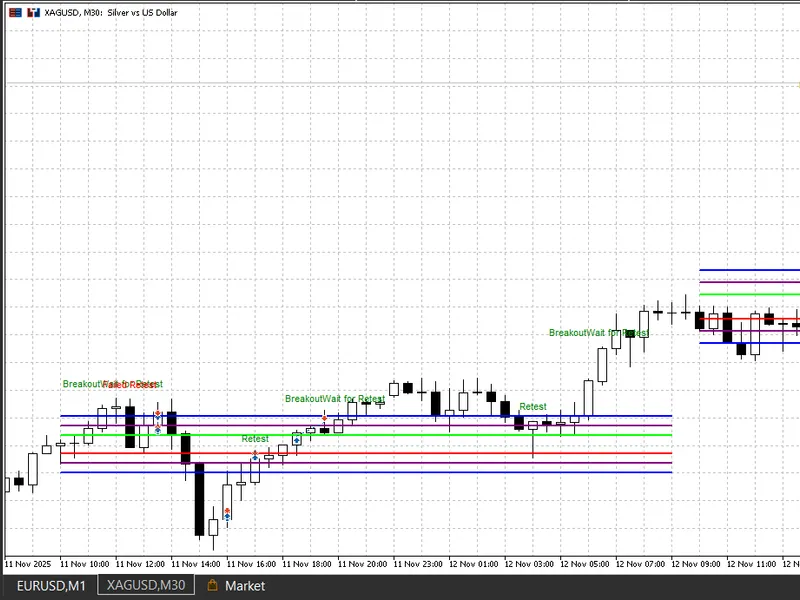
open range breakout indicator for metatrader 5 overview the open range breakout (orb) indicator is a powerful technical analysis tool that identifies and tracks price breakouts fro...
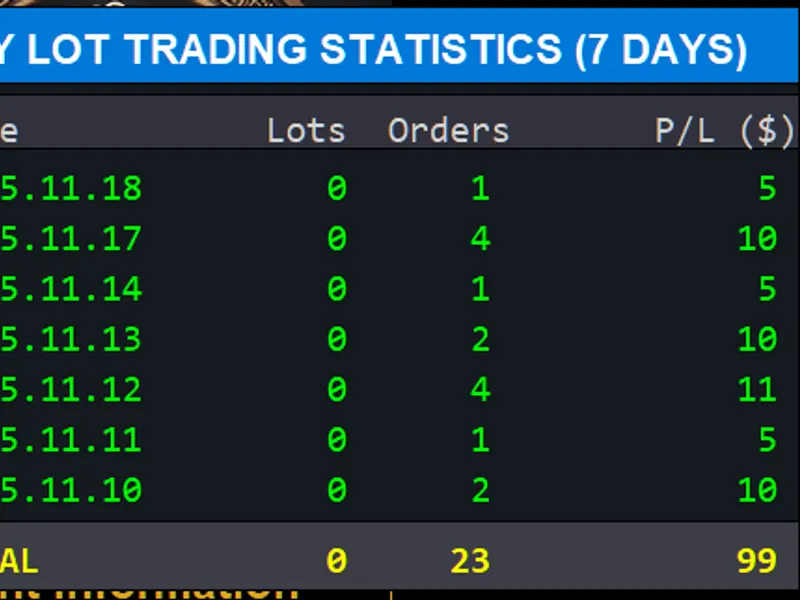
key features daily breakdown: view statistics for the last 7 days (customizable) all-time summary: see total statistics across your entire trading history real-time updates: autom...
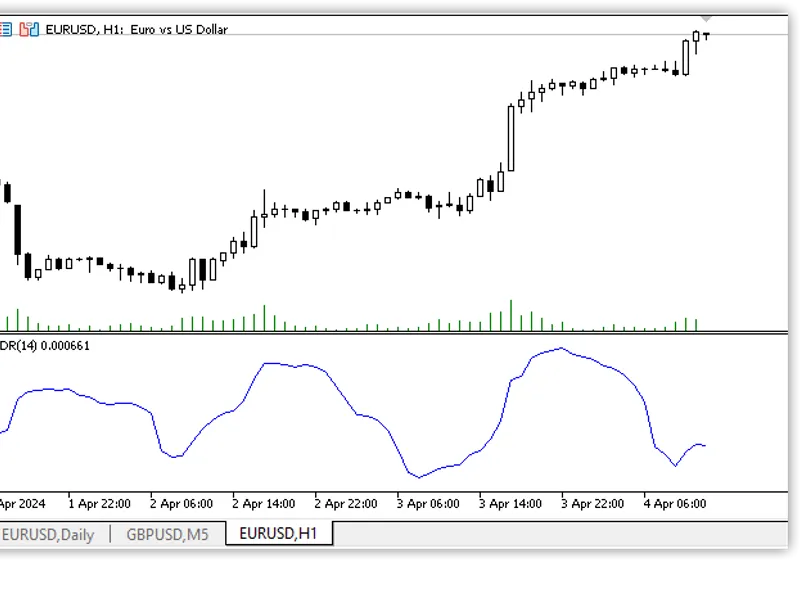
average daily range is an indicator that measures the volatility of an asset. it shows the average price movement between the maximum and minimum over the last few days.to calculat...
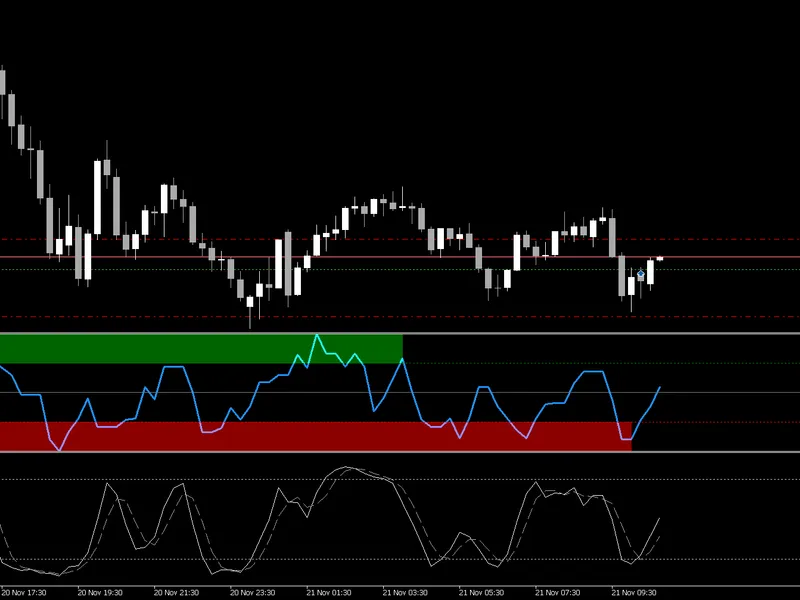
multi-timeframe confluence oscillator combining stochastic, rsi and macd across 3 timeframes. used to identify trend entries when all indicators align (score >50 bullish, <-5...
the simplest indicator showing on the current symbol the price change in % since the opening of the trading session. if the current price has gone up relative to the opening price ...
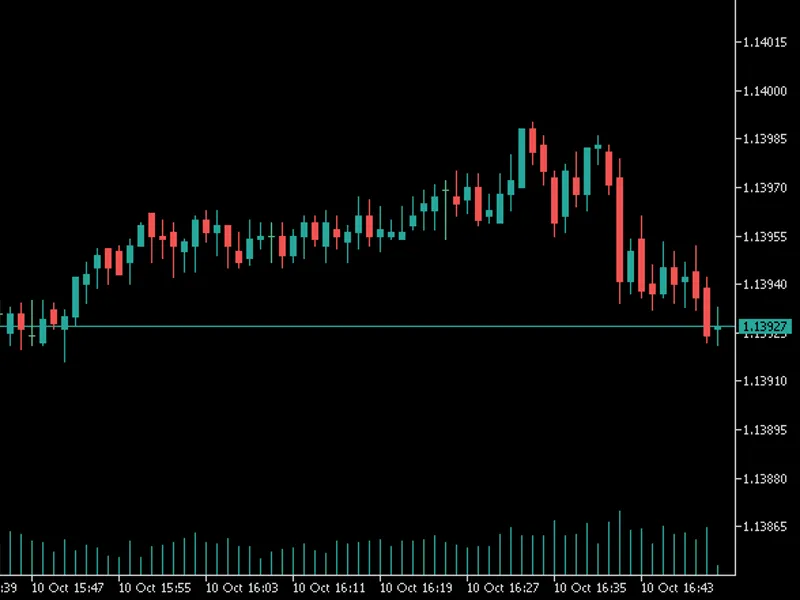
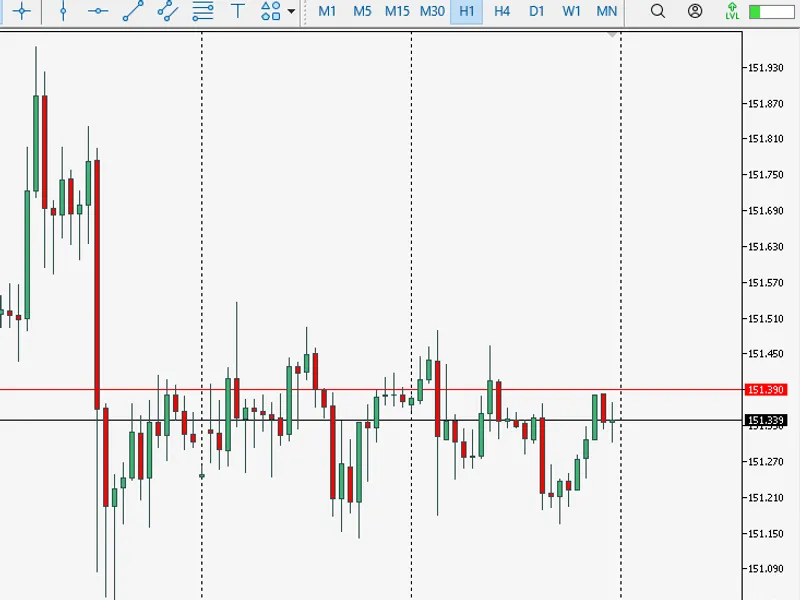
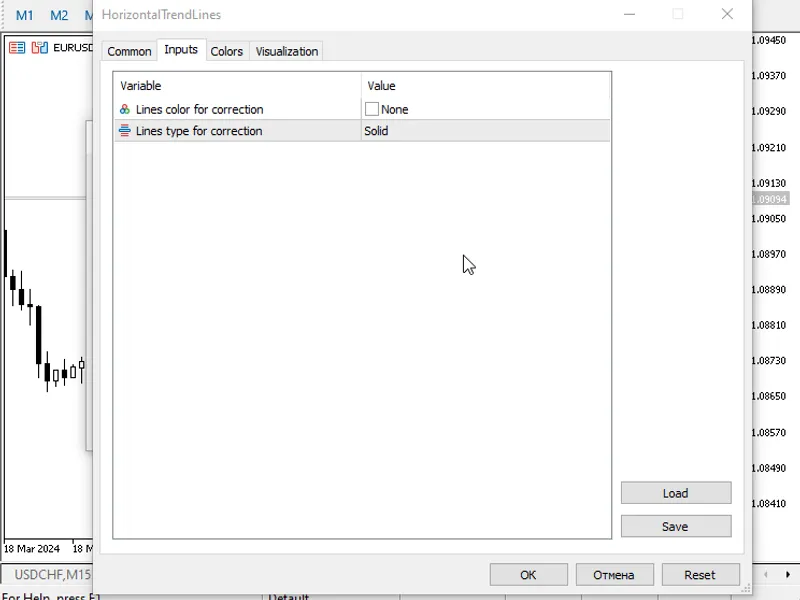
the indicator brings the specified (by colour and style) "trend line" objects to horizontal by changing the price coordinate of the second reference point of the trend line (by def...
a simple and effective signal indicator for metatrader 5.this indicator combines two classic tools, rsi and moving average (ma), to identify trend following signals. it is designed...
brief description of "dynamic gaussian channel" indicator purpose the indicator builds dynamic support and resistance levels based on smoothed price data using gaussian filter.key ...
a fun implementation of the tillson t3. the distinctive feature of this implementation is that it computes 6 emas under the hood, but does not use any auxiliary indicator buffers f...
the main task of this indicator is to estimate the probability that the high price has reached its maximum, or the minimum for the low price.first, the indicator collects statistic...
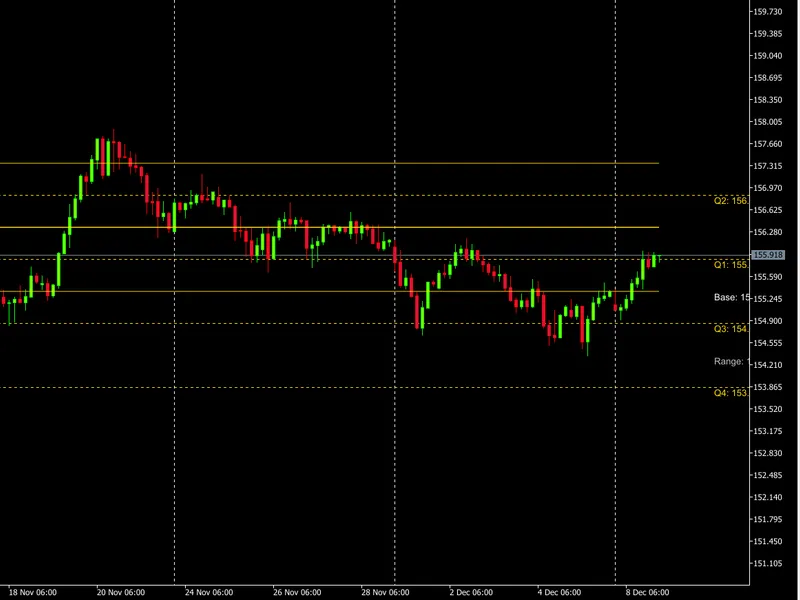
this indicator implements the "quarters theory" - a technical analysis concept that divides price movement into four quarters around a central base level. it's designed to work wit...
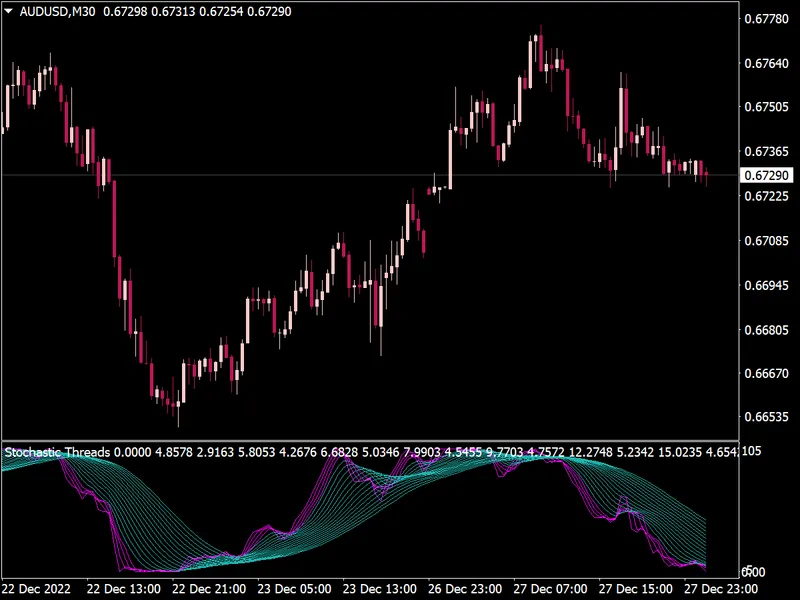
based on the stochastic momentum indicator according to william blau by andrey f. zelinsky , i came up with the idea of not only showing the closing price but also finding out more...
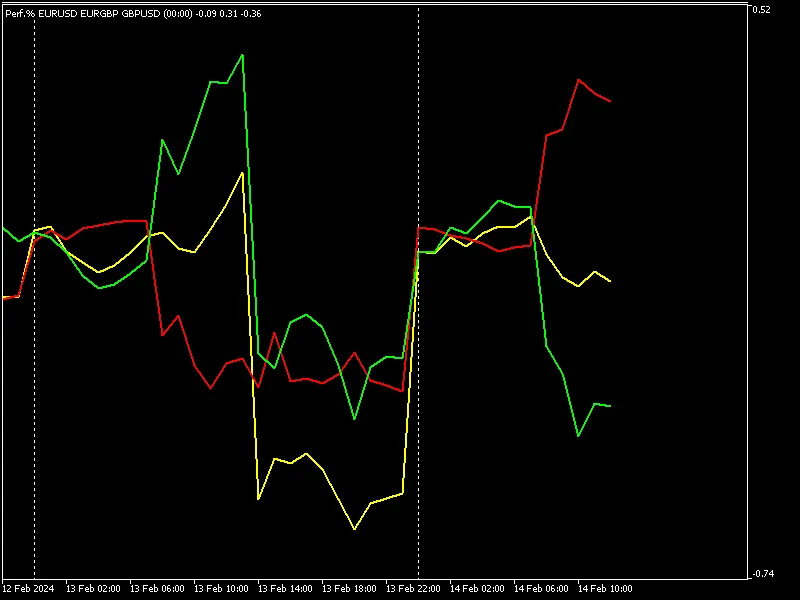
input string pair1="eurusd";//cross 1input string pair2="eurgbp";//cross 2input string pair3="gbpusd";//cross 3input int bars=5000;input string tm="00:00";// start time in the form...
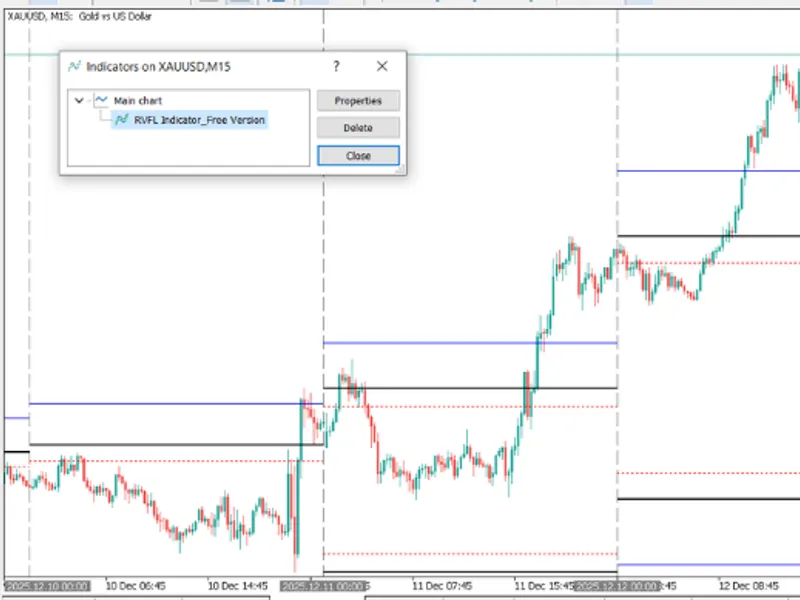
range vector fibo logic (indicator) — one candle strategyidea of the indicator, stop waking up at 3 am to draw lines manually. this is the professional visual tool for the popular ...
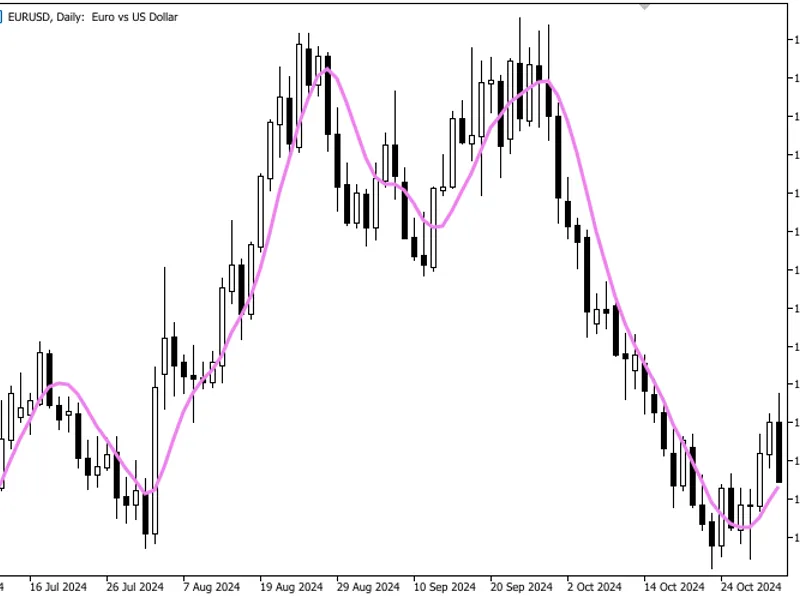
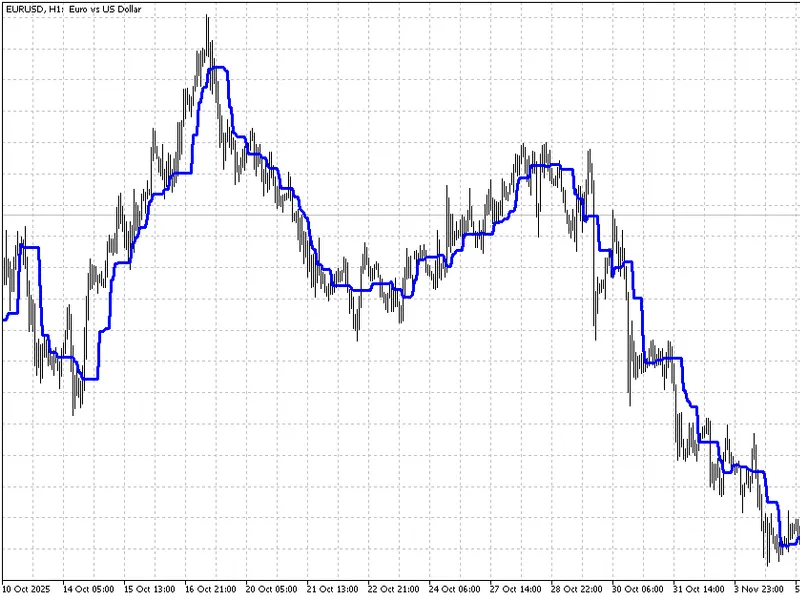
this indicator implements the nonlinear smoothing algorithm of hilo type. its main difference from the classical algorithm is that it processes extrema of the initial time series. ...