Price Var
This is a powerful addition to your MetaTrader 5 toolkit designed to optimize market analysis and performance. This technical indicator acts as a specialized analysis tool designed to visualize market data. It helps traders identify emerging trends, momentum shifts, and key support or resistance levels by plotting statistical calculations directly onto price charts.
How to Setup and Use Price Var
1. Installation: Place your file in the MQL/Indicators folder via "Open Data Folder" and restart your terminal.
2. Loading: Find the indicator in the Navigator, drag it onto your chart, and configure the input parameters in the popup window.
3. Customization: Press Ctrl+I to open the indicator list, select your tool, and click "Properties" to change colors, levels, or visual styles.
4. Updating: Replace the old file in the Indicators folder with the new version and restart the platform to apply changes.
Frequently Asked Questions
Q: Why is my indicator not showing? A: Verify the file is in the MQL/Indicators folder, or try right-clicking the "Indicators" tree in the Navigator and clicking "Refresh."
Q: Do custom indicators slow down the platform? A: Too many complex indicators can impact performance; remove unused ones via the "Indicator List" (Ctrl+I).
Q: Can I use MT4 indicators on MT5? A: No, MQL4 and MQL5 are distinct languages; ensure the indicator is compiled specifically for your platform version.
Description & Settings
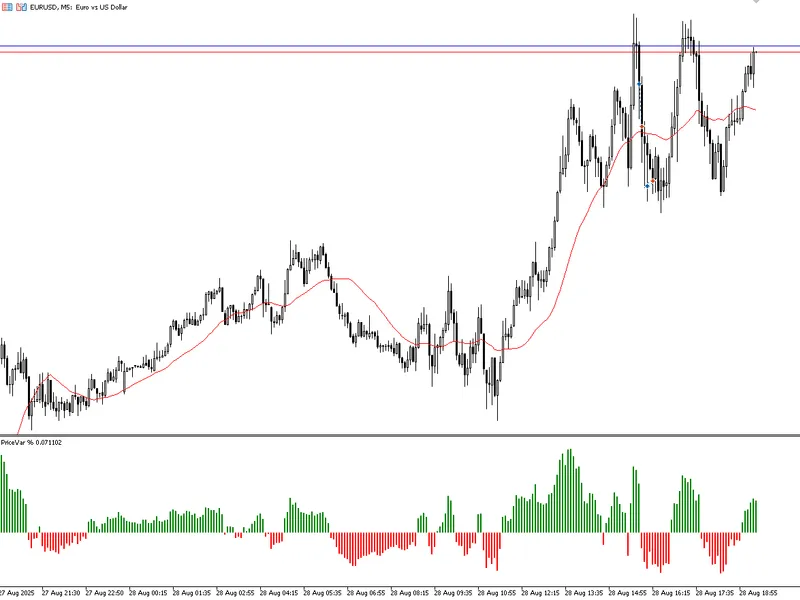
PriceVar%
is an indicator designed to measure the
percentage difference between the price and a moving average
, highlighting the strength of the market movement in relation to a reference value.
How it works
If the
closing price is above the average
, the calculation is:
Var = (High - MA) / MA * 100
;
If the
closing price is below the average
, the calculation is:
The result is displayed as a
percentage histogram (%):
Green
→ when the price is above average (buying force).
Red
→ when the price is below average (selling force).
Interpretation
Positive
values indicate the distance of the
high from the average
.
Negative
values indicate the distance of the
low from the average
.
The higher the absolute value, the greater the percentage distance of the price from the average.
Practical applications
Identifying
moments of overbought/oversold relative to the average
.
Measuring
percentage volatility
around the average.
Aid in
breakout or reversal
strategies by validating the intensity of the movement.
Use as a
filter in automated systems
(e.g. only trade when the percentage change exceeds a certain threshold).
Parameters
Average period (iPeriod):
defines the horizon of the moving average used as a reference.