Aklamavo Quarters Theory
This is a powerful addition to your MetaTrader 5 toolkit designed to optimize market analysis and performance. This technical indicator acts as a specialized analysis tool designed to visualize market data. It helps traders identify emerging trends, momentum shifts, and key support or resistance levels by plotting statistical calculations directly onto price charts.
How to Setup and Use Aklamavo Quarters Theory
1. Installation: Place your file in the MQL/Indicators folder via "Open Data Folder" and restart your terminal.
2. Loading: Find the indicator in the Navigator, drag it onto your chart, and configure the input parameters in the popup window.
3. Customization: Press Ctrl+I to open the indicator list, select your tool, and click "Properties" to change colors, levels, or visual styles.
4. Updating: Replace the old file in the Indicators folder with the new version and restart the platform to apply changes.
Frequently Asked Questions
Q: Why is my indicator not showing? A: Verify the file is in the MQL/Indicators folder, or try right-clicking the "Indicators" tree in the Navigator and clicking "Refresh."
Q: Do custom indicators slow down the platform? A: Too many complex indicators can impact performance; remove unused ones via the "Indicator List" (Ctrl+I).
Q: Can I use MT4 indicators on MT5? A: No, MQL4 and MQL5 are distinct languages; ensure the indicator is compiled specifically for your platform version.
Description & Settings
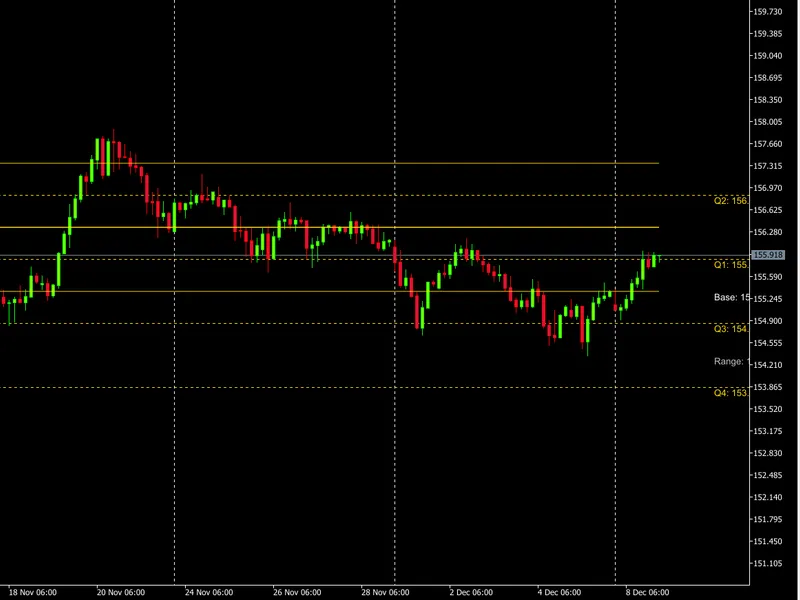
This indicator implements the "Quarters Theory" - a technical analysis concept that divides price movement into four quarters around a central base level. It's designed to work with multiple asset types (Forex, stocks, commodities, etc.) and provides visual quarter levels on the chart.
Quarters Theory Concept:
Base Level
: Central reference price
Quarter 1
: Price range from Base to Base + Quarter Range
Quarter 2
: Price range from Base + Quarter Range to Base + 2*Quarter Range
Quarter 3
: Price range from Base - Quarter Range to Base
Quarter 4
: Price range from Base - 2*Quarter Range to Base - Quarter Rang
1. Flexible Base Level Calculation:
Current Daily Close
: Latest closing price
Previous Day Close
: Yesterday's closing price
Previous Week Close
: Last week's closing price
Previous Month Close
: Last month's closing price
Weekly/Monthly Open
: Start of week/month price
Custom Level
: User-defined price level
2. Multiple Quarter Size Units:
Pips
: Forex-specific measurement
Points
: Smallest price increment
Percentage
: Percentage of base level
Absolute
: Fixed price value
3. Multi-Asset Support:
Automatically detects Forex vs. other instruments
Adjusts pip calculations for different symbol formats
Handles unavailable timeframes gracefully
Trading Applications:
Support/Resistance:
Quarter boundaries act as dynamic support/resistance
Middle lines as potential reversal points
Trend Analysis:
Price in Quarter 1/2 suggests bullish bias
Price in Quarter 3/4 suggests bearish bias
Quarter transitions indicate trend changes
Range Trading:
Trade bounces between quarter boundaries
Look for reactions at quarter midpoints