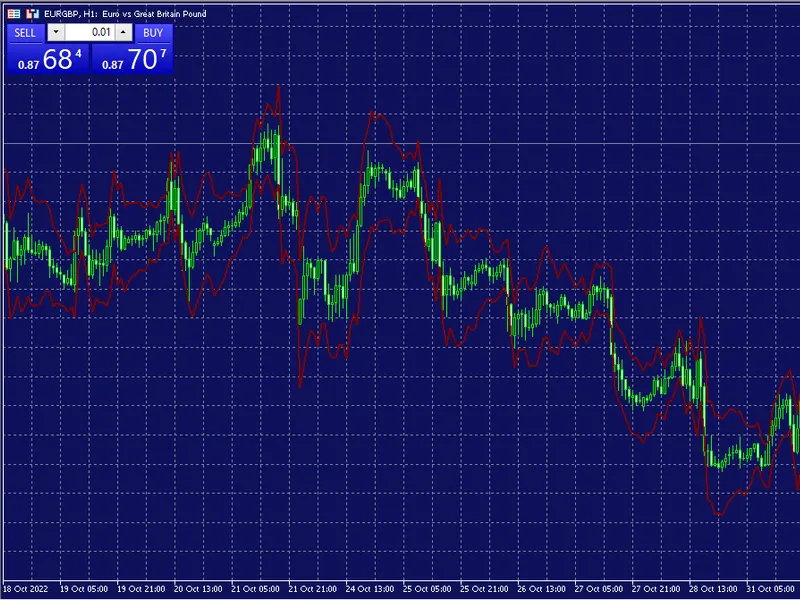
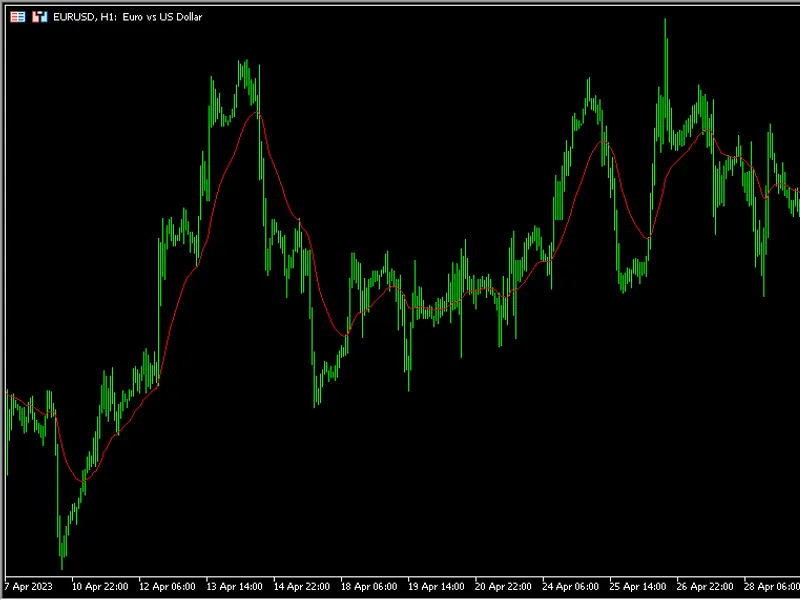
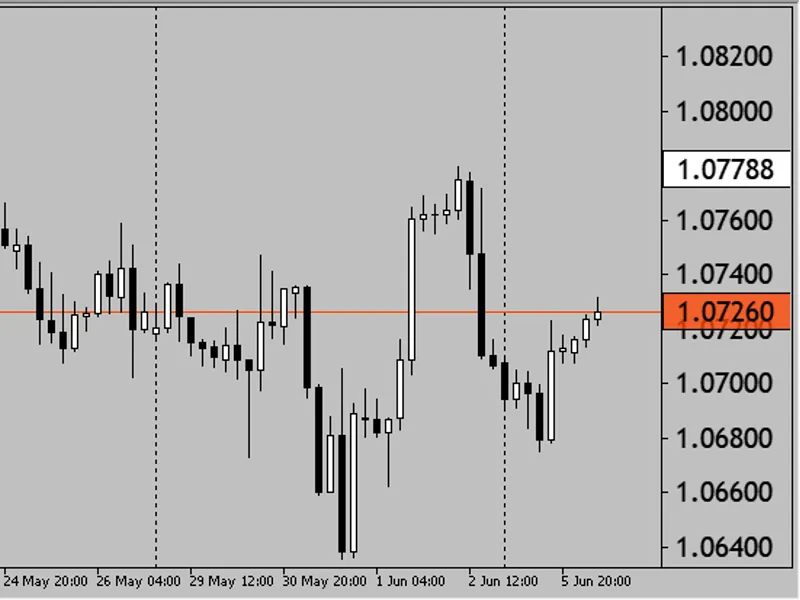
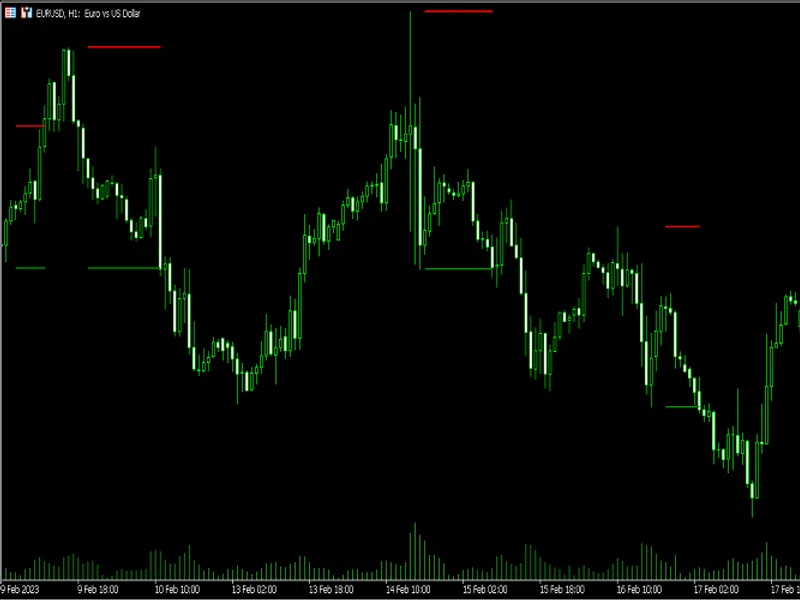
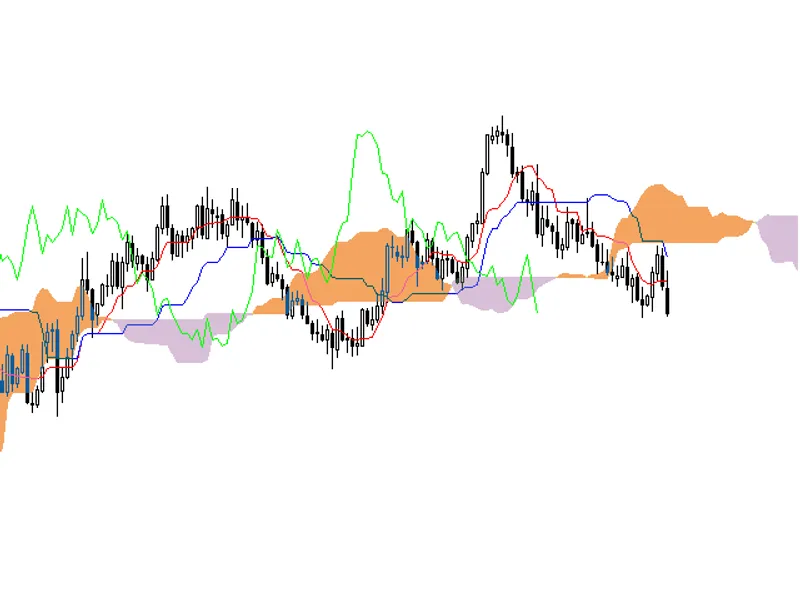
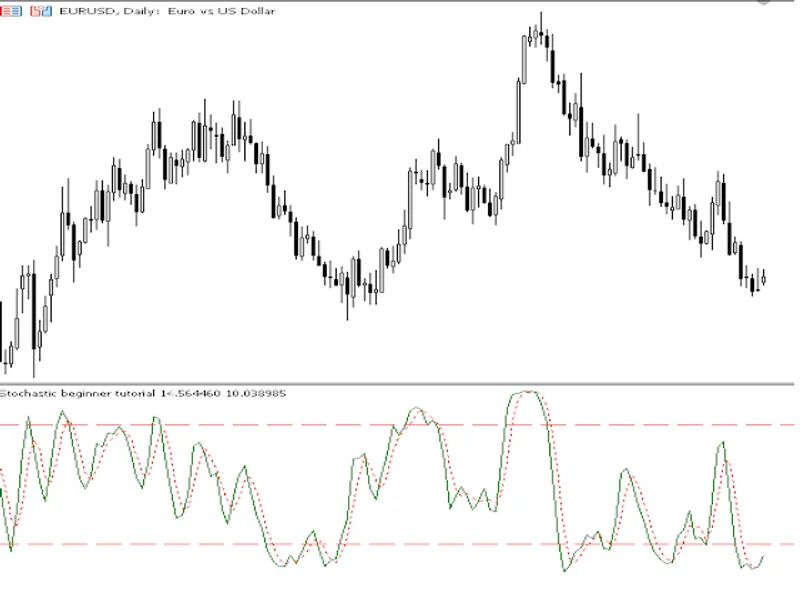
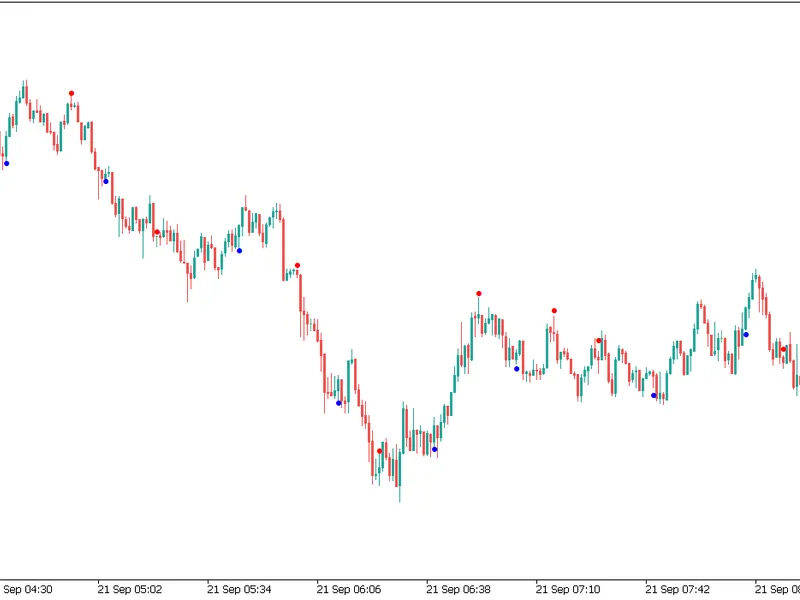
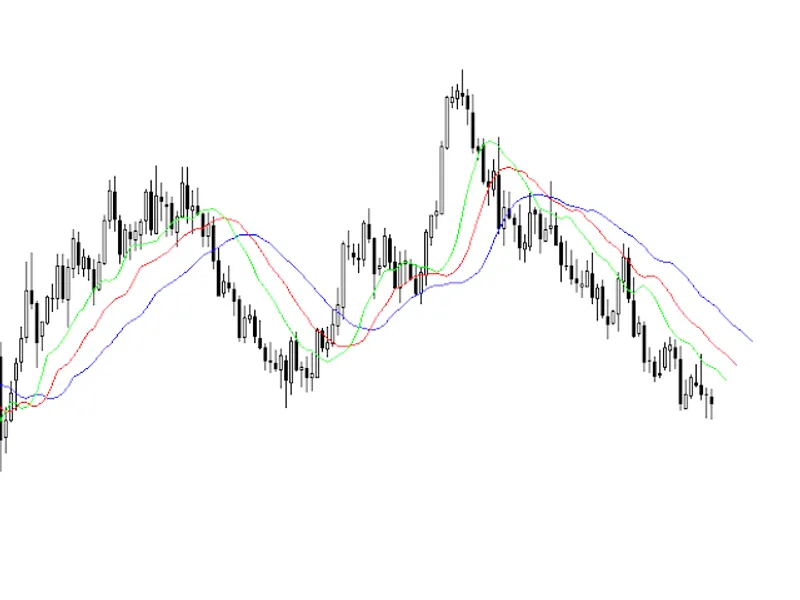
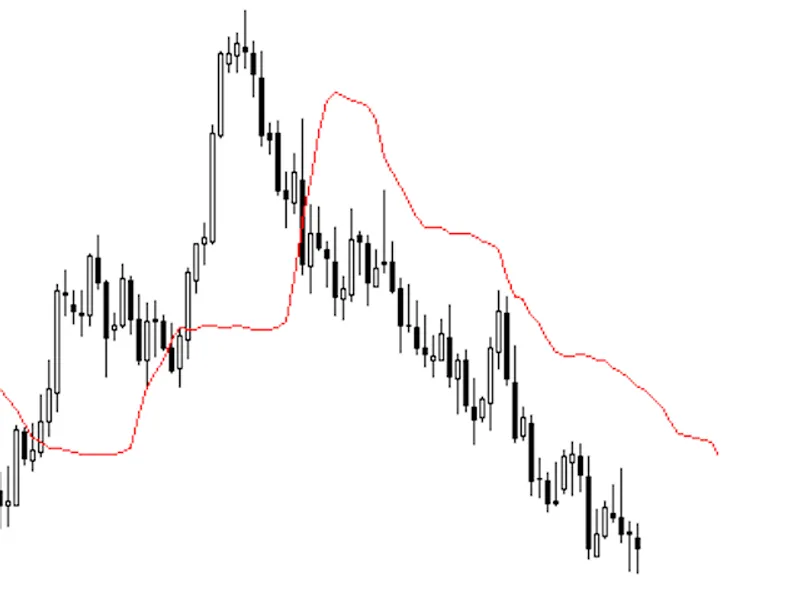
this indicator is used for stop loss placements with atr as reference and comes in two lines with equal distance from a moving average.the indicator can also be used for safety mea...
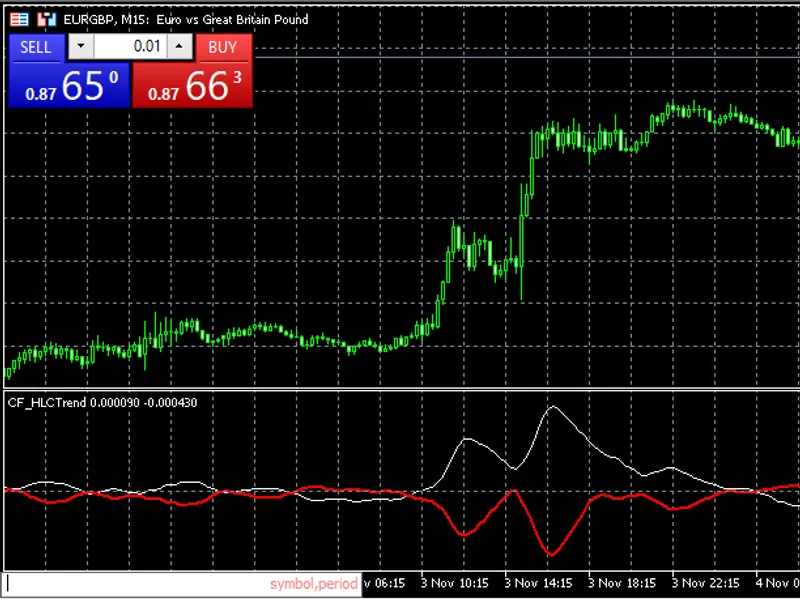
the hlc trend indicator is a confirmation indicator with sub-type as a two-line-crossover.buy signal: long line (white) crosses and closes above short line (red).sell signal: short...
this indicator shows trend line and channels using the bsi indicator.first, it will check the trend by bsi. then, draw the trend line or channels by condition. the trend line uses ...
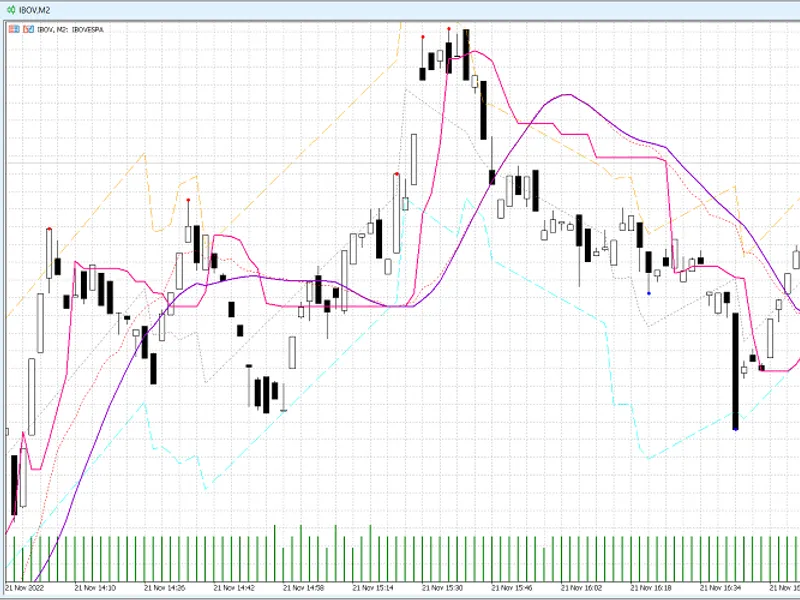
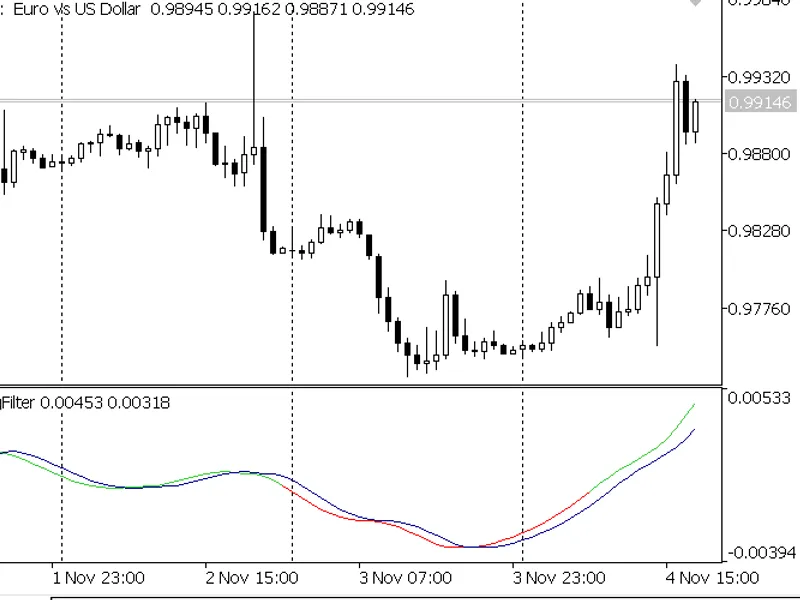
the roofing filter indicator was created by john ehlers ("cycle analytics for traders" pg. 80 - 82). when the indicator crosses over its signal then it is a short term uptrend and ...
typical unassuming volumes indicator, but divided by spread. i removed the color changing, as it became useless after dividing by spread. edit: ability to use spread or not. to be ...
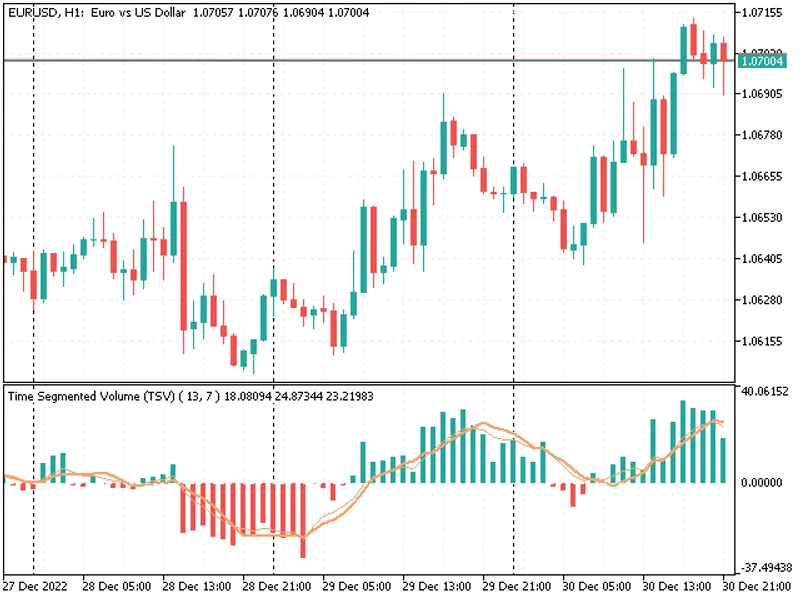
this indicator is based on the original “time segmented volume (tsv)” developed by worden brothers, inc. however, i added an extra few features to this one.one can choose the price...
1. shows moving last price on bid line + symbol name + countdown of candle closing + timeframe2. last 24 hours percentage change3. time based on input selection to the price line :...
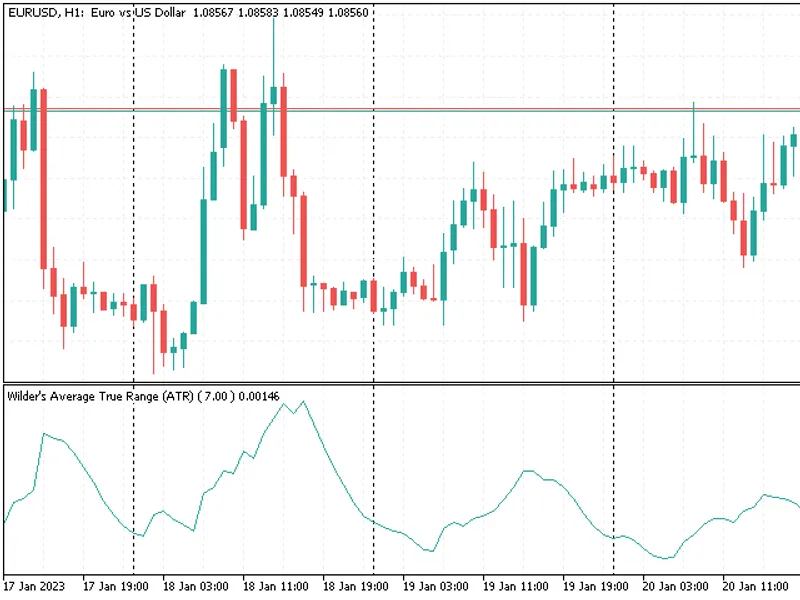
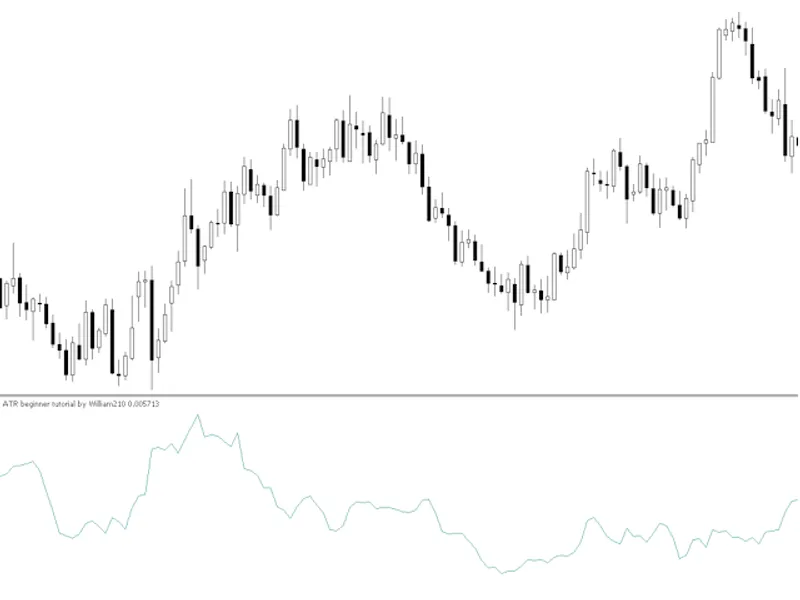
this indicator implements the original “average true range (atr)” developed by john welles wilder jr., as described in his book—new concepts in technical trading systems [1978].it ...
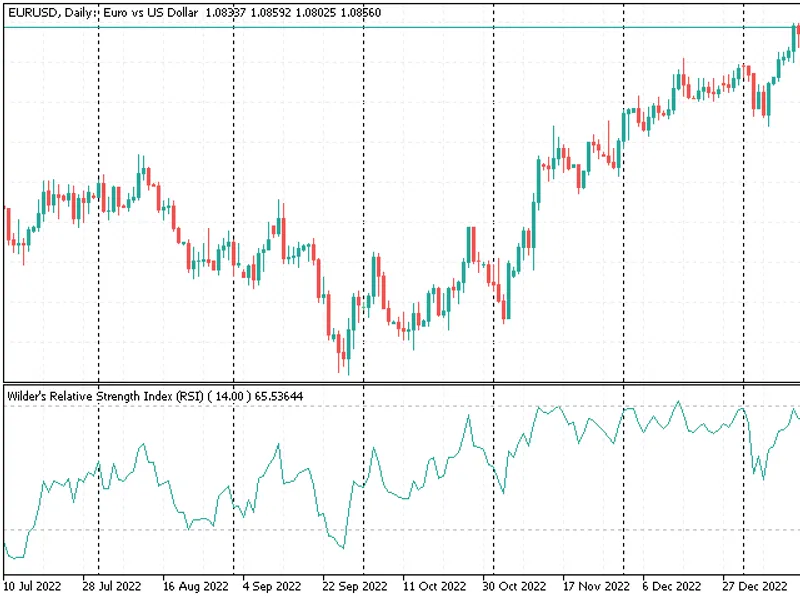
this indicator implements the “relative strength index (rsi)” developed by john welles wilder jr., as described in his book—new concepts in technical trading systems [1978].this in...
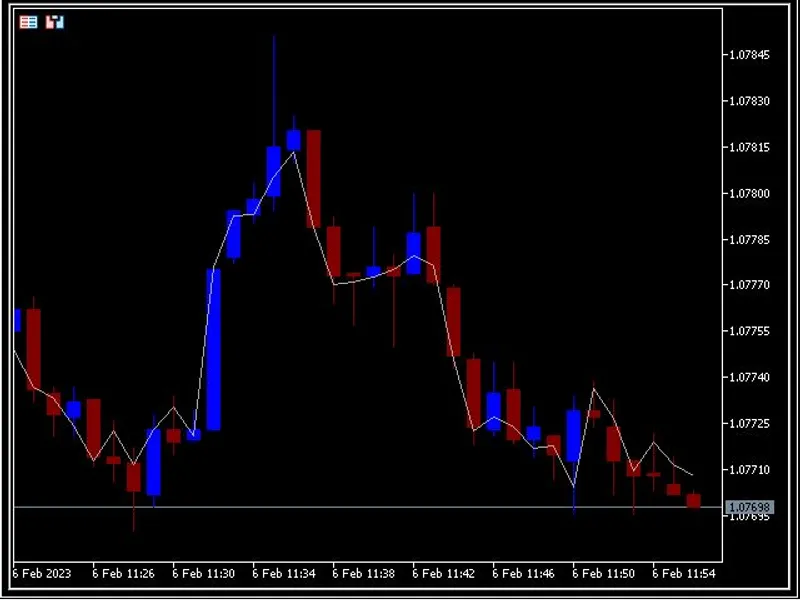
this line tries to reflect the main direction of the trend and it is calculated based on japanese candlestick data.if the trend is up, then the line is closer to the high prices of...
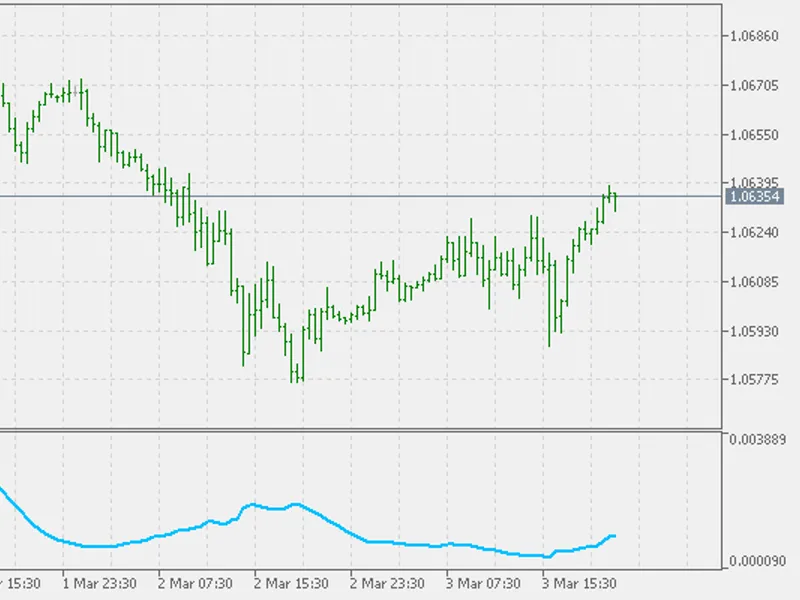
this weighted deviation is a sort of all linear weighted deviation. it uses linear weighting in all the steps calculated (which makes it different from the built in deviation in a ...
variation of the bollinger bands but it uses linear weighted average and weighted deviation (see the description of weighted deviation here : )recommendations:use it as any bolling...
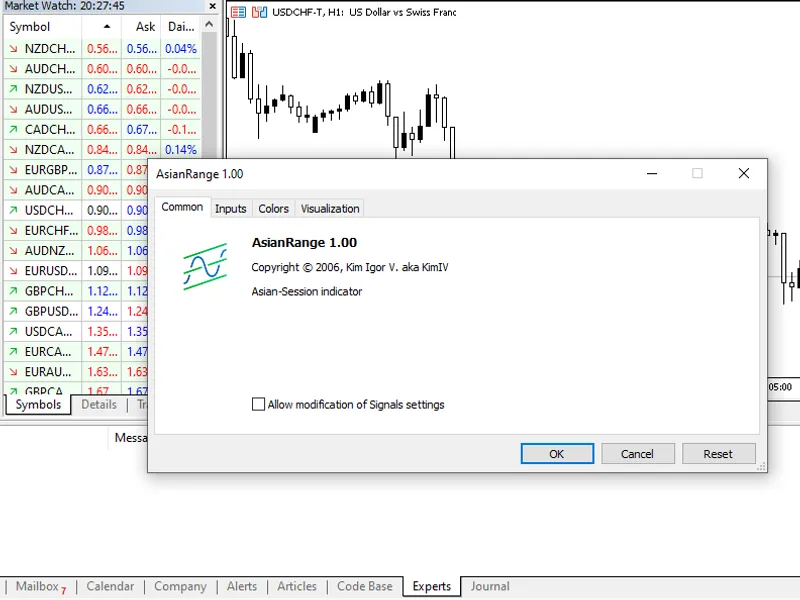
changes i added:1. isolated only the asian session.2. allow users to modify settings such as asian time in their local time, color of the boxes, and whether to fill boxes or not.3....
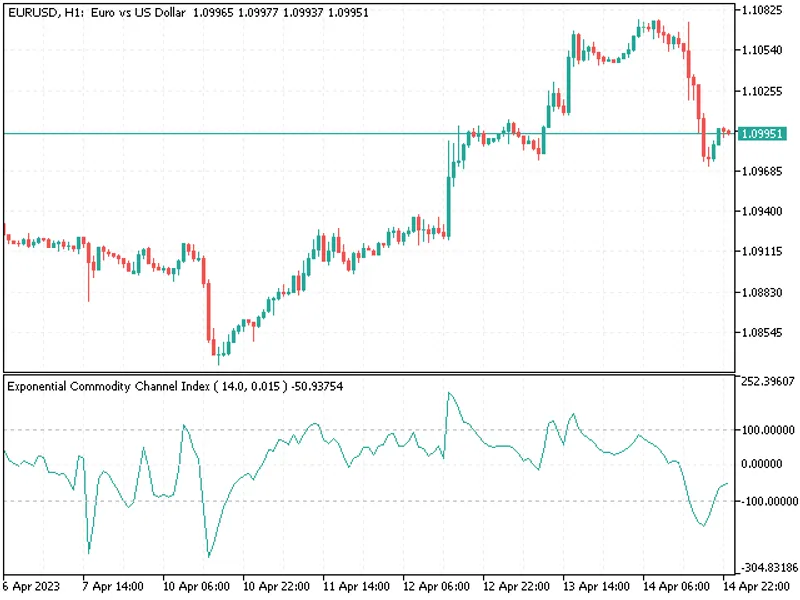
an implementation of the commodity channel index using exponential moving averages, instead of simple moving averages as implemented by the its creator, donald lambert.the code use...
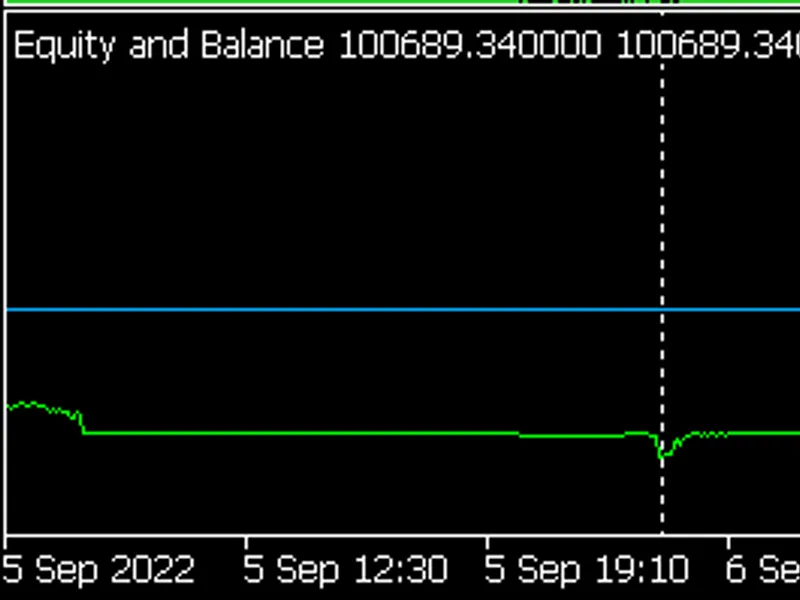
this indicator reads balance and reads equity from the trading account and displays them on a separate chart window. very simple, and really useful for backtesting.here is how it d...
1. rma relative moving average is a variant of ema, with a calculation factor of 1/cycle .2. there is only one input variable, which is the calculation period. if you need to chang...
the unique stock arrow indicator "strength index signal" is an indispensable tool for traders,based on analysis of currency strength. this indicator will help you make informed dec...
the basic idea behind the indicator is to check for bouncebacks between support and resistance levels. there are two input parameters: period and overlook. a support level is the l...
my goal was to make an indicator that triggers signals when the market price cuts the moving average.the moving average period length can be user defined (default is 200 length). t...
trend dashboard indicator metatrader 5 indicator — a multi-timeframe indicator that is based on three standard indicators: stochastic oscillator, rsi (relative strength index), and...
available formulas (ma_method)sma simple moving average ema exponential moving average wilder wilder exponential moving average lwma linear weighted moving average sinewma sine...
this is a helper function to allow you to translate the (x, y) pixel value to the price which you see on the y-axis, using a click press with onchartevent....
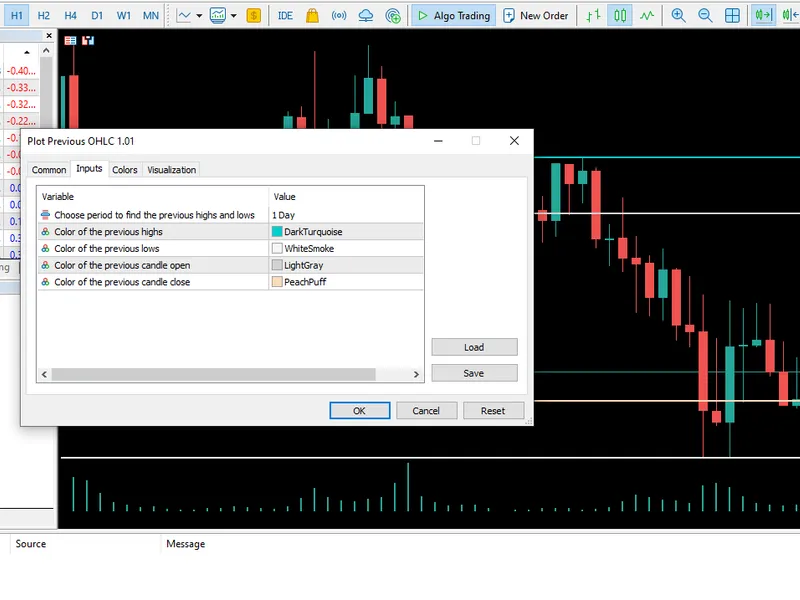
this indicator plots highs and lows as well as the open and close for the candle of the selected period. it is a multi-timeframe indicator which plot plot specific ohlc levels on t...
some indicators experience a bug where the plot drops horizontally or the buffer doesn't update on the chart. the problem can be solved by refreshing the chart.this will refresh th...
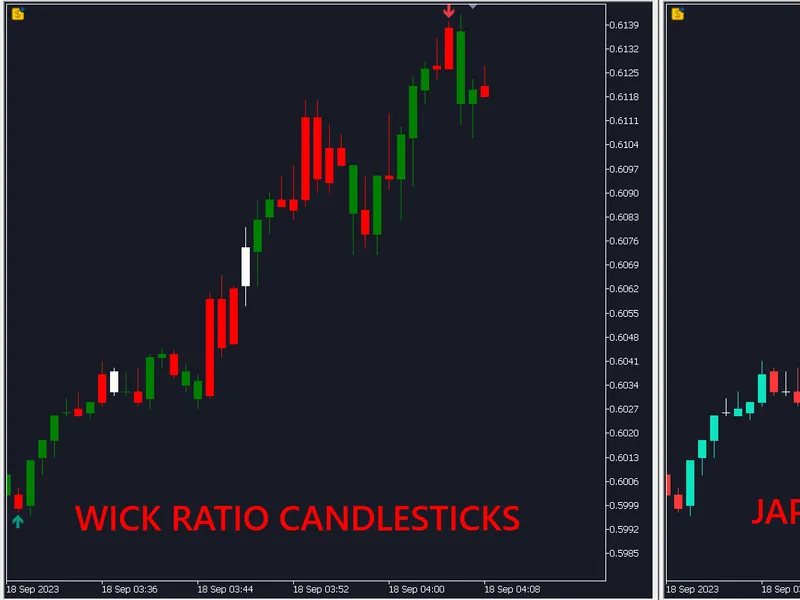
wick ratio candlesticks are recognized by its upper and lower wick ratio instead of open and close properties.by default a snow candle appear when upper wick = lower wickif upper w...
i did not understand the source of other hull ma implementations, so i decide to implement it myself. it has four input parameters:inphmaperiod = 20 inpcolorkind = single_color inp...
one of the "classics" but with a twist - unlike the built in fractals indicator, this one allows you to :adjust the fractals period (the built in fractal indicator is using period ...
my apologies, this code is no longer available and i don't know how to remove/hide it from codebasedon't forget to add stars to these codes for seo, thank you !!...
a marubozo is a long-bodied candlestick with no shadow, from the japanese word meaning "close-cropped". candlestick charts look at the opening and closing price on a single day and...
my apologies, this code is no longer available and i don't know how to remove/hide it from codebasehere is the comparison between the two indicators. they are quite identical...