Equity and Balance as an indicator for MT5
This professional-grade solution for MetaTrader 5 helps traders achieve greater efficiency in their daily workflow. This technical indicator acts as a specialized analysis tool designed to visualize market data. It helps traders identify emerging trends, momentum shifts, and key support or resistance levels by plotting statistical calculations directly onto price charts.
How to Setup and Use Equity and Balance as an indicator for MT5
1. Installation: Place your file in the MQL/Indicators folder via "Open Data Folder" and restart your terminal.
2. Loading: Find the indicator in the Navigator, drag it onto your chart, and configure the input parameters in the popup window.
3. Customization: Press Ctrl+I to open the indicator list, select your tool, and click "Properties" to change colors, levels, or visual styles.
4. Updating: Replace the old file in the Indicators folder with the new version and restart the platform to apply changes.
Frequently Asked Questions
Q: Why is my indicator not showing? A: Verify the file is in the MQL/Indicators folder, or try right-clicking the "Indicators" tree in the Navigator and clicking "Refresh."
Q: Do custom indicators slow down the platform? A: Too many complex indicators can impact performance; remove unused ones via the "Indicator List" (Ctrl+I).
Q: Can I use MT4 indicators on MT5? A: No, MQL4 and MQL5 are distinct languages; ensure the indicator is compiled specifically for your platform version.
Description & Settings
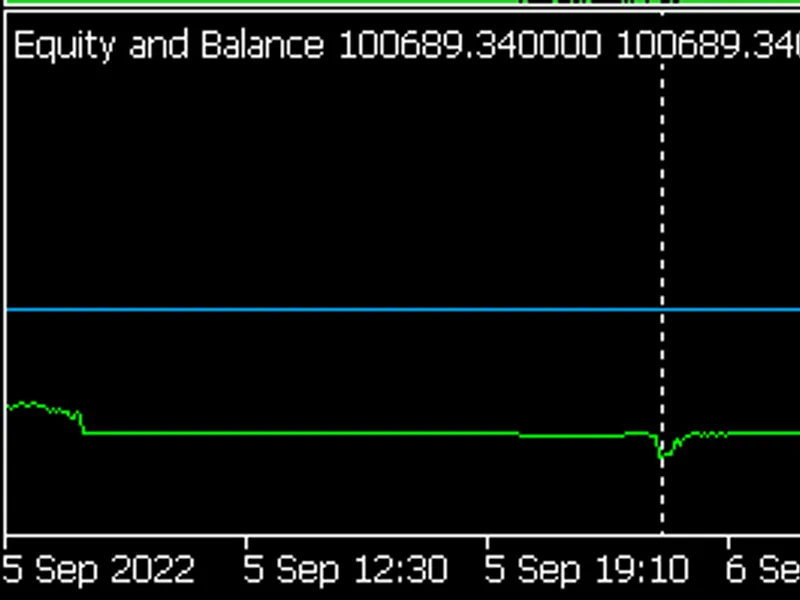
This indicator reads balance and reads equity from the trading account and displays them on a separate chart window. Very simple, and really useful for backtesting.
Here is how it displays... the blue line represents Balance over time and the green line represents equity and it´s fluctuations over time.
Known limitations:Because of the methods used to read balance and equity, AccountInfoDouble(), it is not able to go back in time to display data from before it was attached to the chart. It will only display dynamically the equity and balance from the time when it is attached to the chart. This means it is particularly more useful on backtests, and it is a tremendous tool to help analyze drawdown from very close, allowing the user to zoom in or zoom out, just as the user zooms in or out with the chart.Enjoy!