




equity chart modeller
Info
The equity chart modeller is a Indicator for MetaTrader 4 that this indicator is based on one of the versions of the well-known virtual equity indicator and has been adapted for portfolio modelling and pair trading purposes. what it doesthe indicator can:- construct equity curves for arbitrary synthetic instruments (portfolios)- compare portfolios/synthetic instruments with each other- plot graphs of differences between instruments and portfolios (hedging)how to use itthere are two main use cases:1.
Usage
This tool is typically used for enhancing chart analysis and decision making.
Platform
This Indicator works exclusively on MetaTrader 4 (both build 600+ and newer versions).
Setup
Place the downloaded file in MQL4/Indicators folder via File ? Open Data Folder in MetaTrader 4.
How to Install and Use equity chart modeller
1. Installation: Place your file in the MQL/Indicators folder via "Open Data Folder" and restart your terminal.
2. Loading: Find the indicator in the Navigator, drag it onto your chart, and configure the input parameters in the popup window.
3. Customization: Press Ctrl+I to open the indicator list, select your tool, and click "Properties" to change colors, levels, or visual styles.
4. Updating: Replace the old file in the Indicators folder with the new version and restart the platform to apply changes.
Frequently Asked Questions
Q: Why is my indicator not showing? A: Verify the file is in the MQL/Indicators folder, or try right-clicking the "Indicators" tree in the Navigator and clicking "Refresh."
Q: Do custom indicators slow down the platform? A: Too many complex indicators can impact performance; remove unused ones via the "Indicator List" (Ctrl+I).
Q: Can I use MT4 indicators on MT5? A: No, MQL4 and MQL5 are distinct languages; ensure the indicator is compiled specifically for your platform version.
What this tool does
this indicator is based on one of the versions of the well-known virtual equity indicator and has been adapted for portfolio modelling and pair trading purposes.
Typical Use Case
This Indicator excels in automated trading and technical analysis on MetaTrader 4.
Compatible Platform & Setup
This Indicator works on MetaTrader 4. Place the file in the MQL4/Indicators folder and restart the terminal.
Description & Settings
Related: albus multi chart 1: advanced chart overlay for metatrader - another powerful indicator for MetaTrader 4 traders.
this indicator is based on one of the versions of the well-known virtual equity indicator and has been adapted for portfolio modelling and pair trading purposes.Also recommended: macd indicator on price chart - similar indicator with strong performance on MetaTrader 4.
what it does
the indicator can:
- construct equity curves for arbitrary synthetic instruments (portfolios)
- compare portfolios/synthetic instruments with each other
- plot graphs of differences between instruments and portfolios (hedging)
how to use it
there are two main use cases:
1.
pair trading/hedging
– can be implemented as trading divergences: between two correlated instruments, between one instrument and a correlated synthetic, or between two correlated synthetics.
2.
portfolio trading
– involves buying a growing portfolio (trend-following synthetic) and holding positions for a certain period to realize profits, with averaging on declines and/or pyramiding on growth.
how to calculate portfolios
portfolio calculations can be performed in any statistical package (ms excel, r, statistica, sas, spss). data export and price conversion to equity values can be done using the equity data saver script. the exported data should be subjected to any optimization method, such as multifactorial regression. coefficients in the model are adjusted so that the synthetic best mimics the movements of a particular instrument (hedging model) or a linear trend (constant growth model). the obtained coefficients are scaled and rounded to the required lot size.
how to input portfolio formulas
portfolio/synthetic formulas are entered in a format developed by xupypr: first, the instrument code is specified, then a plus or minus sign, and then the number of lots (integers or fractions). a plus sign indicates a buy, and a minus sign indicates a sell. the separator is a space. example of a multi-currency portfolio formula: usdsek-4 usdcad+9 eurjpy-5 audnzd-5 euraud-1 gbpjpy+6 usdnok-2
indicator parameters
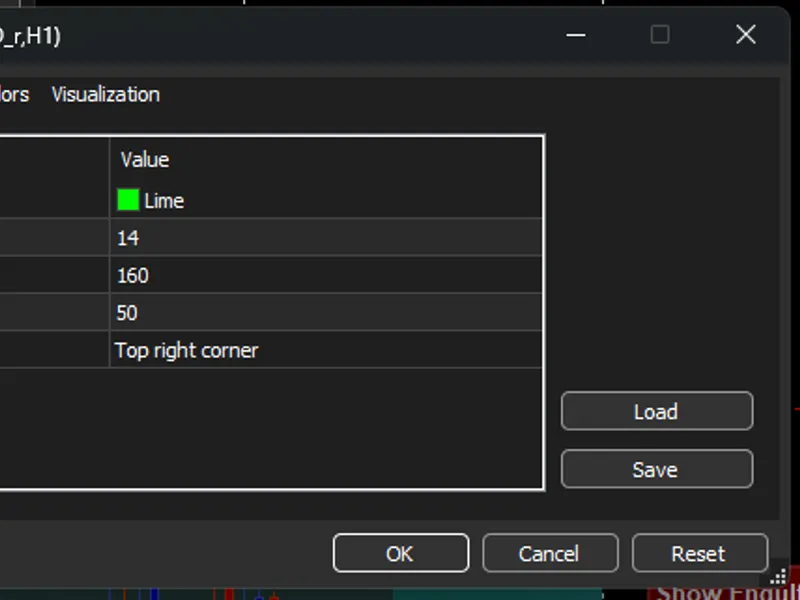
- time_start_chart – start date and time of the chart (analysis period)
- time_stop_chart – end date and time of the chart (analysis period)
- time_zero_level – date and time for selecting the zero level of the chart (reference point, zero point)
- portfolio_formula_a – formula for the main portfolio/synthetic
- portfolio_formula_b – formula for the hedging portfolio/synthetic (optional)
- lot_divider – number by which all lots in the formulas will be divided (100 converts integer lots to micro-lots)
- period_zero_level - timeframe for selecting data values for the zero point (1440 - daily timeframe)
- plot_difference – option to plot the graph of differences between two portfolios/synthetics
- plot_inversion - option to flip the difference graph around the horizontal axis
- show_grid - option to overlay a grid on the chart (volatility assessment, trading by levels)
- grid_interval - grid spacing (specified in the deposit currency)
- color_portfolio_1, color_portfolio_2, color_difference – line and label colors
- update_seconds – auto-update period in seconds
display features
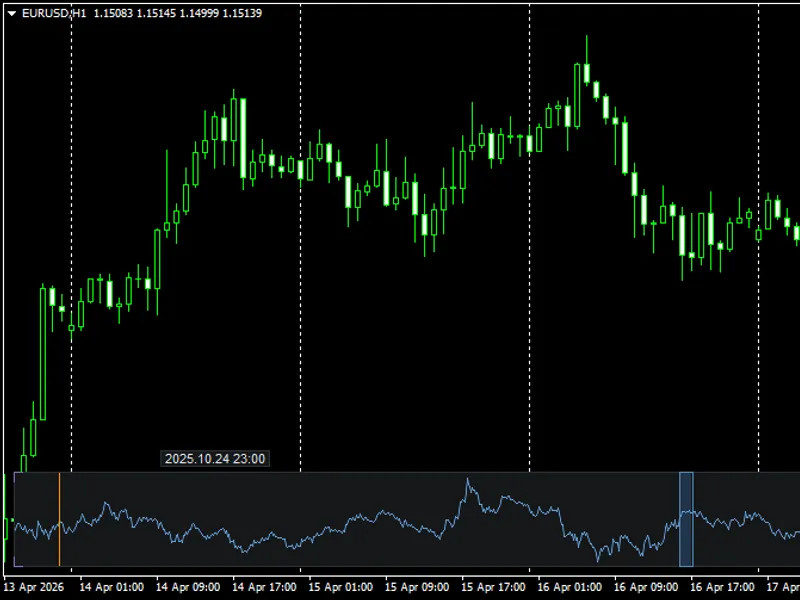
on the left edge of the window, portfolio/synthetic formulas are displayed, with their color corresponding to the curve colors on the chart. formulas are displayed vertically to save screen space. if plot_difference and plot_inversion options are applied, the signs in the displayed formulas are automatically changed as needed, ensuring consistency between the displayed charts and formulas. a customizable grid can be used to assess the volatility range of the synthetic using the show_grid and grid_interval options.
working with history
the time_zero_level parameter determines the virtual opening time of positions (portfolio purchase). if time_start_chart precedes time_zero_level, the portfolio will also be modeled in the past. the indicator automatically checks the history depth of all instruments in the portfolio. these checks ensure that the zero point always has available history. experimentally changing time_zero_level also allows for finding the best match between two curves in a hedging model. the period_zero_level parameter allows for forcing the selection of data values for the zero point from a specific timeframe. this is relevant when there is insufficient history on lower timeframes to obtain values for the bar of the reference point, which distorts the charts on lower timeframes. a value of 1440 (daily) almost always minimizes the problem of scale distortions when switching timeframes.
graph update features
in the latest version of the indicator, the chart is updated automatically every update_seconds seconds.
costs
spreads, swaps, and commissions are not considered.
trading instruments
this version allows for building portfolios not only on currency pairs but also on cfd contracts.
units of measurement
charts and calculated indicators are displayed in the deposit currency. in offline mode, calculations are in usd.
important note
the indicator outputs the results of modelling the opening of a single synthetic position. averaging within a portfolio increases costs and can change the actual drawdown depth, portfolio growth rate, and recovery time after a drawdown. to model specific trades on history, it is recommended to use the original virtual equity indicator by xupypr.
updates in the latest version
- compatibility with the new version of the mql language has been ensured.
- auto-update of the chart has been restored.
- some minor bugs have been fixed.
usage examples
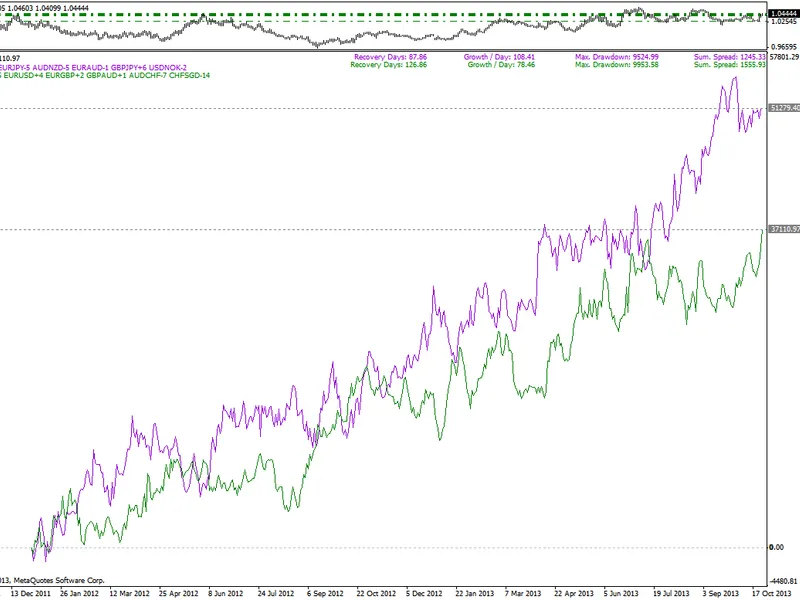
- comparison of the dynamics of two multi-currency portfolios (synthetics)
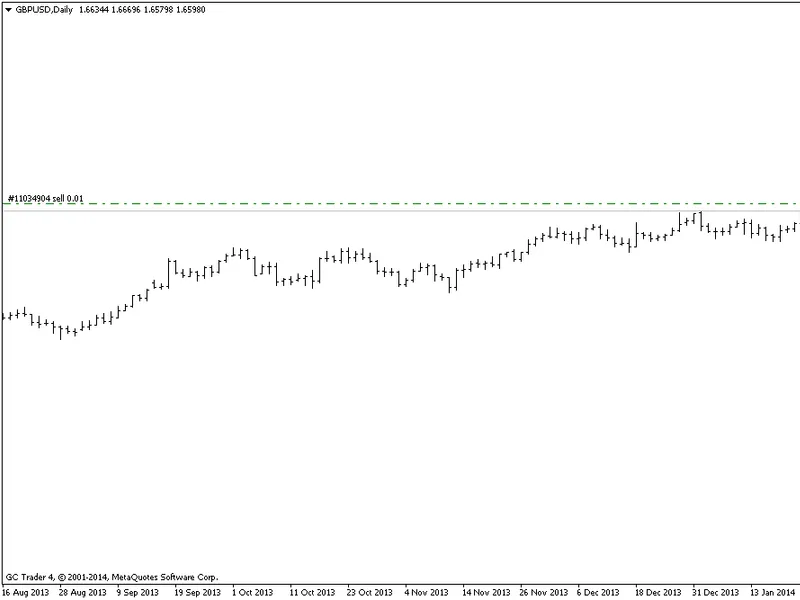
- spread chart (currency pair against synthetic) with an overlaid grid of levels
You may also like: wcci chart indicator - excellent alternative for indicator users on MetaTrader 4.
Source Code
#property copyright "robotfx"
#property indicator_separate_window
#property indicator_buffers 3
#property indicator_level1 0
extern datetime time_start_chart=d'2012.01.01 00:00';
extern datetime time_stop_chart=d'2019.12.31 00:00';
extern datetime time_zero_level=d'2012.01.01 00:00';
extern string   portfolio_formula_a="";
extern string   portfolio_formula_b="";
extern double   lot_divider=100;
.......
⚠ Limitations & Risk Warning
- This tool is provided for educational and testing purposes only.
- Past performance does not guarantee future results.
- Trading involves substantial risk of loss. Use on a demo account first.
- Results may vary depending on market conditions, broker, and settings.
- We recommend thorough backtesting and forward testing before using with real funds.