



equity and balance indicator - history based
Info
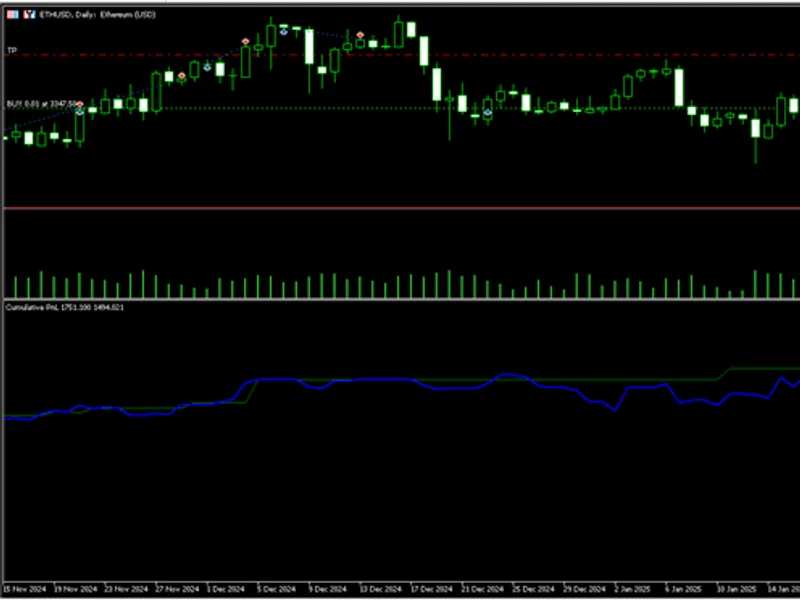
The equity and balance indicator - history based is a Indicator for MetaTrader 5 that cumulative p&l indicatoroverviewthe cumulative p&l indicator displays your account's balance and equity evolution over time as two separate lines on a chart. it provides a visual representation of your trading performance by tracking both realized profits (balance) and unrealized profits (equity) throughout your trading history.
Usage
This tool is typically used for enhancing chart analysis and decision making.
Platform
This Indicator works exclusively on MetaTrader 5 (both build 600+ and newer versions).
Setup
Place the downloaded file in MQL5/Indicators folder via File ? Open Data Folder in MetaTrader 5.
How to Install and Use equity and balance indicator - history based
1. Installation: Place your file in the MQL/Indicators folder via "Open Data Folder" and restart your terminal.
2. Loading: Find the indicator in the Navigator, drag it onto your chart, and configure the input parameters in the popup window.
3. Customization: Press Ctrl+I to open the indicator list, select your tool, and click "Properties" to change colors, levels, or visual styles.
4. Updating: Replace the old file in the Indicators folder with the new version and restart the platform to apply changes.
Frequently Asked Questions
Q: Why is my indicator not showing? A: Verify the file is in the MQL/Indicators folder, or try right-clicking the "Indicators" tree in the Navigator and clicking "Refresh."
Q: Do custom indicators slow down the platform? A: Too many complex indicators can impact performance; remove unused ones via the "Indicator List" (Ctrl+I).
Q: Can I use MT4 indicators on MT5? A: No, MQL4 and MQL5 are distinct languages; ensure the indicator is compiled specifically for your platform version.
What this tool does
cumulative p&l indicatoroverviewthe cumulative p&l indicator displays your account's balance and equity evolution over time as two separate lines on a chart.
Typical Use Case
This Indicator excels in automated trading and technical analysis on MetaTrader 5.
Compatible Platform & Setup
This Indicator works on MetaTrader 5. Place the file in the MQL5/Indicators folder and restart the terminal.
Description & Settings
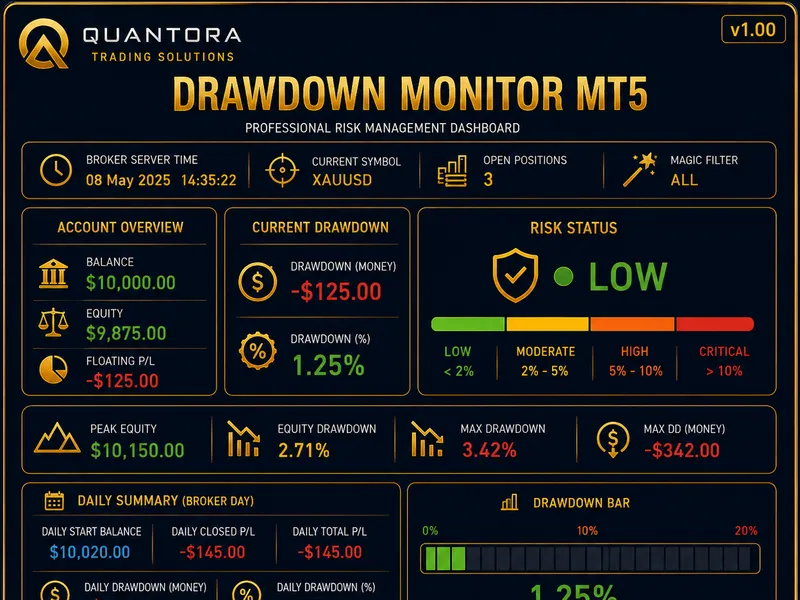
Related: Quantora Drawdown Monitor MT5 - Professional Account Risk and Equity Drawdown Monitor - another powerful indicator for MetaTrader 5 traders.
Also recommended: FVG Imbalance Marker Helper - similar indicator with strong performance on MetaTrader 5.
cumulative p&l indicatoroverview
the cumulative p&l indicator displays your account's balance and equity evolution over time as two separate lines on a chart. it provides a visual representation of your trading performance by tracking both realized profits (balance) and unrealized profits (equity) throughout your trading history. features - balance line (green): shows the cumulative realized p&l from closed positions, including profit, swap, and commission - equity line (blue): shows total equity (balance + unrealized p&l from open positions) - multi-symbol support: accurately tracks positions across all symbols, not just the chart symbol - historical accuracy: reconstructs portfolio state at each bar to show accurate historical equity curves - swap tracking: includes overnight swap charges in calculations how it works the indicator: 1. analyzes your complete trading history from account opening 2. calculates realized p&l at each bar from closed trades 3. tracks open positions and calculates unrealized p&l based on historical prices 4. combines both to show your equity curve evolution installation 1. download the indicator file 2. place it in your mql5/indicators folder 3. compile in metaeditor (f7) 4. attach to any chart usage simply attach the indicator to any chart. it will automatically: - display in a separate window below your main chart - show two lines: balance (green) and equity (blue) - update in real-time as your positions change technical details - indicator type: separate window indicator - buffers: 2 (balance and equity) - timeframe: works on all timeframes - symbols: tracks all symbols in your account benefits - performance visualization: see how your account has grown over time - risk assessment: identify periods of drawdown by comparing equity to balance - strategy validation: evaluate if your trading strategy is consistently profitable - multi-asset tracking: monitor performance across different instruments notes - the indicator shows cumulative values starting from your first trade - for best performance on accounts with extensive history, use higher timeframes (h1, d1) - the equity line includes current swap charges for open positions
You may also like: gold fvg finder: identifying and trading market imbalances - excellent alternative for indicator users on MetaTrader 5.
Source Code
#property indicator_separate_window
#property indicator_buffers 2
#property indicator_plots   2
#property indicator_type1   draw_line
#property indicator_color1  clrgreen
#property indicator_label1  "balance"
#property indicator_width1  1
#property indicator_type2   draw_line
#property indicator_color2  clrblue
#property indicator_label2  "equity"
.......
⚠ Limitations & Risk Warning
- This tool is provided for educational and testing purposes only.
- Past performance does not guarantee future results.
- Trading involves substantial risk of loss. Use on a demo account first.
- Results may vary depending on market conditions, broker, and settings.
- We recommend thorough backtesting and forward testing before using with real funds.