Correlation Coefficient
This is a powerful addition to your MetaTrader 5 toolkit designed to optimize market analysis and performance. This technical indicator acts as a specialized analysis tool designed to visualize market data. It helps traders identify emerging trends, momentum shifts, and key support or resistance levels by plotting statistical calculations directly onto price charts.
How to Setup and Use Correlation Coefficient
1. Installation: Place your file in the MQL/Indicators folder via "Open Data Folder" and restart your terminal.
2. Loading: Find the indicator in the Navigator, drag it onto your chart, and configure the input parameters in the popup window.
3. Customization: Press Ctrl+I to open the indicator list, select your tool, and click "Properties" to change colors, levels, or visual styles.
4. Updating: Replace the old file in the Indicators folder with the new version and restart the platform to apply changes.
Frequently Asked Questions
Q: Why is my indicator not showing? A: Verify the file is in the MQL/Indicators folder, or try right-clicking the "Indicators" tree in the Navigator and clicking "Refresh."
Q: Do custom indicators slow down the platform? A: Too many complex indicators can impact performance; remove unused ones via the "Indicator List" (Ctrl+I).
Q: Can I use MT4 indicators on MT5? A: No, MQL4 and MQL5 are distinct languages; ensure the indicator is compiled specifically for your platform version.
Description & Settings
The correlation coefficient (CC) is used in statistics to measure the correlation between two sets of data. In the world of trading, data sets can be any financial instrument. Simply put, the correlation between two financial instruments is the degree to which they are related. Correlation is based on a scale of 1 to -1. The closer the correlation coefficient is to 1, the higher the positive correlation between the two instruments, which will move up and down at the same time. The closer the correlation is to -1, the stronger the instruments move in opposite directions. A value of 0 indicates no correlation. The indicator values fluctuate between positive and negative correlation, which indicates how synchronously the prices of two instruments move. A correlation coefficient of +1 is a perfect positive correlation and prices are moving in perfect synchronisation. A correlation coefficient of -1 represents a perfect negative correlation, where prices move in exactly opposite directions. Both of these extremes are rare, and the correlation coefficient often fluctuates somewhere between the maximum values. A correlation coefficient of 0 is the midpoint indicating that there is no correlation between two instruments.
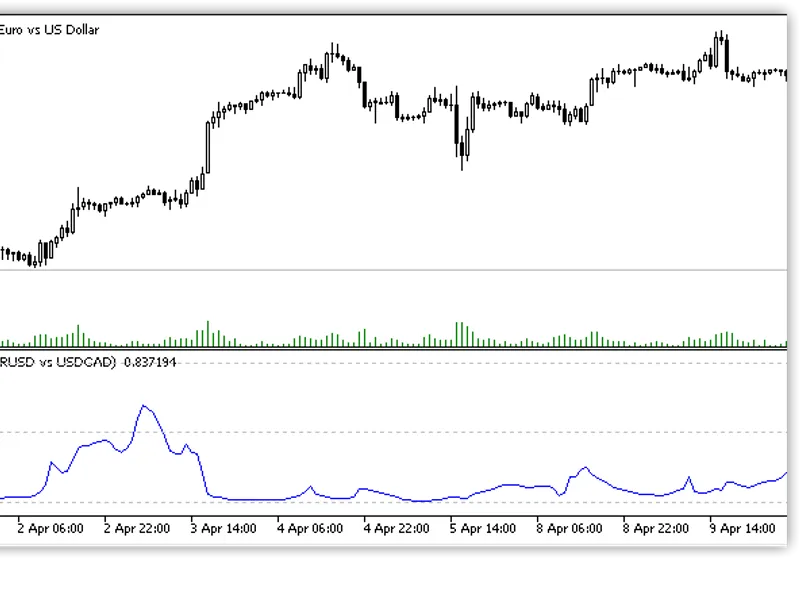
The correlation coefficient between EURUSD and USDCAD:
USDCAD chart overlaid on the EURUSD chart and their correlation coefficient:
Unlike many technical analysis indicators, the correlation coefficient is ideal for long-term investing. If an investor is going to build a truly diversified portfolio, the correlation coefficient can be very useful. It can help determine how much the assets in the portfolio differ from each other. In other words, by having instruments with low correlation, unnecessary duplicated risk can be avoided.
The indicator has three customisable parameters:
Symbol
- indicates the symbol name of the second instrument. The first symbol is the symbol on which the indicator is launched;
Source
- source of prices. It defines at what prices the correlation of two instruments will be calculated;
Length
- calculation period. It indicates the number of bars for which the correlation coefficient will be calculated.
As mentioned earlier, the correlation coefficient can be a useful tool when compiling a diverse portfolio. However, one thing to always keep in mind is that the correlation between two instruments can and does change from time to time. This indicator will help a trader to be aware of such changes and modify their investments accordingly.